City, University of London Institutional Repository
Citation
: Bilinski, P. and Mohamed, A. (2015). The Signaling Effect of Durations between
Equity and Debt Issues. Financial Markets, Institutions, & Instruments, 24(2-3), pp. 159-190. doi: 10.1111/fmii.12027This is the accepted version of the paper.
This version of the publication may differ from the final published
version.
Permanent repository link:
http://openaccess.city.ac.uk/7634/Link to published version
: http://dx.doi.org/10.1111/fmii.12027
Copyright and reuse:
City Research Online aims to make research
outputs of City, University of London available to a wider audience.
Copyright and Moral Rights remain with the author(s) and/or copyright
holders. URLs from City Research Online may be freely distributed and
linked to.
1
The Signaling Effect of Durations between
Equity and Debt Issues
*
B
Y
P
AWEL
B
ILINSKI AND
A
BDULKADIR
M
OHAMED
This study examines whether durations between equity and debt offerings allow investors to identify firms that are more likely to time issues of overvalued securities. We show that firms with higher stock overpricing are more likely to quickly issue both seasoned equity and debt following the previous capital acquisition. Investors understand issuers’ incentives to quickly return to the capital market and react less favorably to equity and debt issues that follow shortly after the previous offering. Together, the results show that durations between equity and debt issues provide valuable signals to investors on whether the issuer is likely to be timing the market.
Keywords: seasoned equity and debt offerings, market timing, duration analysis, announcement effect.
I. INTRODUCTION
Over the last few decades, a large body of research has examined why companies raise external financing and the trade-off between equity and debt financing (Marsh, 1982; Jalilvand and Harris, 1984; Bayless and Chaplinsky, 1990; Jung et al., 1996; Hovakimian et al., 2001; Hovakimian, 2004; Leary and Roberts, 2010; DeAngelo et al., 2010). However, previous studies do not explore whether durations between equity and debt offerings signal the motive for the issues, e.g. whether a short
Corresponding author: Pawel Bilinski, Cass Business School, City University London, London, EC1Y8TZ,
2
duration between consecutive offerings signals that the company is timing the issue of an overvalued security. If a short duration between offerings reveals the intent to time the market, investors will react less favorably to equity and debt issues that follow quickly from the previous offering. This study fills the gap in the literature by examining (1) whether stock overpricing affects durations between equity and debt offerings, and (2) whether durations between equity and debt offerings impact the price reaction to equity and debt issue announcements.
Using a sample of 4,598 equity issues and 8,983 debt issues over the period 1975–2008, we first examine how stock mispricing affects durations between equity and debt issues. We use the Cox (1972) proportional hazard model to investigate durations. Multivariate analysis shows that higher stock overpricing accelerates seasoned equity and debt issues. Specifically, high positive abnormal returns accelerate both the first seasoned equity offering after the IPO, and all subsequent seasoned equity issues. Further, stock overpricing shortens durations to the first debt issue after the IPO, and accelerates all subsequent debt issues.1 Together, duration regressions confirm that stock overpricing
affects the time between seasoned equity and debt issues.
The duration analysis results reveal that the time between offerings can help investors understand the purpose of the issue. Specifically, firms with a higher level of stock overpricing are more likely to quickly issue equity and debt following the previous capital acquisition. This evidence suggests that investors should react more unfavorably to equity and debt issues that follow closely from the previous offering, as these offerings are likely to be timing the market. Consistent with this proposition, we find a negative price reaction of −3.296% for equity offerings made within one year of the IPO, but −1.532% for equity issues made at least two years after the IPO. Comparable results are present for equity issues subsequent to the first equity offering after the IPO. We find similar
1 The evidence that equity overpricing predicts the time to a debt issue is consistent with the findings in Spiess and
3
evidence of a positive relation between debt announcement returns and durations between debt issues. To illustrate, the abnormal price reaction to the first debt offering made within a year of the IPO is not statistically different from zero, however, the abnormal price reaction to debt offerings made at least two years after the IPO equals 2.88%.
The positive relation between the price reaction to equity and debt issue announcements and durations between equity and debt offerings also persists in the multivariate analysis. Specifically, controlling for standard measures of stock overpricing, we document that durations between equity and debt issues have an incremental power in explaining equity and debt issue announcement returns.2 Together, our results demonstrate that (1) short durations between equity and debt
offerings indicate that firms are more likely to be timing offerings of overvalued securities and (2) that investors mark down prices of stocks that issue seasoned securities quickly following the previous offering.
This study makes two important contributions to the literature on seasoned equity and debt issues. First, it adds to the fledgling literature that examines durations between external capital acquisitions.3 Specifically, we show that firms with higher stock overpricing are on average more
likely to quickly issue seasoned equity or debt following the previous capital acquisition. Thus, the results of this study will be of interest to investors, both institutional and individual, whose wealth may be affected by the timing of the firm’s decision to issue equity or debt.
Second, to the best of our knowledge, our study is the first to document that the timing of equity and debt issues from the previous offering signals issuer quality and that investors respond less favorably to equity and debt issue announcements that follow quickly from the previous offering. This result adds important new evidence to the literature that examines the signaling effects
2 The regressions also control for other predictors of announcement day returns and include proxies for information
asymmetry, stock liquidity, leverage, return volatility, cash holdings, firm growth options and investments.
4
of equity and debt issue announcements (Myers, 1984; Myers and Majluf, 1984; Asquith and Mullins, 1986; Eckbo and Masulis, 1992; Gomes and Phillips, 2012).
The rest of the paper is organized as follows. Section 2 reviews the literature, and Section 3 describes the duration model. We describe the data and present the descriptive statistics in Section 4. The duration analysis results are in Section 5. Section 6 presents evidence on the relation between the price reaction to announcements of equity and debt issues and the time between consecutive offerings. We conclude in Section 7.
II. LITERATURE REVIEW
This section reviews past research on the relation between stock mispricing and the equity and debt issue decision. We also review studies that examine price reactions to equity and debt issue announcements.
5
offerings starting from the firm’s IPO and finds that the recent stock return performance and future growth opportunities affect the time between equity issues.4
Myers and Majluf (1984) adverse selection model predicts a negative price reaction to equity issue announcements as the announcement signals that the stock is more likely to be overvalued. Consistent with this prediction, studies generally find a negative price reaction to equity issue announcements. Korajczyk et al. (1992) examine 1,285 equity issues over the period 1974–1983 and document a mean announcement date abnormal return of −2.94%. A more recent study by Heron and Lie (2004) finds a similar magnitude of the announcement day return to equity issues.
The evidence for timing of debt issues is mixed. Spiess and Affleck-Graves (1999) find that firms issuing seasoned debt underperform over the five-year post-issue period, which they attribute to managers’ ability to time the market. Bradshaw et al. (2006) document a negative relation between annual returns and net debt issues, which they claim reflects that firms time debt issues to periods where the stock is temporarily overpriced. However, Dichev and Piotroski (1999) do not find evidence of abnormal performance following debt issues, and Elliott et al. (2008) find that fairly-valued or underfairly-valued firms are more likely to issue debt than equity. Thus, the question on whether equity mispricing affects debt issue decisions requires further tests.
An early study by Dann and Mikkelson (1984) reports a significantly negative price reaction to debt issue announcements. However, subsequent studies generally conclude that there is no significant price reaction to debt issue announcements (Chaplinsky and Hansen, 1993; Jung et al., 1996; Howton et al., 1998). The latter evidence is consistent with the Myers and Majluf (1984) model that the risk of mispricing is lower for corporate debt compared to equity, and that debt offerings do not signal stock overpricing.
4 Our study differs from Qian (2005) as we focus on the signalling effect of durations between equity and debt issues.
6
Overall, previous studies find consistent evidence that firms issue seasoned equity following strong price appreciations and that investors react negatively to equity issue announcements. However, it is unclear how stock mispricing affects firm propensity to issue debt. We extend static predictions on the relation between stock mispricing and equity and debt offerings into a dynamic framework. Specifically, we propose that relative stock overpricing entices companies to issue equity shortly after the previous offering. Consequently, we expect equity issues that follow shortly after the previous offering to experience more negative price reactions at issue announcements. We leave open the sign of the relation between overpricing and the time to a debt issue, and the sign of the relation between the price reaction to a debt issue announcement and the time between a debt issue and the previous offering.
III. THE EMPIRICAL MODEL PREDICTING THE TIME BETWEEN OFFERINGS
We model the time between seasoned equity and debt offerings using a non-parametric proportional hazard model. Shumway (2001, 103) points out that “Hazard models are preferable to static models both theoretically and empirically”. This is because unlike static binary models, hazard models (1) explicitly account for the time from the previous capital transaction, (2) incorporate time-varying covariates, and (3) can include macro-economic variables that are identical for all firms at a given point in time. Further, we examine separately the time (1) between the IPO and the first seasoned equity and debt issue, and (2) the time between consecutive seasoned offerings. This is because factors affecting the time between seasoned issues are likely to differ between the first seasoned offering after the IPO and subsequent offerings.
7
t 0
| ( ) Lim P t T t t T t
h t
t
(1)
where h(t) is the hazard rate (i.e. the equity or debt issue rate) and P is the conditional probability of a firm issuing debt or equity within a short period of time between t and t +∆t, given that the firm has not issued equity or debt up to time t. The hazard function measures the instantaneous rate at which a firm issues equity or debt conditional on not having issued up to time t. To illustrate, the hazard rate for an equity or a debt issue at t=2 measures the probability that a firm will issue equity or debt during the next period, conditional on not having issued up to t=2.
We choose the non-parametric proportional hazard model, namely the Cox (1972) model, because the hazard curve for the duration to an equity or a debt issue can have an irregular shape, i.e. it could be monotonically increasing, but then decreasing over time. The hazard model also corrects for right-censoring of observations, producing consistent estimates of the time between equity and debt issues.5 Specifically, we estimate the following hazard model:
0
( : ) ( )exp( )
j j j
h t X h t X (2) where t is either (1) the time to the first seasoned equity or debt issue after the IPO, or (2) the duration between consecutive seasoned offerings for firm j. X is a vector of explanatory variables that we present in detail in the next sections, and hj(t: X) is the hazard rate conditional on the set of
explanatory variables X. hj0(t) is the baseline hazard, which is given no particular parameterization
and is left un-estimated. In other words, no assumptions are made about the shape of the hazard rate over time.6 β
j are the model parameters estimated through a partial likelihood function. A
positive β coefficient on a covariate X implies that an increase in the covariate accelerates the time to
5 See Shumway (2001), Hensler et al. (1997) and Espenlaub et al. (2012) for a more detailed discussion of the differences
between hazard and static predictive models.
8
an equity or a debt issue. A negative coefficient indicates that an increase in the covariate decelerates the time to an offering.
MEASURES OF STOCK MISPRICING
We use three variables to capture stock mispricing and investor sentiment about a stock.
BHAR is the buy-and-hold abnormal return calculated as the difference between the buy-and-hold returns on the stock and on the value-weighted CRSP market index measured over six months ending 30 days prior to the seasoned equity or debt issue. Internet Bubble is a dummy variable that equals one if the equity or debt issue occurs during the internet bubble period (1999–2000), and is zero otherwise. Investor “irrational exuberance” during the internet bubble period may have motivated companies to accelerate their equity issues. For subsequent seasoned equity and debt issues, we also calculate abnormal returns before the previous seasoned offering, Lag BHAR. Investors may be reluctant to purchase new securities of firms where high price run-up before the previous offering suggests the firm may had been timing the market, which can delay the new offering.
CONTROLS
We classify the control variables into six groups, measures of (1) information asymmetry and issuer quality, (2) stock liquidity, (3) leverage and return volatility, (4) cash holdings, (5) firm growth opportunities and investments, and (6) macroeconomic variables and other controls.
Information asymmetry and issuer quality
9
investors. Collins et al. (1987) and Lang and Lundholm (1993) show that firm size captures the quality of the firm’s information environment. Low quality information environment should imply high information asymmetry.7 Market capitalization is the product of the stock price and the number
of shares outstanding. An indicator variable for venture capital backed IPOs (VC-back) captures better quality issuers. Megginson and Weiss (1991) and Barry et al. (1990) find that IPOs backed by venture capitalists perform better after the issue compared to non-VC backed IPOs. They attribute this result to higher quality of VC-backed issuers. Seasoned equity issues may also serve as an exit route for VC firms (Metrick and Yasuda, 2011), which can shorten the time between equity offerings. We control for public vs. private placements of securities (Private Placement). Private placements allow managers to mitigate the negative consequences information asymmetry has on public equity issues (Chemmanur and Fulghieri, 1999), allowing firms to more quickly raise capital. Further, Gomes and Phillips (2012) find that the effect of asymmetric information on the choice of public vs. private issue is higher for equity than debt issues.
Stock liquidity
We expect durations between seasoned equity and debt issues to be shorter for more liquid stocks. This is because high stock liquidity should facilitate share placing with investors, in particular with institutional investors. Rubin (2007) and Bilinski et al. (2012) show that equity issues are more common among more liquid stocks and that equity issues attract new institutional investors. We use firm share turnover (TR), which is the ratio of the number of shares traded over the number of shares outstanding to captures the frequency of trading in a firm’s stock.8 Further, we use the
Hasbrouck’s (2009) Gibbs estimate of stock transactions costs, Gibbs transactions cost, to capture the
7 Consistent with this prediction, Bhushan (1989) show that larger firms have higher analyst following. Roulstone (2003)
argues that higher analyst coverage associates with lower information asymmetries.
8 Glosten and Milgrom (1985) show that higher turnover stocks have less information asymmetries. Thus, stock turnover
10
stock’s cost-per-trade.9 Hasbrouck’s (2009) horserace of four effective transaction cost measures
shows that Gibbs estimate of stock transactions costs clearly dominates other cost measures. Further, Goyenko et al. (2009) find that Gibbs estimate of stock transactions costs has the highest annual cross-sectional correlations with effective and realized spreads calculated from the TAQ data compared to other spread proxies.
Leverage and return volatility
Firms with above-target (below-target) leverage may decide to speed up equity (debt) issues to adjust their capital structure towards the target. To calculate deviations from target leverage, we use industry-adjusted firm leverage ratios (Leverage ind_adj). Specifically, Leverage ind_adj is the ratio of long term debt over total assets less the industry median leverage ratio. We use the return standard deviation measured over six months ending 30 days prior to an equity or a debt issue (VOL) to capture stock return volatility. Merton (1974) shows that high variation in stock returns reduces the market value of debt, which should discourage debt issues when volatility is high.
Cash holdings
High cash reserves should reduce firm propensity to quickly issue new securities as companies can cover their financing needs from internal sources. However, cash-rich firms may decide to issue debt to reduce agency costs as interest and principal payments act as a disciplining mechanism that can limit the overinvestment problem (Jensen, 1986). To capture the financing gap and agency costs, we use the industry-adjusted ratio of cash holdings to total assets (Cash ind_adj). Further, we control for the issue proceeds because larger offerings should take longer to prepare and may be more difficult to place with investors. Thus, durations between capital transactions should be longer for larger offerings. Specifically, Proceeds are total issue proceeds from the current equity or debt issue divided by firm total assets. We also include a control for proceeds from the past offering,
9 We obtain data on Gibbs estimate of stock transactions costs from Joel Hasbrouck’s website:
11
Lag Proceeds, as firms are unlikely to quickly return to the capital market following a large previous offering.
Firm growth opportunities and investments
Firms can issue new securities to finance profitable growth opportunities when internal funds are insufficient to cover the investment outlay (Carlson et al., 2006; Li et al., 2009). We use the market-to-book ratio (M/B) to measure growth opportunities, and the ratio of capital expenditures to firm total assets (INV) to measure firm’s investment intensity. High market-to-book ratio and high capital spending should associate with faster equity and debt issues from the previous offering.
Macroeconomic variables and other controls
Previous studies report that macroeconomic conditions affect equity and debt issues (Baker et al., 2003; Faulkender, 2005; Doukas et al., 2011). We use seven variables to control for macroeconomic conditions. Term spread is the term spread and is measured as the difference between the 10-year bond rate and the three-month Treasury bill rate. Higher term spread should increase the duration between the IPO and the subsequent debt issue and between consecutive debt issues.
Mkt_VOL is the market return volatility measured as the standard deviation of monthly returns on the CRSP VW index over the six months ending 30 days prior to an equity or a debt issue. We expect high market volatility to delay both equity and debt issues.
We control for crises periods over our sample period: (1) the oil crisis in 1979, (2) the Black Monday crash in October 1987, (3) the Asian financial crisis in 1997, (4) the stock market downturn in September 2001 following the terrorist attacks, and (5) the recent financial crisis. Specifically,
Oil_crisis is an indicator variable that takes a value of one for equity and debt issues made in 1979, and zero otherwise. Black Monday takes a value of one for equity and debt issues made for one month after the Black Monday crash on 19th October 1987, and zero otherwise. Asian Fin. crisis is an
12
period starting in July 1997, and zero otherwise. September_11 takes a value of one for equity and debt issues made in the one year period after the terrorist attack on 11th September 2001. Finally,
Fin.crisis takes a value of one if the firm issues seasoned debt or equity between 2007 and 2008, and zero otherwise. Investor pessimism during crises periods should reduce investor appetite for new debt and equity, which can delay these offerings. Our set of controls also includes industry dummies (Industry dummies) based on Kenneth French’s twelve industry definitions, and year dummies (Year dummies). The basic empirical specification of our duration model is:
0 1 2 3 4
5 6 7 8 9
10 11 12 13 14 15
( ) ( )exp ln
_
_ ln
j j
h t h t BHAR Internet Bubble MV VC back
Private Placement TR Gibbs transaction cost Leverage ind adj VOL
M
Cash ind adj Proceeds Lag Proceeds B INV Term spread
16 17 18 19
11 32
20 21 21 32
1 1
_ _ .
_ 11 . k k .
k k
Mkt VOL Oil crisis Black Monday Asian Fin crisis
September Fin crisis Industry dummies Year dummies
(3)
Market variables and macroeconomic variables are measured 30-days prior to the capital offering date. Accounting variables are measured at the fiscal year-end preceding the equity or debt issue. To avoid hindsight bias, we impose a minimum six-month gap between the fiscal year-end and the security issue date when collecting accounting information.
IV. DATA AND SAMPLE
13
include only the first issue. We also follow this approach if a firm issues equity more than once in a year.10 Market and accounting data are from CRSP and COMPUSTAT, respectively. The final
sample consists of 4,598 equity issues, of which 1,405 are first seasoned equity issues after the IPO, and 8,983 debt offerings, of which 1,598 are first debt issues.
Figure 1a shows the annual frequency of 1,405 first issues of equity and of 1,598 first debt issues. The annual number of debt issues closely mirrors that of equity issues. Both equity and debt issues increase in frequency from around five in 1975 to over 65 in 1983 and 1986, peaking at over 100 in the early 1990s. Issuing activity slows after the internet bubble and almost disappears in 2008 in the aftermath of the financial crisis. Figure 1b repeats the analysis for 3,193 seasoned equity issues and 7,385 seasoned debt offerings made after the first seasoned equity or debt issue after the IPO.11
The number of subsequent seasoned equity and debt issues increases from around 8–11 in 1975 to around 60 issues in 1984. Debt issue activity peaks over 1985–1986, reaching over 1,300 issues annually. This period coincides with the increase in high-yield bond issues (Kaplan and Stein, 1993; Asquith et al., 1989). Equity (debt) issue activity settles at around 78 (287) per year in the 1990s and at around 23 (68) in the 2000s.
[Insert Figure 1 around here]
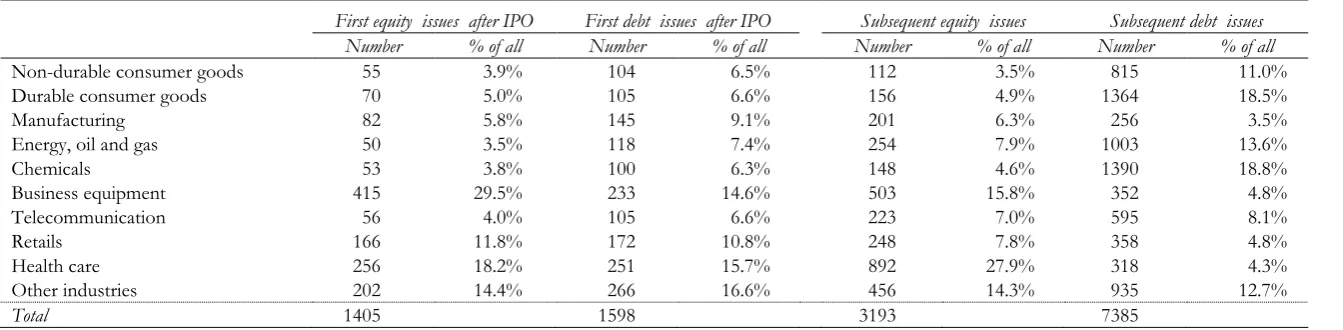
Table 1 shows the industry distribution of the first equity and debt issues after the IPO and of the subsequent seasoned equity and debt issues. Business equipment and health care have the largest proportions of both first equity issues (29.5% and 18.2%) and of first debt offerings (14.6% and 15.7%). Business equipment and health care also have the highest proportions of subsequent
10 Replicating the analysis using the last offering in a year or average values for all offerings in a year leaves our
inferences intact.
11 For ease of exposition, we use “subsequent seasoned equity issues” and “subsequent seasoned debt issues” in the
14
seasoned equity issues (15.8% and 27.9%). For subsequent seasoned debt offerings, chemicals and durable consumer goods have the most frequent debt issues (18.8% and 18.5%).
[Insert Table 1 around here]
V. EMPIRICAL RESULTS
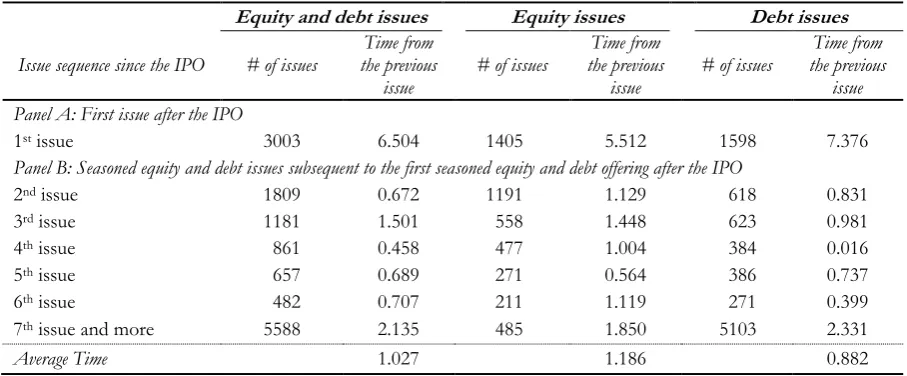
UNIVARIATE ANALYSIS OF DURATIONS BETWEEN EQUITY AND DEBT ISSUES We start the empirical analysis by examining the average time between equity and debt issues starting from the IPO date.12 Panel A of Table 2 shows the average time between the IPO and the
first equity or debt issue after the IPO. On average, firms issue a seasoned security 6.504 years after the IPO. Firms are faster in issuing seasoned equity than debt after the IPO. The average time between the IPO and a first seasoned equity issue is 5.512 years compared to 7.376 years between the IPO and a first seasoned debt issue. These findings are consistent with the evidence in Lemmon and Zender (2010), who propose that younger firms have more valuable growth opportunities, which they are able to exercise only by issuing the relatively more expensive equity. Also, our results are consistent with the findings in Helwege and Liang (1996), who report that the first offering after the IPO is an equity issue. They attribute this result to small and unpredictable cash flows of young firms in the early stages of growth, and greater information asymmetries of these firms due to shorter time-series of earnings information, which limits young firms’ ability to access the debt market.
[Insert Table 2 around here]
12 To calculate durations between equity and debt issues, each IPO firm between 1975 and 1999 is tracked for nine years,
15
Panel B of Table 2 reports the average time between subsequent seasoned equity and debt issues based on their sequence after the IPO. We make two observations. First, of the 3,193 subsequent seasoned equity issues in Panel B, only 15% of the firms issued equity seven times and more. The corresponding number for seasoned debt issues is 69%. This result suggests that frequent equity offerings (of seven times and more) are rare compared to frequent debt issues. Second, the average time to a subsequent seasoned equity issue is longer than the equivalent time to a subsequent seasoned debt issue (1.186 years vs. 10.6 months). This result is consistent with the prediction of the pecking order theory that on average, more established firms issue debt more frequently than equity. Together, Table 2 evidence helps explain the mixed evidence on the predictive power of the pecking order theory in explaining firm financing choices (Frank and Goyal, 2003; Fama and French, 2005). Specifically, our evidence suggests that the pecking order theory explains financing decision of mature firms, but not of young firms, which may face more difficult access to debt markets shortly after the IPO.
16
DESCRIPTIVE STATISTICS FOR THE EXPLANATORY VARIABLES
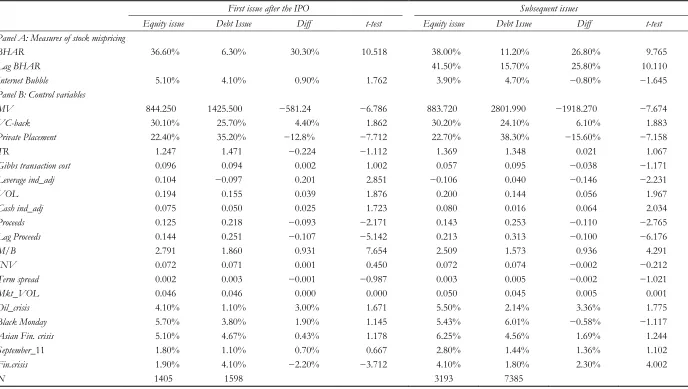
Panel A in Table 3 reports descriptive statistics for our measures of stock mispricing:
BHAR, Lag BHAR and Internet Bubble. We first discuss the results for the first equity and debt issues after the IPO. Mean abnormal return performance prior to the first seasoned equity issue is higher than prior to the first debt offering (36.6% vs. 6.3%), and during the internet bubble a slightly higher proportion of firms first issued equity than debt after the IPO (5.1% vs. 4.1%). These results suggest that stock overpricing is likely to have a stronger impact on equity than debt issues.
[Insert Table 3 around here]
17
more expensive equity. Capital spending is similar before both first debt and equity issues. There are no differences in the term spread and market volatility before the first equity and debt issue after the IPO. More firms issued equity than debt after the IPO during the oil crisis (4.10% vs. 1.10%), but during the recent financial crisis first debt issues were more frequent than first equity offerings after the IPO (4.10% vs. 1.90%).
Column Subsequent issues in Table 3 repeats descriptive statistics for equity and debt offerings made subsequent to the first seasoned offering after the IPO. The sign and significance of differences in firm characteristics for subsequent offerings are similar to those for the first offerings after the IPO. However, for subsequent seasoned offerings, there is no significant difference in the proportion of stocks that issued equity and debt during the internet bubble, and equity issues tend to follow more often when the firm’s leverage is below the industry average. Subsequent seasoned equity issue were on average more likely than debt offerings during the recent financial crisis period. Finally, we document that Lag BHAR is larger for equity than debt issues (41.5% vs. 15.7%), which suggests that seasoned equity offerings are more likely if the previous offering experienced larger pre-issue abnormal returns.13
DURATION ANALYSIS: THE FIRST SEASONED ISSUE AFTER THE IPO
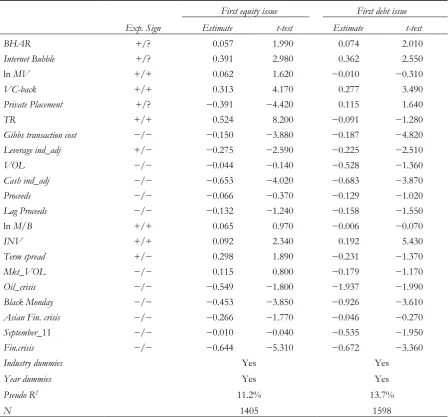
Table 4 presents results from model (3) predicting the time to the first equity and the first debt issue after the IPO. A strong price run-up before the issue shortens the duration between the IPO and the first seasoned equity (coeff. 0.057) and debt issue (coeff. 0.074). Further, we find that during the internet bubble period, companies exploited high investor sentiment and issued both
13 In unreported results, we calculate Pearson correlations between the variables in Table 3. The correlations are on
18
equity and debt quickly after the IPO (coeff. 0.391 and 0.362). Together, duration results confirm our prediction that stock overpricing speeds up external capital acquisitions after the IPO.
Looking at the control variables, we find that large firms with more liquid stocks and lower cost of stock trading are faster to issue equity after the IPO. This result is in line with the prediction that low information asymmetry and high stock liquidity facilitate equity placements with investors (Dittmar and Thakor, 2007; Rubin, 2007; Bilinski et al., 2012).14 Lower stock transaction costs also
facilitate debt placements with investors (coeff. −0.187). Firms backed by a venture capitalist are faster to issue both equity and debt after the IPO (coeff. 0.313 and 0.277), consistent with better quality issuers being able to quickly return to capital markets after the IPO.15 Public equity offerings
are quicker than private equity placements (coeff. −0.391). Above-target leverage delays both new equity and debt issues (coeff. −0.275 and −0.225). This result supports the prediction that firms are unlikely to quickly issue equity to adjust leverage downwards towards the target, but use debt offerings to adjust the leverage ratio upwards towards the target level.16 Low cash holdings and high
capital spending increase the speed of both equity and debt issues, consistent with cash-starved and investment-intensive companies relying more on external financing to cover their financing needs (Huang and Ritter, 2009). High term spread speeds up equity issues (coeff. 0.298), and firms are less likely on average to quickly issue both equity and debt during crisis periods. The latter evidence is consistent with the prediction that (1) low investor sentiment during crisis periods reduces investors’ willingness to participate in new seasoned offerings delaying firms’ ability to tap into capital markets (Korajczyk and Levy, 2003), and (2) that negative market shocks lower value of new investment
14 In untabulated results, we use Liu’s (2006) standardized turnover-adjusted number of zero-trading volume days over
the prior 12 months in place of stock turnover. The conclusions from using Liu’s (2006) measure are the same as from using stock turnover.
15 The need to quickly return to the capital market may also reflect the VC firms need to liquidate their investments
(Megginson and Weiss, 1991; Metrick and Yasuda, 2011).
16 The reluctance to use equity issues to quickly adjust the leverage downwards towards the target may reflect that equity
19
opportunities and of assets in place (Choe et al., 1994), which delays new offerings as companies wait for market conditions to improve.
Together, results in Table 4 confirm that security overpricing and high market sentiment speed up durations between the IPO date and the first seasoned equity and debt issue. This evidence suggests that the time to the first seasoned issue after the IPO can provide a valuable signal to investors on whether the issuer is likely to be timing the market.
DURATION ANALYSIS: SUBSEQUENT SEASONED OFFERINGS
This section presents hazard model results for equity and debt issues subsequent to the first seasoned offering after the IPO. Compared to Table 4, duration regressions now also control for abnormal returns before the previous seasoned equity or debt issue, Lag BHAR. This is because a firm may have to delay a debt or an equity issue if investors suspect the firm may have previously attempted to time the market. Further, we include in regressions controls for the type of security the firm issued previously. Specifically, Previous debt issue dummy (Previous equity issue dummy) equals one if the firm issues equity (debt) following a previous debt (equity) offering. We control for the type of security the firm issued previously, because companies may strategically interchange between equity and debt offerings to shorten the time between consecutive capital acquisitions. Finally, we include a control for the number of offerings a firm made since the IPO, #_offerings_since_IPO. Longer history of offerings could provide investors with additional information regarding issuer quality and the issue motive.17 The specification of the duration model for subsequent seasoned offerings is:
17 In untabulated results, we find that the sample means for Previous debt issue dummy and Previous debt issue dummy are 3.3%
20
0 1 2 3
4 5 6
7 8 9 10 11
( ) ( )exp
# ln
j j
h t h t BHAR Lag BHAR Internet Bubble
Previous debt issue dummy Previous equity issue dummy offerings since IPO
MV VC back Private Placement TR Gibbs transaction cost
12 13 14 15 16
17 18 19 20 21
22 23 24 25
25
_ _
ln _ _
. _ 11 .
k
Leverage ind adj VOL Cash ind adj Proceeds Lag Proceeds
M INV Term spread Mkt VOL Oil crisis
B
Black Monday Asian Fin crisis September Fin crisis
Industry du
11
32 361 1
.
k
k k
mmies Year dummies
(4)
Table 5 show results for model (4) that examines durations between subsequent seasoned issues. We continue to find that the recent stock price run-up shortens the time to both seasoned equity and debt issues (coeff. 0.125 and 0.163). This result suggests that more seasoned issuers also take advantage of “windows-of-opportunity” to speed up issues of both equity and debt. This evidence complements the results for the first seasoned offerings after the IPO in Table 4. The negative coefficients on Lag BHARs for both equity and debt issues (coeff. −0.018 and −0.076) suggest that companies that attempted to time offerings of overvalued securities in the past have to wait longer before they can return to capital markets to raise new financing. This evidence suggests that investors learn about quality of issuers over time and may be less willing to participate in offerings of firms that previously were likely to be timing the market. Finally, as in Table 4, we find that high investor sentiment during the internet bubble period prompted firms to quickly issue seasoned equity (coeff. 0.795).
[Insert Table 5 around here]
Looking at the control variables, we document that the coefficient on Previous debt issue dummy
21
financing is costly, frequent issues may reflect past attempts to time the market, which can discourage investors from participating in new offerings leading to longer gaps between capital acquisitions.
Similar to results in Table 4, high capital spending and stock liquidity, low cash reserves and VC-backing shorten the time to both subsequent seasoned debt and equity issues. Also, firms on average have to delay equity and debt issues during crisis periods. Contrary to results in Table 4, we find that smaller firms are quicker to issue both subsequent seasoned equity and debt (coeff. −0.138 and −0.333) compared to larger firms. This result may reflect that smaller firms suffer most from shortage of internal capital and need frequent access to capital markets to finance their investments. Further, the evidence that smaller firms issue debt more quickly may also reflect that, due to their riskiness, they can only issue short-maturity debt that requires frequent refinancing (Scherr and Hulburt, 2001). We find that both public offerings of equity and debt are quicker than private security placements (coeff. −0.182 and −0.909). Similar to results for the first equity issue after the IPO, firms are slow to adjust above-target leverage ratio by issuing equity (coeff. −0.251), but deviations from target leverage do not affect how quickly firms issue new debt. Together, this evidence suggests that for frequent issuers, equity and debt issues do not serve as a means to quickly adjust firm capital structure towards the target level. This result is consistent with the findings in Fama and French (2002) that firms take long to adjust their capital structure to the target level.
22
valuable growth options. Finally, contrary to results in Table 4, term spread does not explain the time between equity, but high market volatility accelerates equity issues (coeff. 0.417).
To sum up, the evidence in Tables 4 and 5 suggests that firms are quick to issue both seasoned equity and debt when the stock is likely to be overvalued. This means that investors should react more unfavorably to equity and debt issues that follow closely from the previous offering, as these issues are likely to be timing the market. We test this proposition in the next section.
VI. THE RELATION BETWEEN THE MARKET REACTION TO EQUITY AND
DEBT ISSUE ANNOUNCEMENTS AND DURATION BETWEEN OFFERINGS
In this section, we test the prediction that shorter durations between equity and debt offerings have a negative association with the price reaction to seasoned equity and debt issue announcements. We calculate daily abnormal returns around announcements of equity and debt issues as the difference in the return on stock i on day t (Rit) and the return on the value-weighted
market index (RMt), ARit Rit RMt. We cumulate abnormal returns for each stock over the
period starting two days before the issue announcement and ending two days after the announcement,
2
2
i it
t
CAR AR
. We use the SDC database to identify the equity and debt issueannouncement dates. If the announcement date is missing, we use the filing date.18 The five-day
window ensures that our results are less likely to be affected by data errors in announcement dates compared to using shorter windows.
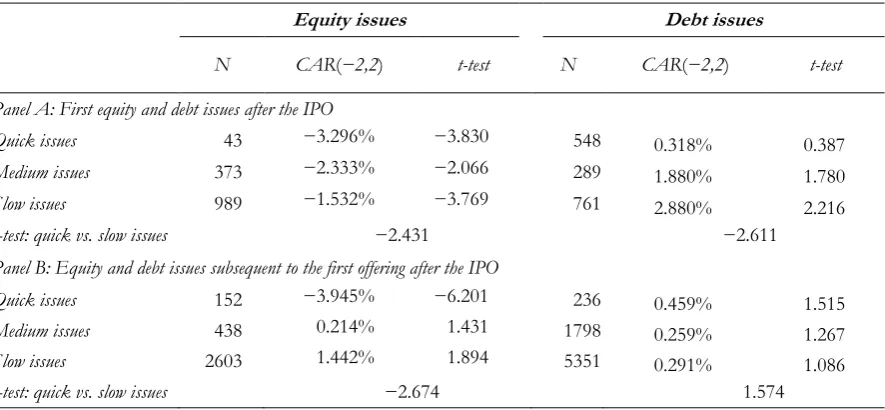
Table 6 reports average abnormal returns around announcements of equity and debt issues for offerings made within one year of the previous issue (Quick issues), offerings made between one and two years of the previous issue (Medium issues), and offerings made two years and longer from
18 Numerous empirical studies use the filing date as a proxy for the announcement date, e.g. Jegadeesh et al. (1993),
23
the previous issue (Slow issues). Panel A reports results for first equity and debt issues after the IPO. We observe an increasing trend in abnormal returns as we move from the portfolio of quick to slow equity issues. The mean abnormal price reaction to equity issue announcements is −3.296% for quick equity offerings, −2.333% for medium equity issues, and −1.532% for slow issues. The difference between the mean price reaction to quick vs. slow equity issues is significant at 1% level.
[Insert Table 6 around here]
For first debt issue announcements after the IPO, the pattern in price reactions is similar to that for first equity issues. CARs for quick issues are 0.318%, 1.880% for medium issues and 2.880% for slow issues. As before, the difference between the average price reaction to quick vs. slow debt issues is significant at 1% level. These results show more favorable reactions to slow as opposed to quick debt and equity issues after the IPO.
24
PRICE REACTIONS TO SEASONED EQUITY AND DEBT ISSUE ANNOUNCEMENTS: MULTIVARIATE ANALYSIS
Next, we examine if durations between equity and debt issues have an incremental information effect on stock prices controlling for other firm characteristics associated with the announcement date stock returns. Specifically, we regress abnormal price reactions to equity and debt issue announcements on an indicator variable for slow equity and debt issues (Slow issue dummy), which takes a value of one for offerings made two years or longer from the previous issue, and is zero otherwise. We expect to find a positive coefficient on the Slow issue dummy, consistent with the prediction that investors react more positively to equity and debt issues that do not follow quickly from the previous offering as these offerings are less likely to be timing the market.
25
which can reduce the information asymmetries between the firm and investors and consequently the negative price reaction to equity issue announcements (Zhang, 2006).19 The specification of our
price reaction regression model is:
0 1 2 3 4
5 6 7 8
9 10 11 12 13
1
ln(1 _ ) # ln
_
CAR Intercept Slow issue dummy BHAR Internet Bubble Hot
age ind adj offerings since IPO MV VC back
Private Placement TR Gibbs transaction cost Leverage ind adj VOL
4 15 16 17 18 19
20 21 22 23 24
11
25 25 36
1
_ ln
_ _ . _ 11
. k k
k
M
Cash ind adj Proceeds Lag Proceeds B INV Term spread
Mkt VOL Oil crisis Black Monday Asian Fin crisis September
Fin crisis Industry dummies Year dummi
32 1 k es (5)where CAR is the five-day abnormal return around the equity or debt issue announcement. We pool first equity and debt offerings after the IPO with subsequent offerings since the univariate results in Table 6 suggests that durations between seasoned offerings are important in explaining price reactions to both first and subsequent offerings.20
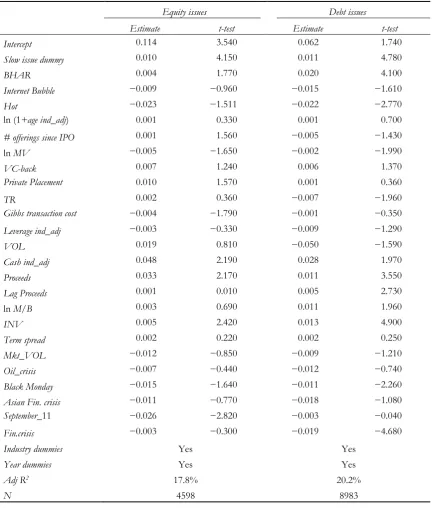
Table 7 shows regression results for the price reaction model (5). Consistent with the results in Table 6, we find highly significant positive coefficients on Slow issue dummy for both equity and debt issues (coeff. 0.010 and 0.011), which indicates that slow offerings elicit a more favorable price reaction at equity and debt issue announcements. This result confirms that in a multivariate setting, durations between seasoned issues contain incremental information on whether the issuer is likely to be timing the market.
[Insert Table 7 around here]
Looking at control variables, we find that abnormal returns before the offering correlate positively with the price reaction to equity and debt issue announcements (coeff. 0.004 and 0.020). This result is consistent with Asquith and Mullins (1986), Duca (2011), Doukas et al. (2011) and
19 In untabulated results, we find that the sample average for hot issue periods and for firm industry-adjusted age are
74.6% and 7.945, respectively.
20 Because we estimate model (5) for a pooled sample that includes first equity and debt issues, we exclude Lag BHAR
26
Dutordoir and Hodrick (2012), who find significant positive coefficients on pre-announcement abnormal stock returns when regressed on the price reaction to announcements of seasoned equity and debt issues.21 Price reactions to debt issue announcements are on average lower during hot issue
periods (coeff. −0.022). Hot issue periods include on average more over-priced debt offerings (Spiess and Affleck-Graves, 1999), which can explain average price mark-downs in these periods. Smaller firms have more positive price reactions at equity and debt issue announcements, which indicates that these firms rely more on external financing to cover their investment needs (Lemmon and Zender, 2010). There is a negative coefficient on Gibbs estimate of stock transaction costs for equity issues (coeff −0.004), which reflects that higher cost of stock trading increases the difficulty of placing shares with investors (Rubin, 2007; Bilinski et al., 2012). High stock turnover lowers price reactions to debt issue announcements, which likely reflects lower benefits of debt compared to equity financing when stock turnover is high. Cash-rich firms and larger offerings have more favorable price reactions at equity and debt issue announcements, which suggests that investors perceive these characteristics as signaling better firm prospects. In particular, larger offerings can associate with more information disclosure by the firm to facilitate the placement, which can temporarily reduce adverse selection costs.22 We find similar results for large past debt offerings
(coeff. 0.005). Consistent with results in Jung et al. (1996) and Walker and Yost (2008), investors react more favorably to equity and debt announcements by firms with intensive capital spending (coeff. 0.005 and 0.013), and debt issue announcements elicit higher price reactions for growth stocks (coeff. 0.011). Finally, price reactions to equity and debt issue announcements are on average
21 Dutordoir and Hodrick (2012) build on the adverse selection model in Lucas and McDonald (1990) and propose that
high abnormal returns before the issue announcement capture the extent profitable investment opportunities explain the offering decision. In particular, high price run-up can signal low adverse selection costs, leading to a more favorable reaction to the issue announcement.
22 In untabulated results, we include an industry-adjusted measure of the issue proceeds in model (5) in lieu of the
27
lower in crisis periods. This result is consistent with the predictions in Choe et al. (1993) that periods of economic turmoil associate with higher adverse selection costs and, consequently, more negative reactions to external financing announcements. Overall, the regression results for controls are consistent with past evidence.
To gauge the contribution of duration between equity and debt offerings at explaining the variation in the price reaction to equity and debt issue announcements, we re-estimate equation (5) without the Slow issue dummy. In unreported results, we find that the Slow issue dummy increases the adjusted R-squared in model (4) by 13.4% for equity issues (from 15.7% to 17.8%) and by 10.4% for debt issues (from 18.3% to 20.2%). This evidence suggests that durations between offerings have substantial economic power to explain price reactions to equity and debt offering announcements.
VII. CONCLUSIONS
This study examines whether stock overpricing affects durations between equity and debt offerings, and if durations between equity and debt issues impact the price reaction to equity and debt issue announcements. We show that firms with higher stock overpricing are more likely to quickly issue equity and debt following the previous capital acquisition. Investors understand firms’ incentive to quickly return to the capital market and react less favorably to equity and debt issues that follow shortly from the previous offering. Together, our evidence shows that durations between equity and debt issues signal the issue intent and that investors discount this information in the stock price at the equity and debt issue announcements.
28
durations between offerings when planning their external capital acquisitions— delaying offerings can lead to more favorable price reactions at issue announcements. Second, our evidence that stock mispricing shortens durations between offerings has important implications for fund managers and investors. Specifically, our findings suggest that investors should be cautious when participating in security offerings that follow closely from previous issues as these offerings are likely to be driven by temporary stock overpricing. Finally, our findings are important for regulators, such as the Securities and Exchange Commission, in that increasingly shorter durations between capital acquisitions can signal temporary market overpricing. Regulators could then introduce measures aimed at reducing market mispricing, for instance, by imposing a minimum duration between consecutive capital acquisitions.
29 VIII. REFERENCES
Asquith, P. and D. Mullins. 1986. “Equity issues and offering dilution.” Journal of Financial Economics
15: 61–89.
Asquith, P., D. Mullins, and E. Wolff. 1989. “Original issue high yield bonds: Aging analysis of defaults, exchanges, and calls.” Journal of Finance 44: 923–952.
Baker, M., J. Stein, and J. Wurgler. 2003. “When does the market matter? Stock prices and the investment of equity-dependent firms.” Quarterly Journal of Economics 118: 969–1006.
Baker, M. and J. Wurgler, 2002. “Market timing and capital structure.” Journal of Finance 57: 1–30. Barry, C., C. Muscarella, J. Peavy, and M. Vetsuypens. 1990. “The role of venture capitalists in the
creation of public companies: Evidence from the going public process.” Journal of Financial Economics 27: 447–471.
Bayless, M. and S. Chaplinsky. 1990. “Expectations of security type and the information content of debt and equity offers.” Journal of Financial Intermediation 1: 195–214.
Bhushan, R. 1989. “Firm characteristics and analyst following.” Journal of Accounting and Economics 11: 255–274.
Bilinski. P., N. Strong, and W. Liu. 2012. “Does liquidity risk explain low firm performance following seasoned equity offerings.” Journal of Banking and Finance 36: 2770–2785.
Bradshaw, M., S. Richardson, and R. Sloan. 2006. “The relation between corporate financing activities, analysts' forecasts and stock returns.” Journal of Accounting and Economics 42: 53–85. Carlson, M., A. Fisher, and R. Giammarino. 2006. “Corporate investment and asset price dynamics:
Implications for SEO event studies and long-run performance.” Journal of Finance 61: 1009– 1034.
30
Chemmanur, T. and P. Fulghieri. 1999. “A theory of going-public decision.” Review of Financial Studies
12: 249–279.
Choe, H., R. Masulis, and V. Nanda. 1993. “Common stock offerings across the business cycle: Theory and evidence.” Journal of Empirical Finance 1: 3–31.
Collins, D., S.P. Kothari, and J. Raybum. 1987. “Firm size and the information content of prices with respect to earnings.” Journal of Accounting and Economics 9: 111–138.
Cox, D. 1972. “Regression models and life tables.” Journal of the Royal Statistical Society 34: 187–220. Dann, L. and W. Mikkelson. 1984. “Convertible debt issuance, capital structure change and
financing-related information.” Journal of Financial Economics 13: 157-186.
Datta, S., M. Iskandar-Datta, and K. Raman. 2005. “Executive compensation structure and corporate equity financing decisions.” Journal of Business 78: 1859–1889.
DeAngelo, H., L. DeAngelo, and R. Stulz. 2010. “Seasoned equity offerings, market timing, and the corporate lifecycle.” Journal of Financial Economics 95: 275–295.
Denis, D. 1994. “Investment opportunities and the market reaction to equity offerings.” Journal of Financial and Quantitative Analysis 29: 159–177.
Dichev, I. and J. Piotroski. 1999. “The performance of long-run stock returns following issues of public and private debt.” Journal of Business, Finance and Accounting 26: 1103–1132.
Dittmar, A. and A. Thakor. 2007. “Why do firms issue equity?” The Journal of Finance 62: 1–54.
Doukas, J., J. Guo, and B. Zhou. 2011. “‘Hot’ debt markets and capital structure.” European Financial Management 17: 46–99.
Duca, E. 2011. “Seasoned Equity Offerings and the cost of market timing.” Unpublished paper, Colegio Universitario de Estudios Financieros.
31
Eckbo, E. and R. Masulis. 1992. “Adverse selection and the rights offer paradox.” Journal of Financial Economics 32: 293–322.
Elliott, W., J. Koeter-Kant, and R. Warr. 2008. “Market timing and the debt-equity choice.” Journal of Financial Intermediation 17: 175–197.
Espenlaub, S., A. Khurshed, and A. Mohamed. 2012. “IPO survival in a reputational market.” Journal of Business Accounting and Finance 39: 427–463.
Fama, E. and K. French. 2002. “Testing trade‐off and pecking order predictions about dividends and debt.” Review of Financial Studies 15: 1–33.
Fama, E. and K. French. 2005. “Financing decisions: Who issues stock?” Journal of Financial Economics
76: 549-582.
Faulkender, M. 2005. “Hedging or market timing? Selecting the interest rate exposure of corporate debt.” Journal of Finance 60: 931–962.
Frank, M. and V. Goyal. 2003. “Testing the pecking order theory of capital structure.” Journal of Financial Economics 67: 217–248.
Glosten, L. and P. Milgrom. 1985. “Bid, ask and transaction prices in a specialist market with heterogeneously informed traders.” Journal of Financial Economics 14: 71–100.
Gomes, A. and G. Phillips. 2012. “Why do public firms issue private and public securities?” Journal of Financial Intermediation 21: 619–658.
Goyenko, R., C. Holden, and C. Trzcinka. 2009. “Do liquidity measures measure liquidity?” Journal of Financial Economics 92: 153–181.
Graham, J. and H. Campbell. 2001. “The theory and practice of corporate finance: Evidence from the field.” Journal of Financial Economics 60: 186–243.
32
Helwege, J. and N. Liang. 1996. “Is there a pecking order? Evidence from a panel of IPO firms.”
Journal of Financial Economics 40: 429-458.
Hensler, D., R. Rutherford, and T. Springer. 1997. “The survival of Initial Public Offering in the aftermarket.” Journal of Financial Research 20: 93–110.
Heron, R. and E. Lie. 2004. “A Comparison of the motivations for and the information content of different types of equity offerings.” Journal of Business 77: 605–632.
Hovakimian, A. 2004. “The role of target leverage in security issues and repurchases choice.” Journal of Business 77: 1041–1072.
Hovakimian, A., T. Opler, and S. Titman. 2001. “The debt-equity choice.” Journal of Financial and Quantitative Analysis 36: 1–24.
Howton, S., S. Howton, and S. Perfect. 1998. “The market reaction to straight debt issues: the effects of free cash flow.” Journal of Financial Research 21: 219–228.
Huang, R. and J. Ritter. 2009. “Testing theories of capital structure and estimating the speed of adjustment.“ Journal of Financial and Quantitative Analysis 44: 237–271.
Jalilvand, A. and R. Harris. 1984. “Corporate behavior in adjusting to capital structure and dividend targets: An econometric study.” Journal of Finance 39:127–145.
Jegadeesh, N., M. Weinstein, and I. Welch. 1993. “An empirical investigation of IPO returns and subsequent equity offerings.” Journal of Financial Economics 34: 153–175.
Jensen, M. 1986. “Agency costs of free cash flow, corporate finance and takeovers.” American Economic Review 76: 323–339.
Jung, K., C. Kim, and R. Stulz. 1996. “Timing, investment opportunities, managerial discretion, and the security issue decision.” Journal of Financial Economics 42: 159–185.
Kaplan, S. and J. Stein. 1993. “The evolution of buyout pricing and financial structure in the 1980s.”
33
Korajczyk, R. and A. Levy. 2003. “Capital structure choice: Macroeconomic conditions and financial constraints.” Journal of Financial Economics 68: 75–109.
Korajczyk, R., D. Lucas, and R. McDonald. 1992. “Equity issues with time-varying asymmetric information.” Journal of Financial and Quantitative Analysis 27: 397–417.
Lang, M. and R. Lundholm. 1993. “Cross-sectional determinants of analyst ratings of corporate disclosures.” Journal of Accounting Research 31: 246–271.
Leary, M. and M. Roberts. 2005. “Do firms rebalance their capital structures?” Journal of Finance 60: 2575–2619.
Leary, M. and M. Roberts. 2010. “The pecking order, debt capacity, and information asymmetry.”
Journal of Financial Economics 95: 332–355.
Lemmon, M. and J. Zender. 2010. “Debt capacity and tests of capital structure theories.” Journal of Financial and QuantitativeAnalysis 45: 1161–1187.
Li, E., D. Livdan, and L. Zhang. 2009. “Anomalies.”, Review of Financial Studies 22: 4301–4334.
Liu, W. 2006. “A liquidity-augmented capital asset pricing model.” Journal of Financial Economics 82: 631–671.
Loughran, T. and J. Ritter. 1995. “The new issues puzzle.” Journal of Finance 50: 23–52.
Lucas, D.J. and R. L. McDonald. 1990. “Equity issues and stock price dynamics.” Journal of Finance
45: 1019–1043.
Marsh, P. 1982. “The choice between equity and debt: An empirical study.” Journal of Finance 37: 121–144.
Megginson, W. and K. Weiss. 1991. “Venture capitalist certification in initial public offerings.”
Journal of Finance 46: 879–903.
34
Metrick, A. and A. Yasuda. 2011. “Venture capital and other private equity: A survey.” European Financial Management 17: 619–654.
Myers, S. 1984. “The capital structure puzzle.” Journal of Finance 39: 575–592.
Myers, S. and N. Majluf. 1984. “Corporate financing and investment decisions when firms have information that investors do not have.” Journal of Financial Economics 13: 187–221.
Qian, H. 2005. “Timing of seasoned equity offerings: A duration analysis.” Unpublished paper, Oakland University.
Roulstone, D. 2003. “Analyst following and market liquidity.” Contemporary Accounting Research 20, 552–578.
Rubin, A. 2007. “Ownership level, ownership concentration and liquidity.” Journal of Financial Markets 10: 219–248.
Scherr, F. and H. Hulburt. 2001. “The debt maturity structure of small firms.” Financial Management
30: 85–111.
Shumway, T. 2001. “Forecasting bankruptcy more accurately: A simple hazard model.” Journal of Business 74: 101–124.
Spiess, K. and J. Affleck-Graves. 1999. “Underperformance in long-run stock returns following seasoned equity offerings.” Journal of Financial Economics 38: 243–268.
Walker, M. and K. Yost. 2008. “Seasoned equity offerings: What firms say, do, and how the market reacts.” Journal of Corporate Finance 14: 376–386.
35
[image:36.612.74.542.339.592.2]Figure 1a: The distribution of first seasoned equity and of first seasoned debt issues after the IPO.
Figure1b: The distribution of seasoned equity and debt issues subsequent to the first seasoned equity and debt offering after the IPO.
Figure 1: Sample distribution
36 Table 1: Industry distribution of seasoned debt and equity issues
First equity issues after IPO First debt issues after IPO Subsequent equity issues Subsequent debt issues Number % of all Number % of all Number % of all Number % of all
Non-durable consumer goods 55 3.9% 104 6.5% 112 3.5% 815 11.0%
Durable consumer goods 70 5.0% 105 6.6% 156 4.9% 1364 18.5%
Manufacturing 82 5.8% 145 9.1% 201 6.3% 256 3.5%
Energy, oil and gas 50 3.5% 118 7.4% 254 7.9% 1003 13.6%
Chemicals 53 3.8% 100 6.3% 148 4.6% 1390 18.8%
Business equipment 415 29.5% 233 14.6% 503 15.8% 352 4.8%
Telecommunication 56 4.0% 105 6.6% 223 7.0% 595 8.1%
Retails 166 11.8% 172 10.8% 248 7.8% 358 4.8%
Health care 256 18.2% 251 15.7% 892 27.9% 318 4.3%
Other industries 202 14.4% 266 16.6% 456 14.3% 935 12.7%
Total 1405 1598 3193 7385 The table shows industry distribution of seasoned equity and debt issues. First equity issues after IPO shows the number of first seasoned equity issues after the IPO. First debt issues after IPO shows the number of first seasoned debt issues after the IPO. Subsequent equity issues shows the number of seasoned equity issues subsequent to the first seasoned offering after the IPO. Subsequent debt issues shows the number of seasoned debt issues subsequent to the first seasoned offering after the IPO. Column
37 Table 2: Durations between equity and debt issues
Equity and debt issues Equity issues Debt issues
Issue sequence since the IPO # of issues the previous Time from
issue # of issues
Time from the previous
issue # of issues
Time from the previous
issue Panel A: First issue after the IPO
1st issue 3003 6.504 1405 5.512 1598 7.376
Panel B: Seasoned equity and debt issues subsequent to the first seasoned equity and debt offering after the IPO
2nd issue 1809 0.672 1191 1.129 618 0.831
3rd issue 1181 1.501 558 1.448 623 0.981
4th issue 861 0.458 477 1.004 384 0.016
5th issue 657 0.689 271 0.564 386 0.737
6th issue 482 0.707 211 1.119 271 0.399
7th issue and more 5588 2.135 485 1.850 5103 2.331
Average Time 1.027 1.186 0.882 Panel A shows the time (in years) to the first seasoned equity and to the first seasoned debt issue after the IPO. Panel B shows the time between seasoned issues subsequent to the first offering after the IPO. Equity and debt issuesshows results for the pooled sample. Equity issues shows results for equity issues, and column Debt issues
38 Table 3: Descriptive statistics for the explanatory variables
First issue after the IPO Subsequent issues
Equity issue Debt Issue Diff t-test Equity issue Debt Issue Diff t-test Panel A: Measures of stock mispricing
BHAR 36.60% 6.30% 30.30% 10.518 38.00% 11.20% 26.80% 9.765
Lag BHAR 41.50% 15.70% 25.80% 10.110
Internet Bubble 5.10% 4.10% 0.90% 1.762 3.90% 4.70% −0.80% −1.645
Panel B: Control variables
MV 844.250 1425.500 −581.24 −6.786 883.720 2801.990 −1918.270 −7.674
VC-back 30.10% 25.70% 4.40% 1.862 30.20% 24.10% 6.10% 1.883
Private Placement 22.40% 35.20% −12.8% −7.712 22.70% 38.30% −15.60% −7.158
TR 1.247 1.471 −0.224 −1.112 1.369 1.348 0.021 1.067
Gibbs transaction cost 0.096 0.094 0.002 1.002 0.057 0.095 −0.038 −1.171
Leverage ind_adj 0.104 −0.097 0.201 2.851 −0.106 0.040 −0.146 −2.231
VOL 0.194 0.155 0.039 1.876 0.200 0.144 0.056 1.967
Cash ind_adj 0.075 0.050 0.025 1.723 0.080 0.016 0.064 2.034
Proceeds 0.125 0.218 −0.093 −2.171 0.143 0.253 −0.110 −2.765
Lag Proceeds 0.144 0.251 −0.107 −5.142 0.213 0.313 −0.100 −6.176
M/B 2.791 1.860 0.931 7.654 2.509 1.573 0.936 4.291
INV 0.072 0.071 0.001 0.450 0.072 0.074 −0.002 −0.212
Term spread 0.002 0.003 −0.001 −0.987 0.003 0.005 −0.002 −1.021
Mkt_VOL 0.046 0.046 0.000 0.000 0.050 0.045 0.005 0.001
Oil_crisis 4.10% 1.10% 3.00% 1.671 5.50% 2.14% 3.36% 1.775
Black Monday 5.70% 3.80% 1.90% 1.145 5.43% 6.01% −0.58% −1.117
Asian Fin. crisis 5.10% 4.67% 0.43% 1.178 6.25% 4.56% 1.69% 1.244
September_11 1.80% 1.10% 0.70% 0.667 2.80% 1.44% 1.36% 1.102
Fin.crisis 1.90% 4.10% −2.20% −3.712 4.10% 1.80% 2.30% 4.002