T E C H N I C A L A R T I C L E
Hot Forging of IN718 with Solution-Treated and Delta-Containing
Initial Microstructures
H. M. Lalvani1•J. W. Brooks2
Received: 25 February 2016 / Revised: 17 May 2016 / Accepted: 20 July 2016
ÓThe Author(s) 2016. This article is published with open access at Springerlink.com
Abstract A systematic study of the effect of d phase precipitate morphology on the hot deformation behavior and microstructural evolution in nickel superalloy Inconel 718 is presented. Isothermal compression tests at fixed nominal strain rates and temperatures relevant to industrial forging (0.001–0.3 s-1 and 990–1040°C) were used. Three distinct initial microstructures have been examined: (I) solution treated, (II) a microstructure with finely dis-persed particulatedprecipitates, and (III) a microstructure containing dense network of intragranular and grain boundarydplatelets. The peak flow stress associated with these various microstructures has been rationalized using a single, temperature-compensated power law. This clearly demonstrates opposition of the external applied stress by an internal back stress related to the initiald phase morphol-ogy and apparent delta solvus temperature. Post-peak flow softening is attributed to dynamic recrystallization, aided by the dissolution of finer precipitates in material con-taining particulate d phase, and to a certain degree of mechanical grain refinement caused by distortion and off-setting of grain segments where a densed-platelet structure exists.
Keywords Bulk deformationDelta phaseNickel-based superalloysThermomechanical processing
Recrystallization
Introduction
IN718, a nickel-based superalloy, is widely used in aero-engine applications due to its strength and stable mi-crostructure at elevated temperatures. These high-temper-ature properties of IN718 are attributed to slow growth kinetics of c00 precipitates and make IN718 a prime can-didate for forged turbine disks.
Significant research has been directed toward charac-terizing the precipitation and dissolution kinetics of the d phase in IN718 during heat treatment and aging, e.g., [1–5], and several experimental investigations have explored recrystallization associated with high-temperature com-pressive flow in solution-treated material, e.g., [6–10], but there has been rather less focus on the specific role of d precipitates during hot deformation. However, it is known that prior aging in thedstability field can have a significant effect on stress–strain response [11,12] and recent studies have highlighted the complexity of the mechanisms involved, including dynamic dissolution and reprecipita-tion [13], sub-grain formation [14], and platelet spheroidization [15].
A key concern in the manufacture of critical components is how the variability in initial and evolving microstructure might be reasonably characterized and quantified for incorporation into process models of high-temperature forging operations. A systematic study of the flow behavior and microstructural evolution in IN718 obtained during small-scale compression experiments using three distinct microstructures has been presented in this paper. A brief synopsis of flow stress and microstructure comparison between a solution-treated and acicular d-containing microstructure has been published by authors [16]. How-ever, the current paper provides an in-depth analysis of the role of thedphase in influencing dynamic recrystallization
& H. M. Lalvani
1 Advanced Forming Research Centre, University of Strathclyde, Glasgow PA4 9LJ, UK
and flow softening in IN718. Furthermore, a constitutive law has been formulated in terms of an internal back stress that takes into account the initialdphase morphology and distribution.
Material and Experimental Methodology
The material used in the present work was supplied as standard billet of 178 mm diameter that had undergone a typical annealing and aging cycle. It was heat-treated at 980°C for 1 h and water-quenched followed by an aging treatment at 720°C for 8 h. The billet was then furnace-cooled to 620°C, aged for a further 8 h, and finally air-cooled. The chemical composition (in weight %) of the billet contains 50.50 Ni, 19.10 Cr, 18.78 Fe, 5.28 Nb, 4.15 Mo, 1.06 Ti, 0.613 Al, 0.130 Co, 0.115 W, 0.039 V, and 0.033 C. Microstructure analysis of the billet material revealed a c-matrix grain size of 40–60lm and densely distributedd precipitates with varying morphology across the billet diameter: predominantly fine, blockyd particles near the outer billet diameter, becoming increasingly aci-cular toward the billet center. Since the precipitation and dissolution kinetics of the d phase have a complex dependence on the time, temperature, phase morphology, and local Nb concentration [2], a single value for the solvus temperature is difficult to determine [4]. The equilibrium delta solvus calculated using thermodynamic software JMatPro was 1033°C. However, in order to plan a testing program, an approximate ‘apparent’d solvus temperature, derived using material containing plate-like d from the center of the billet, was found to be 1020°C, determined by carrying out 30-min heat treatments at appropriate temperature intervals.
The hot deformation of IN718 with three distinct initial microstructures (will be referred to as Type I, Type II, and Type III throughout the text) has been examined. The Type I was produced by solution-treating samples of the as-re-ceived material at 1030°C for 30 min, followed by water-quenching, to create a material largely free ofdprecipitates without promoting significant grain growth (see Fig.1a, d). The Type II was obtained directly from the outer radius of the as-received billet, an area within 40 mm from the outer edge of a 178-mm-diameter billet. The Type II microstructure contained a fine dispersion of blocky intergranulard precipitates along with thin and aciculard precipitates at grain boundaries (see Fig.1b, e). The Type III was obtained from the mid-radius and the center of the billet, a central diameter area of 100 mm from a 178-mm-diameter billet. The Type III microstructure was dominated by a dense network of long aciculardwithin the grains ofc matrix and relatively short-length aciculardprecipitates at grain boundaries (see Fig.1c, f). The SEM micrographs of
the Type I, II, and III microstructures (see Fig.1d–f) were taken in secondary electron imaging (SEI) mode to capture topographical contrast between the delta phase and the gamma matrix. The measured average grain size for the Type I, II, and III microstructures were 52 ±29, 59±35, and 46±29lm, respectively. The measured volume fraction of delta precipitates for the Type II and the Type III microstructures was 27±0.8 and 22±3.5 %, respectively. At least 5 or more SEI micrographs were used for each of the Type II and the Type III cases to calculate volume fraction of delta using image analysis software for color thresholding the delta precipitates based on their contrast difference with the matrix. The solution-treated microstructure was found to be nominally delta-free with less than 0.5 % delta particles sparsely distributed in the microstructure as remainder phase from the solution treatment.
Uniaxial compression tests were carried out at isother-mal temperatures on cylindrical specimens of 10 mm diameter and 15 mm height. The specimen temperature was carefully controlled using an R-type thermocouple placed directly in contact with the cylindrical specimen at mid-height level. The specimens were coated with Acheson Deltaglaze FB-412 lubricant to prevent surface oxidation, and the platens were coated with boron nitride to provide necessary lubrication during deformation. Heating rate of 1 °C per second to the test temperature was incorporated with a dwell time of 30 min prior to deformation. Tests were carried out at 10°C intervals between 990 and 1030°C, using constant true strain rates of 0.003 s-1, 0.03 s-1, and 0.3 s-1. Temperature was maintained to be within ±3°C of the nominal test temperature throughout the specimen for the duration of each test. Strain mea-surements, deduced from the displacement of the machine crosshead, were adjusted to take account of load train compliance; the maximum true average strain imposed on each specimen was *0.9. The measured flow stress was corrected for interfacial friction, using Cockroft ring ref-erence specimens [17], and for deformation heating by adjusting for the temperature increase due to the energy of plastic work and frictional heating [18]. Specimens were water-quenched within 3–5 s of the end of deformation.
Fig. 1 a,b,cOptical micrographs for the Type I, II, and III microstructures;d,e,fSEM images for the Type I, II, and III microstructures, respectively
Table 1 Shape coefficients for macroscopic deformation behavior of the test specimens [19]
Shape coefficients Definition
Ovality coefficient (O)
Ratio of the maximum diameter (dfmax) to minimum diameter (dfmin) of the deformed test piece
Height coefficient (H)
Ratio of the standard deviation (S) of four height measurements of the deformed test piece (hf) to the average height (hf) of the deformed test piece
Barreling coefficient (B)
[image:3.595.47.545.594.687.2]intercept method according to ASTM standard E112 [20]. The recrystallized volume fraction analysis was performed using ImageJ software. The un-recrystallized grains within the microstructure were very evident to select, and their grain boundaries were traced to produce a binary image of the un-recrystallized grains (black) in a white matrix pro-duced by color-thresholding selected areas function in ImageJ. The area fraction of un-recrystallized grains was then calculated from the binary image, and finally the recrystallized fraction was deduced from this information. These measurements were taken along the specimen axis, at a distanceh/3 from one end of the specimen, wherehis the deformed specimen height, assumed to be representa-tive of the bulk strain [21].
Results and Discussion
Deformation Behavior
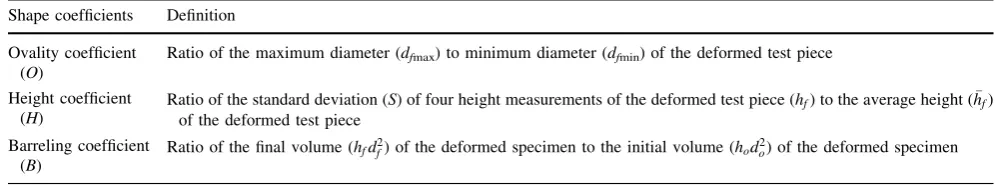
Representative flow curves for all three types of initial microstructure at temperatures of 990 and 1030°C, below and above the d solvus temperature of 1020°C, respec-tively, are shown in Fig.2a, b. The overall behavior is in broad agreement with that usually observed for IN718: A distinct peak stress, tending to be more pronounced at higher strain rates, is followed by significant post-peak flow softening that is generally attributed to recrystalliza-tion and/or adiabatic heating [6–10]. Since all the flow curves presented here have been corrected for the effect of deformation heating, the observed flow softening must, in this case, be due to the evolving microstructural state of the material.
At the sub-solvus temperature, 990°C, Fig.2a indicates that thed-containing microstructures (Type II and Type III) sustain greater peak stresses and undergo more significant flow softening than the solution-treatedd-free microstruc-ture (Type I). It also appears that the flow stress at each strain rate evolves toward the same approximate
[image:4.595.276.545.66.626.2]‘steady-state’ value—this is most clearly demonstrated at the lowest strain rate, 0.003 s-1. Yuan and Liu [11] concluded that significant amounts of acicular d acts to lower the Table 2 Various shape
coefficients calculated for the range of test conditions for validity of compression tests
Tests 990°C—0.3 s-1 990°C—0.001 s-1 1040°C—0.3 s-1 1040°C—0.001 s-1
hf df hf df hf df hf df
Max 6.73 16.20 5.80 17.10 6.58 16.13 5.916 17.15 Min 6.64 15.12 5.86 16.70 6.42 15.75 5.93 16.38 6.64 15.43 6.12 16.88 6.53 16.09 6.07 16.81 6.67 15.83 5.79 16.8 6.48 15.94 5.89 16.89 Mean 6.67 15.64 5.89 16.87 6.50 15.97 5.95 16.80
S 0.042 0.154 0.068 0.080
B 1.089 1.089 1.106 1.120
H 0.006 0.026 0.010 0.013
O 1.071 1.023 1.024 1.047
steady-state stress in IN718 under similar conditions, although they also observed a slight reduction in peak stress over d-free material. For the supersolvus tempera-ture, 1030°C, Fig.2b shows that the flow behavior is practically identical for all of the materials tested, which implies dissolution of the preexistingdphase in the Type II and the Type III.
The flow behavior across the full range of test conditions can be analyzed using a conventional power-law equation to express the constitutive relationship between strain rate,
_
e, stress,r, and temperature,T:
_
e¼Arnexp Q
RT
ð1Þ
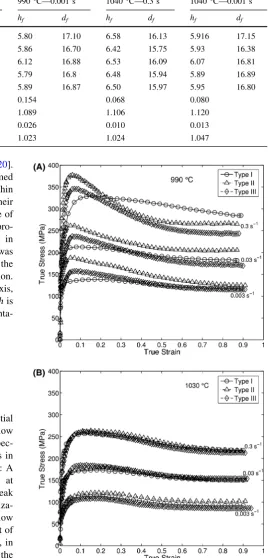
where material parameter,A, stress exponent,n, and acti-vation energy,Q, are treated as constants to be determined by experiment. Figure3a shows optimized global fits of Eq.1 to the experimental data using peak stress, rp, and Fig.3b shows the same for nominal steady-state stress,rss, in the form of log (stress) versus inverse temperature plots. In each figure, the solid lines represent an optimized fit at all temperatures and strain rates for the solution-treated, d-free material; the dashed lines represent fitting at sub-sol-vus temperatures for the d-containing materials. The analysis confirms that peak flow stresses are higher for material containing d phase with the Type II, finely dis-persed microstructure supporting greater peak stresses than the Type III, platelet-dominated microstructure across all strain rates and sub-solvus temperatures examined (see Fig.3a). The data for steady-state stress (see Fig.3b) are rather more scattered at sub-solvus temperatures, but seem to confirm that the initial microstructure has less influence on the flow stress at large strains.
The optimized values for material constantsA,Q, andn, obtained during global fitting of Eq.1using both peak and steady-state stresses, are presented in Table3. An activa-tion energy of 430 kJ mol-1for hot-working of solution-treated IN718 (Type I microstructure) is in good agreement with values derived for the same material in the literature, 390–440 kJ mol-1[8–11]. Higher values ofQfor the Type II and Type III materials, as listed in Table2, can be attributed to the presence of d precipitates; second-phase particles are known to affect the measured hot-working activation energy in steels [22] and two-phase titanium alloys [23].
One way to rationalize the influence of precipitates on overall deformation is to consider the internal stresses that may arise from their presence. The flow curves in Fig.2a, b demonstrate that IN718 deformed at high temperature ini-tially exhibits work-hardening. During the initial stages of deformation, dislocation density increases rapidly and a dislocation cell substructure may form, tending to impede further dislocation motion and leading to hardening. The
[image:5.595.307.541.53.462.2]same effect can also be imposed by solute drag effects in solid solutions and by any precipitates present in the microstructure. This kind of internal resistance to the Fig. 3 a Peak stress and b steady-state stress analyzed using conventional stress power law, Eq.1, and plotted against inverse temperature.Solid linesrepresent fitting at all temperatures for Type I;dashed linesrepresent fitting at sub-solvus temperatures only for Type II and Type III
Table 3 Optimized values for material constants obtained during global fitting of Eq.1to experimental data
Material A(MPa-ns-1) Q(kJ mol-1) Stress exponentn
Type I rp 2.459103 430 5.51
rss 2.239104 432 5.30 Type II rp 8.9491019 916 6.76
rss 1.419104 482 6.23 Type II rp 7.729109 587 5.44
[image:5.595.306.545.564.662.2]deformation can be characterized by a ‘back stress’ that acts to oppose the external applied stress. The back stress associated with the Type I solution-treated microstructure will arise predominantly from solute drag effects and substructure formation during deformation. In the case of the d-containing microstructures, Types II and III, an additional back stress will be exerted by the precipitates. Following widely used practice in damage mechanics [24], a back stress,rb, can be incorporated into the power-law constitutive equation as follows:
_
e¼AðrrbÞnexp
Q
RT
ð2Þ
The magnitude ofrbis likely to depend on the precip-itate size, morphology, and distribution. However, for simplicity, it can be assumed that a particular d microstructure is associated with a characteristic back stress that varies with the temperature-dependentd phase volume fraction. In fact, thedcontent of IN718 decreases approximately linearly as the apparent solvus temperature is approached [2,4] and sorbcan be taken to be propor-tional to the difference between thed solvus temperature, Tsolv, and the deformation temperature,T:
rb¼K Tð solvTÞ T\Tsolv
rb¼0 TTsolv
ð3Þ
where K is a scaling constant that represents the initial microstructural state of the material.
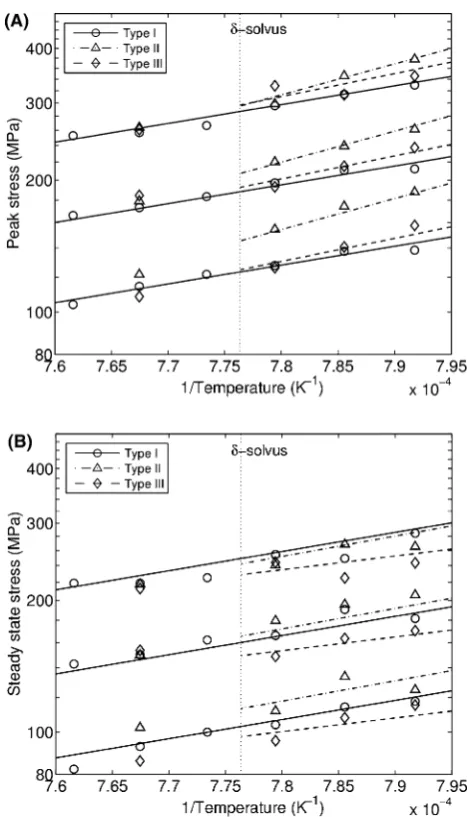
The peak flow stress data for the precipitate-containing microstructures have been reanalyzed using Eqs. (2) and (3). Values forA, Q, and n were taken to be those deter-mined previously for the d-free, Type I microstructure (Table2). The scaling constant, K, and apparent solvus temperature, Tsolv, were determined for the Type II and Type III microstructures using nonlinear optimization to minimize the sum of least square differences between the experimental data and model predictions. Global fits of Eqs. (2) and (3) to the peak stress data are presented in Fig.4, and the optimized constants are presented in Table4 along with magnitude of the predicted back stresses at 990°C. The optimized solvus temperature for the Type III microstructure, 1014°C, is in good accor-dance with that which was estimated for the same material using incremental heat treatment (1020°C). This is not surprising since the heat treatment was carried out at fixed temperatures over the same duration, *30 min, as the pretest soak was used to ensure thermal equilibrium in the compression stack. The maximum test duration,*6 min at 0.003 s-1, was relatively short in comparison. The much higher apparent d solvus temperature for the Type II microstructure, 1033°C, probably reflects the denser nat-ure of the precipitation distribution—see Fig.1b. The predicted internal back stresses (for example at 990°C,
Table3) for thed-containing materials are consistent with the differences in peak stress displayed by the flow curves in Fig. 2a.
Overall, the peak flow stress for IN718 with various initial microstructures is well fitted using a constitutive equation in which applied stress is effectively reduced by an internal back stress due to the presence of d phase precipitates. This approach has the advantage of utilizing realistic single values of stress exponent,n, and activation energy, Q, that are consistent with those expected for a deforming c-nickel matrix. The magnitude of the back stress is sensitive to the nature and distribution of the d phase and to the apparent d-solvus temperature, but pro-vides a straightforward means of incorporating microstructural differences into high-temperature process-ing models.
Microstructure Evolution
The compression tests carried out at 990°C with strain rates of 0.003 and 0.3 s-1, reported in Fig.2a, were Fig. 4 Peak flow stress analyzed using back stress-modified power law, Eq.2.Solid linesrepresent fitting at all temperatures for Type I;
[image:6.595.307.542.54.256.2]dashed linesrepresent fitting at sub-solvus temperatures only for Type II and Type III
Table 4 Optimized values for material constants obtained during global fitting of peak stresses using Eqs.2and3
Material K Tsolv(°C) rb(MPa) at 990°C
Type I – – –
Type II 1.083 1033 54.0 Type III 0.645 1014 15.0
[image:6.595.306.545.350.411.2]supplemented by further tests terminated at lower final strains. Post-deformation microstructure examination was carried out in order to identify the relative influences ofd phase dissolution and recrystallization on the observed flow softening.
The volume fraction of recrystallizedc-matrix grains as a function of true strain is presented in graphical form as shown in Fig.5a, b for the three microstructures deformed at 990°C with 0.3 s-1(Fig.5a) and 0.003 s-1(Fig.5b). The error bars in Fig.5a, b indicate the standard deviation of the average taken from four optical micrographs for each specimen. The data are somewhat scattered, but indicate that the volume fraction recrystallized at large strains for the Type I microstructure is greater than that for the Types
[image:7.595.53.286.262.688.2]II and III. This is as expected due to the absence of second-phase particles linked to hindering of recrystallization [25]. The Type I, solution-treated material indicated pro-gressive recrystallization by ‘necklacing’ of original grains. At higher strain rates, the grain boundaries of recrystal-lizing grains tended to have a smooth appearance (e.g., 0.3 s-1, 990°C—see Fig.6a), while at low strain rates, they were more serrated (e.g., 0.003 s-1, 990°C—see Fig.6b). This observation has been reported elsewhere [7,10] for IN718 under similar deformation conditions, and the serration of grain boundaries is a general indication of recrystallization occurring dynamically, during the defor-mation [25, 26]. Dynamic recrystallization requires an incubation period, whereas post-deformation meta-dy-namic recrystallization can occur spontaneously under favorable high-temperature conditions [25]. Given the short duration of the high rate tests (*3 s at 0.3 s-1), comparable to the posttest quench delay (*4 s), it is likely that a significant proportion of the recrystallization observed in the microstructures for these rapid tests had occurred meta-dynamically. An estimate of this can be
[image:7.595.310.544.342.687.2]Fig. 5 aRecrystallized volume fraction measurements at 990°C and 0.3 s-1andbat 0.003 s-1
made by adding the quench delay to the time for each test and fitting an Avrami equation to describe the evolution of recrystallized volume fraction, Vf, with total time, t. Applying this approach, it was found that Vf ¼ 1expð5:3104t4Þ provided a reasonable fit to the Type I data in Fig.5a; back-extrapolation of this equation was then used to determine the recrystallized fraction without the quench delay, as annotated explicitly in Fig.5a. The same analysis was found to have a negligible effect on the data at 0.003 s-1, further indicating that recrystallization is predominantly dynamic at the lower strain rate.
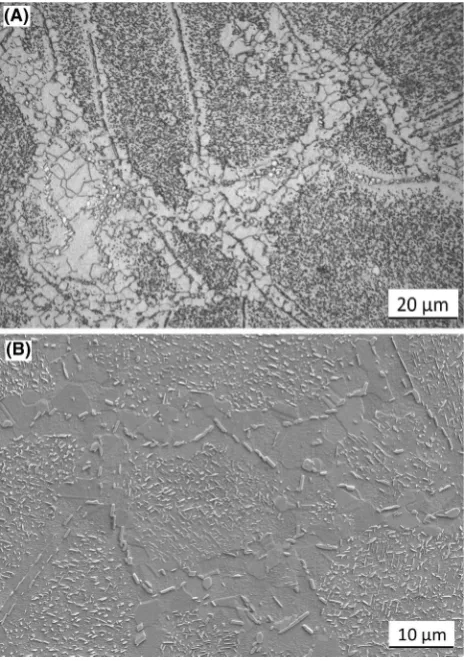
The Type II microstructure comprised a dispersion of fine intragranular d phase particles along with larger, elongateddprecipitates at grain boundaries and a relatively d-free zone adjacent to the boundaries (see Fig.1b, e). The recrystallization behavior of the Type II involved neck-lacing of prior grains by small recrystallized grains, although this was inhibited to some extent by the presence of the precipitates, see Fig.7. Here recrystallization appears to occur first in the denuded areas adjacent to grain boundaries and then extends into intragranular regions,
creating larger areas with sparsely distributed coarser d precipitates, as shown in Fig.7.
Typical microstructure evolution in the Type III is illustrated in Fig.8for the deformation case of 990 °C and 0.3 s-1. Deformation initially causes bending, kinking, and offsetting of thedplatelets at a lower true strain of 0.4 (see Fig.8a), the latter apparently due to intragranular slip. At a higher true strain, the offsetting leads to partial disinte-gration and rotation of grain segments, refining the overall structure, and is accompanied by a tendency for the pla-telets to realign perpendicular to the loading axis, see Fig.8b. Superimposed on this mechanical grain refine-ment, significant recrystallization also occurs, again asso-ciated with partial dissolution of the d phase during deformation. Although only faintly visible in Fig. 8b, widespread conventional recrystallization has taken place—for example where the d phase is sparsely dis-tributed in the lower left-hand quadrant of the micrograph. In summary, flow softening for the Type I, d-free microstructure is associated with dynamically occurring recrystallization. The decrease in flow stress occurs at strains above *0.15 for this material (see Fig.2a, b) and
Fig. 7 Recrystallization and dissolution of thed phase in Type II material at 990°C, 0.003 s-1, e=0.4, a optical micrograph and
bSEM image
[image:8.595.310.544.343.688.2] [image:8.595.54.288.347.678.2]reflects a corresponding onset of increase in recrystallized volume fraction (see Fig.5a, b). In the case of the d-con-taining microstructures, Type II and III, post-peak flow softening is much more marked and commences at lower strains, below 0.1, with most of the decrease in flow stress having occurred by a strain of*0.4 (see Fig.2a). At these low strains, the increase in recrystallized volume fraction is relatively small (see Fig.5a, b). Instead, for the Type II material containing the blocky particulate d, initial flow softening is associated with dissolution of thedphase (see Fig.7)—which again reduces the internal back stress—and which is superseded by dynamic recrystallization. In the case of the Type III microstructure containing plateletd, the low-strain flow softening is accompanied by bending, kinking, and offsetting of the platelets (see Fig.8a) fol-lowed at larger strains by apparent mechanical rotation and refinement of grain segments coupled with conventional recrystallization (see Fig.8b).
Conclusions
The present work on hot deformation study of IN718 with three distinct microstructures led to following conclusions; 1. The sub-solvus flow stress comparison between the three microstructures reveals maximum peak stress exhibited by the Type II microstructure. The Type III microstructure exhibited maximum flow softening of all the three microstructures.
2. The initial grain size of the three different microstruc-tures was closely comparable. Therefore, the marked variation in the overall shape of the flow stress curves and the differences in peak stress magnitudes, for the sub-solvus deformation cases, are majorly attributed to presence of the delta phase (Type II—27 %, Type III—22 %, and Type I—nominally delta-free) and morphology variation of the delta phase in the three microstructures as alluded.
3. Peak flow stresses are well characterized using a single, temperature-compensated, power-law relation-ship between strain rate and a reduced ‘effective’ stress; deformation is compatible with a deforming c-matrix (n =5.5, Q=430 kJ mol-1) in which the external applied stress is opposed by an internal back stress due to the presence of d phase particles. The magnitude of the back stress depends on the d morphology and distribution and is linked to the apparentd-solvus temperature.
4. Flow softening during deformation of material with a solution-treated (nominallyd-free) starting microstruc-ture is associated with dynamic recrystallization.
5. Material with an initial microstructure dominated by a particulate dispersion of intragranulardphase, Type II, displays flow softening apparently due to dissolution of the d particles at low strains, succeeded by dynamic recrystallization at higher strains.
6. Material with an initial microstructure dominated by a dense network ofdplatelets, Type III, undergoes flow softening associated with distortion and offsetting of the platelets at low strains, followed by a combination of mechanical grain refinement and conventional recrystallization at higher strains.
Acknowledgement
Authors are thankful to Rolls-Royce Plc, Derby, UK, for providing IN718 material for this project. Authors are indebted to Late Dr. Martin Rist (December 2012) for his contributions in supervising the Ph.D. project leading to development of the present paper.
Open Access This article is distributed under the terms of the Creative Commons Attribution 4.0 International License (http://crea tivecommons.org/licenses/by/4.0/), which permits unrestricted use, distribution, and reproduction in any medium, provided you give appropriate credit to the original author(s) and the source, provide a link to the Creative Commons license, and indicate if changes were made.
References
1. J.F. Radavich, The physical metallurgy of cast and wrought alloy 718, in Superalloy 718—Metallurgy and Applications, ed. by E.A. Loria (TMS, 1989), pp. 229–240
2. Y. Desvalle´es, M. Bouzidi, F. Bois, N. Beaude, Delta phase in INCONEL 718: Mechanical properties and forging process requirements, inSuperalloys 718, 625 and Various Derivatives, ed. by E.A. Loria (TMS, 1991), pp. 281–291
3. M. Sundararaman, P. Mukhopadhyay, S. Banerjee, Precipitation of the delta-Ni3Nb phase in 2 nickel-base superalloys. Metall. Trans. A19(3), 453–465 (1988)
4. S. Azadian, L.Y. Wei, R. Warren, Delta phase precipitation in Inconel 718. Mater. Charact.53(1), 7–16 (2004)
5. V. Beaubois, J. Huez, S. Coste, O. Brucelle, J. Lacaze, Short term precipitation kinetics of delta phase in strain free Inconel 718 alloy. Mater. Sci. Technol.20(8), 1019–1026 (2004)
6. J.M. Zhang, Z.Y. Gao, J.Y. Zhuang, Z.Y. Zhong, Mathematical modeling of the hot deformation behavior of superalloy IN718. Metall. Mater. Trans. A30, 2701–2712 (1999)
7. A.A. Guimares, J.J. Jonas, Recrystallization and aging effects associated with the high temperature deformation of Waspaloy and Inconel 718. Metall. Trans. A12, 1655–1666 (1981) 8. A.J. Brand, K. Karhausen, R. Kopp, Microstructural simulation of
nickel base alloy Inconel 718 in production of turbine discs. Mater. Sci. Technol. Lond.12, 963–969 (1996)
10. S.C. Medeiros, Y.V.R.K. Prasad, W.G. Frazier, R. Srinivasan, Microstructural modeling of metadynamic recrystallization in hot working of IN 718 superalloy. Mater. Sci. Eng. A293, 198–207 (2000)
11. H. Yuan, W.C. Liu, Effect of the delta phase on the hot defor-mation behavior of Inconel 718. Mat. Sci. Eng. A Struct.
408(1–2), 281–289 (2005)
12. A. Thomas, M. El-Wahabi, J.M. Cabrera, J.M. Prado, High temperature deformation of Inconel 718. J. Mater. Process. Technol.177(1–3), 469–472 (2006)
13. Y. Huang, T.G. Langdon, The evolution of delta-phase in a superplastic Inconel 718 alloy. J. Mater. Sci. 42(2), 421–427 (2007)
14. Y. Wang, L. Zhen, W.Z. Shao, L. Yang, X.M. Zhang, Hot working characteristics and dynamic recrystallization of delta-processed superalloy 718. J. Alloy. Compd. 474(1–2), 341–346 (2009)
15. H.Y. Zhang, S.H. Zhang, M. Cheng, Z.X. Li, Deformation characteristics of delta phase in the delta-processed Inconel 718 alloy. Mater. Charact.61(1), 49–53 (2010)
16. H.M. Lalvani, M.A. Rist, J.W. Brooks, Effect of delta phase on the hot deformation behaviour and microstructural evolution of Inconel 718. Adv. Mater. Res. 89–91, 313–318 (2010). www. scientific.net/AMR.89-91.313
17. A.T. Male, M.G. Cockcroft, Method for determination of coef-ficient of friction of metals under conditions of bulk plastic deformation. J I Met93(2), 38–46 (1964)
18. T. Alton, S.I. Oh, H. Gegel,Metal Forming: Fundamentals and Applications(American Society for Metals, Metals Park, 2000), pp. 81–84
19. B. Roebuck, J.D. Lord, M. Brooks, M.S. Loveday, C.M. Sellars, R.W. Evans, Measurement of flow stress in hot axisymmetric compression tests. Mater. High Temp.23(2), 59–83 (2006) 20. ASTM Standard E112-96:Standard test methods for determining
average grain size(ASTM International, 2004)
21. R.W. Evans, P.J. Scharning, Strain inhomogeneity in hot axisymmetric compression test. Mater. Sci. Technol. Lond.
18(11), 1389–1398 (2002)
22. H.J. McQueen, N.D. Ryan, Constitutive analysis in hot working. Mater. Sci. Eng. A322, 43–63 (2002)
23. L. Briottet, J.J. Jonas, F. Montheillet, A mechanical interpretation of the activation energy of high temperature deformation in two phase materials. Acta Mater.44, 1665–1672 (1996)
24. R.N. Ghosh, M. McLean, High-temperature deformation in engineering alloys—modeling for strain or load control. Acta Metall. Mater.40, 3075–3083 (1992)
25. F.J. Humphreys, M. Hatherly, Recrystallization and Related Annealing Phenomena (Pergamon Press, New York, 1995), pp. 461–464