City, University of London Institutional Repository
Citation
:
Erkoyuncu, J. A., Khan, S., Hussain, S. M. F. and Roy, R. ORCID:
0000-0001-5491-7437 (2016). A framework to estimate the cost of No-Fault Found events. International
Journal of Production Economics, 173, pp. 207-222. doi: 10.1016/j.ijpe.2015.12.013
This is the published version of the paper.
This version of the publication may differ from the final published
version.
Permanent repository link: http://openaccess.city.ac.uk/22201/
Link to published version
:
http://dx.doi.org/10.1016/j.ijpe.2015.12.013
Copyright and reuse:
City Research Online aims to make research
outputs of City, University of London available to a wider audience.
Copyright and Moral Rights remain with the author(s) and/or copyright
holders. URLs from City Research Online may be freely distributed and
linked to.
A framework to estimate the cost of No-Fault Found events
John Ahmet Erkoyuncu
a,n, Samir Khan
b, Syed Mohammed Fazal Hussain
c, Rajkumar Roy
aa
The EPSRC Centre for Innovative Manufacturing in Through-life Engineering Services, Manufacturing Department, Cranfield University, Bedfordshire MK43 0AL, UK
bSchool of Mechanical, Automotive and Aerospace Engineering, Coventry University, England CV1 5FB, UK c
Hindustan Aeronautics Limited, Accessories Division, B-06, HAL Township, Lucknow 226016, India
a r t i c l e i n f o
Article history:
Received 28 May 2015 Accepted 19 December 2015 Available online 29 December 2015
Keywords:
No Fault Found Cost driver selection Agent based modelling Cost analysis Supply chain
a b s t r a c t
The article investigates a generic framework to estimate maintenance costs attributed to the No Fault Found (NFF) phenomenon. Such overhead costs are particularly difficult to quantify due to potentially serviceable equipment being returned for repair. Other factors, such as a reduction in the availability of the system, compromising reliability of high value assets, and logistical factors, can all contribute to the cost of resolving an unknown fault. Here we apply the soft systems methodology to capture the critical cost drivers of NFF across the supply chain and build a framework to estimate the cost of NFF. We use a multi-method design including an online survey, workshops and semi-structured interviews to study NFF related cost practices based on information from 12 key participants across 7 UK organisations. The study identifies the major NFF cost drivers across the supply chain (e.g. transportation), the OEM (e.g. inventory) and the customer (e.g. lost man hours). An agent based model is used to evaluate the impact of these cost drivers on the overall NFF cost. The analysis shows how the most appropriate drivers can be selected to represent the cumulative costs due to NFF events and their impacts across the supply net-work. From the academic perspective, the generic framework for NFF cost estimation demonstrates how qualitative and quantitative information can be used together to achieve maintenance objectives. From a practical perspective, by applying the framework on one component, an organisation has the liberty to analyse the cost of NFF for that particular unit only.
&2016 The Authors. Published by Elsevier B.V. This is an open access article under the CC BY license (http://creativecommons.org/licenses/by/4.0/).
1. Introduction
System interruptions occur in different forms. Gradual degra-dation, given the time taken to source and fit a new electronic component, is rather trivial. However, a component breaking during operation is more alarming, as it impedes the ability of the system to perform its function until the component is replaced. Another form of interruption (in the same category) is that of reported faults where the root-cause of the problem cannot be diagnosed. In these situations, a suspected component is swapped, only for it to be found that the fault has not gone away. Further-more, when the removed component makes its way through the supply chain to the supplier to be tested (for functionality), it is found to be functioning as expected. This phenomenon has been given the name“No Fault Found (NFF)”and is the subject of this research paper. Due to complex interactions between various stakeholders, it becomes troublesome not only to diagnose such problems, but also to put a cost on the process to resolve them.
Some authors argue that preventive maintenance plans might be inaccurate when used in practice, as it is difficult to assess the precise impact of any inaccuracies; but it is likely that they will lead to further unnecessary costs. Braaksma et al. (2013) had showed that companies have a tendency to widen their safety margins and apply extra maintenance in case of inaccuracies or uncertainties in their analyses (Braaksma et al., 2013). Therefore, the consequences of any uncertainties (such as NFF events) are operationally and economically detrimental – with incorrect diagnoses, repairs penalise organisations in terms of lost labour hour costs, waste of maintenance costs, machine downtime and unavailability of aircraft/equipment. This further damages repu-tation and business relations within the supply chain. In fact,Khan (2015)advocates that for an equipment having an in service life of around 20 years, the operating and service/maintenance activities accounts for about 60–80% of the total whole life cycle cost of the equipment (Khan, 2015).
The cost suffered from NFF, until recently, been part of‘the cost of doing business’(Knotts, 1999). But, with organisations now striving to operate much more efficiently, this NFF overhead can no longer be accommodated and hence the ingredients of the problem have to be examined.Pecht (2012)highlights the significant economic impact of Contents lists available atScienceDirect
journal homepage:www.elsevier.com/locate/ijpe
Int. J. Production Economics
http://dx.doi.org/10.1016/j.ijpe.2015.12.013
0925-5273/&2016 The Authors. Published by Elsevier B.V. This is an open access article under the CC BY license (http://creativecommons.org/licenses/by/4.0/).
nCorresponding author.
failures on the computer industry and its customers and proposes the implementation of prognostics and health management to improve the costs.
An overview of the costs incurred on businesses from NFF events have been attributed to the following:
1. Operations and maintenance: lost man hours, direct main-tenance cost, warranty cover, production cost, machine una-vailability, intangible costs (loss of future business).
2. Stakeholder:intangible costs (reputation), warranty cover, cost of in-tolerance failures, system operation training and safety. 3. Original Equipment Manufacturer: capital expenditure,
inven-tory maintenance, obsolescence cost and repair cost.
4. Supply chain: intangible cost (loss in productivity), packaging and handling costs, machine downtime and transportation cost.
Even though this list is an attempt to be inclusive; with diverse business models and sectors, other sources may well emerge. Direct maintenance costs of components and man power are easily quantified, but there are other major impacts upon overall busi-ness costs (often hidden) that are not easily understood–such as customer perception (Cockram and Huby, 2009). These also include costs within the supply chain, maintenance performance, and wasted maintenance efforts.
1.1. Contributions and importance of this work
In this paper, a NFF cost estimation framework is developed to support decision makers for managing their supply chains, with an NFF overhead. The NFF research has been conducted as part of the the Engineering and Physical Sciences Research Council (EPSRC) Centre for Innovative Manufacturing – Through-life Engineering Services. The core members of the Centre include Ministry of Defence, BAE Systems, Bombardier Transportation and Rolls Royce and Babcock International. The aim of the research is twofold: (1) determining the costs breakdown of NFF problems, (2) devel-oping a dynamic simulation to estimate NFF costs over time and across the supply chain. In this paper a framework to estimate NFF costs has been developed. A framework is a basic structure that underlines a system concept. In order to initiate the framework a dynamic model has been developed. This represents the behaviour of NFF over time; it is defined by a set of states that contain probabilistic properties. Its contributions can be summarised as follows:
This is thefirst paper to identify suitable simulation involving an agent based approach to NFF cost estimation. This is thefirst paper to identify the list of NFF cost drivers and to offer a process to categorise and prioritise them. Development of a framework, which can be used as a decision support to estimate NFF costs. The approach taken for the verification and validation of the framework and dynamic model to determine its applicability.The proposed study has its merits. It addresses a critical need by presenting an agent-based framework for NFF cost analysis (where software agents exhibit collaboration, intelligence, mobi-lity) and hence is ideal for modelling and analysis of supply chain costs. The solution can also emulate the costs at different levels of granularity i.e. cross industry, and within organisations. But more importantly, the paper has managerial implications:
For system manufacturers it offers an opportunity to develop contracts to the system integrators that take in to account the NFF costs. For system integrators it provides an approach to estimate the cost of NFF so that bid proposals with higher confidence can be put forward to the system operators. For system operators a systematic process is offered to estimate NFF costs across the supply chain.1.2. Organisation of the paper
The paper is structured as follows:Section 2discusses the lit-erature review on the NFF phenomena and its associated costs. The methodology, adopted by the authors, to carry out this research work is detailed in Section 3. This is followed by an overview of the participating industry responses and practices on dealing with NFF issues within their organisations inSection 4. Sections5and6present a framework that can be used to estimate the costs attributed to NFF events with the help of an agent based model, followed by its validation and discussion. Finally,Section 7
highlights the conclusions and the future work from the research.
2. Literature review
2.1. The NFF phenomena
Within the aerospace sector, research on NFF events has gained renewed interest in the past decade (Khan et al., 2014). They have reported the major share of NFF failures, primarily within aircraft avionics, which indicates the correlation between increasing electronic components within modern systems and the NFF rate. This also demonstrates how an inconsequential event can build up into a strategic concern for organisations within their competitive environment.
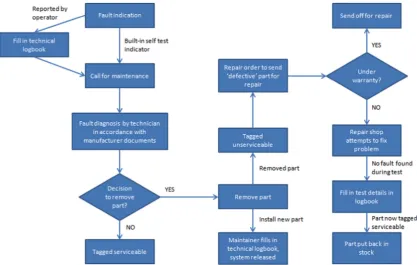
A typical maintenance activity is described in Fig. 1. When faults occur, maintenance personnel are called tofind them. Pro-cedurally, they rely on fault isolation manuals or manufacturer documents. If a component is not removed, then it is tagged ser-viceable. On the other hand, if the maintenance removes a com-ponent, it is sent to depth maintenance for further testing. At depth, if no fault is discovered, concerns are raised on why a ser-viceable component was removed from service. It is tagged as an NFF. NFF is therefore described as the output of a diagnostic pro-cess where“the root case of a reported fault cannot be verified”. It has a negative impact on the business (as it is an overhead) and hence its effects must be minimised to maximise profits.
Khan et al. (2014)have also classified NFF into four categories: 1. Fault diagnostics – includes research into sensors, testing, troubleshooting, fault isolation manuals, built-in-tests and environmental testing.
2. System design – includes hardware and software design, operational feedback, key performance indicators, benchmark-ing and cost trade-off studies.
3. Human factors–includes communication, training and educa-tion, correct equipment usage, warranty claims and accountability.
4. Data management - includes data trending, e-logs and data fusion/mining.
These categories, elaborated inFig. 2, provide an overview of the key industrial themes in NFF realised through an international NFF symposium in 2013.
manufacturers and their suppliers. Based on the work carried out in this research, the influence of NFF–on the maintenance plan-ning and system availability – is evident to maintenance agers. This is because they are responsible for spares and man-power provisioning. However, it seems that it is not so evident to the maintenance engineers who are just doing the routine repair work, or to the level above the maintenance managers, as the metrics to measure such problems are not in place. This is further
compounded due to availability contracts not acknowledging NFF issues, let alone defining who will be liable for its costs. Since effective maintenance management is paramount in the resolution and reduction of such events, contractual obligations must be recognised as a vital phase in the need to improve supporting actions and budgeting for NFF reduction.
[image:4.595.94.512.56.321.2]It is important to note that the management of failures (during maintenance) is driven by their consequences. These include the Fig. 1. Typical maintenance activity (Khan et al., 2014).
Fault Diagnostics
Trouble-shooting Sensors
Fault Isolation Manuals Replication of
Environment and Usage
Calibration of BIT
System Design
Operational Feedback
KPIs and benchmarking Diagnostics
as Part of Design
Costs Processes/
Procedures /Human
Factors
Supply Chain
Correct use of Equipment Accountability
Systems fit for Purpose
Communication
Training/ Education
Data Management
Data Trending
E-logs Global field
experiments
Data Fusion
[image:4.595.143.464.355.630.2]NFF Themes
failure impact on safety and its impact on operational availability (Hockley and Lacey, 2015). Both are important; the impact on safety receives most attention and is influenced by regulating authorities. The impact on availability receives attention; as delays and cancellations cost money and reputation and ultimately affects shareholders and profits. Many aircraft maintainers accept high NFF rates if their delays and cancellations are minimised; ensuring reputation and revenue is paramount (Khan et al., 2015). Others may hide the issue, or are having NFF issues without actually realising the cost to their business. However, there are many causes of NFF that have a lot of similarity between the human factors that cause maintenance errors and those that cause (or contribute) the problem. The link between NFF and aircraft safety is, however, yet to be fully understood and is part of ongoing research.1
Furthermore in cost related NFF literature, Williams et al. (1998)claimed that NFF events can make up more than 85% of all observed field failures within avionics components. They also account for more than 90% of all maintenance costs, which can be attributed to the following:
1. A limited understanding of root cause failure characteristics of a complex system,
2. Inappropriate means of diagnosing the condition of the system, and
3. The inability to duplicate thefield conditions in the laboratory.
Within industry, customers often fall into two categories, those that maintain their own system (e.g. a fleet of aircraft, ships or other vehicles) and those who sub-contract their systems (e.g.
fleet maintenance) either completely or partially (Baines et al., 2007). NFF events inflict a burden on both of their maintenance operations, leading to financial implications due to increased downtime of the equipment and additional supply chain costs. There is also a reduction in the overall operational availability depending on the reliability, maintenance and logistical efforts, all of which contribute to the cost of resolving a NFF reported event. The costs are often quantified by measuring the proportion of the repair budget that is spent (or wasted) on maintenance activities involved in locating the root cause of the NFF event. Without high levels of confidence that a reported fault is notfixed correctly the
first time, along with a high probability of reoccurrence, there will be a measurable impact on the business output.
Wu (2011)identified that design and fault diagnosis are the key factors that influence such costs, whilst discussing a maintenance free operating period, and a fault diagnosis expert system for improvements. However, a large proportion of cost spent on NFF events can be attributed to warranty claims (Wu, 2014; Pecht, 2006;Hughes and Kornowa-Weichel, 2004). A six sigma metho-dology, driven by customer satisfaction and the reduction of the warranty cost was proposed byJin et al. (2011). The study aimed to expand the Six Sigma tools in applications, where products are designed and developed under the fast time-to-market require-ment. Depending on how the maintenance contract is setup, claims can be made to include human factors or intermittent failures (which constitutes quite a large proportion of the entire claim population). Some figures published by the Air Transport Association (ATA) in 1997 estimated annual NFF costs for an airline operating 200 aircraft at $20M, or $100,000 per aircraft per year. It is likely that a similarfigure is true for today’s airline industry even though such afigure is not currently available. Other studies show
that some 4500 NFF events were costing ATA member airlines $100M annually (Beniaminy and Joseph, 2002). Recent efforts within the United States Air Force to mitigate NFF focused on tackling individual avionics equipment, such as the Modular Lower Power Radio Frequency unit for the F-16. It was found that in excess of $2M in maintenance costs were being incurred annually for just this one unit at the maintenance depots. The Boeing 787 Dreamliner had recently raised safety issues after overheating batteries caughtfire while the aircraft was parked at Boston Logan International Airport. Investigations indicated a number of potential causes and faulty components for thefire, with each case ending in a NFF. There was a direct knock-on effect on businesses as many airlines had to ground their aircraft due to safety con-cerns. Analysts forecasted that while these aircraft were out of service it cost Boeing an estimated $393M, while also impacting upon their production line and future deliveries. This issue prob-ably cost hundreds of millions of dollars on its own, as airlines are likely to seekfinancial compensation for their delays and loss of service. Such high costs provide the incentive to tackle the NFF problem, but the underlying reasons must be understood and separately resolved in each organisation (Denning, 2013; Khan et al., 2014).
A non-exhaustive list of the main NFF drivers according to (Williams et al., 1998;Thomas et al., 2002;Khan et al., 2014) can be summarised as follows:
inadequate training, incomplete fault isolation and troubleshooting manuals, inadequate environmental stimulus during troubleshooting andbench testing,
intermittent faults in electronic equipment, software immaturity, non-existent NFF management policies, and barriers due to organisational culture.The above list indicates a lack of awareness to the problem and hence a lack of appropriate benchmarking tools to evaluate its consequential impact on the business.Thomas et al. (2002) high-lighted the costs suffered by vehicle manufacturers in a case study for a Ford electronic ignition unit, where the inability to verify a unit’s continuous NFF issues led to legal action against the com-pany resulting in a mandatory recall of the vehiclesfitted with the electronic ignition. Information regarding financial costs of NFF within many industries in particular the aerospace industry, is difficult to obtain with limited formation in the public domain. Some reasons for this which are evident:
1. Sensitivity of the information: organisations are reluctant to risk commercial data falling in to the hands of a competitor and within the aerospace industry there has always been a culture of secrecy surrounding maintenance activities.
2. Industries just do not know exactly how much NFF is costing: one aspect of this is that the complexity of the NFF issue results in difficulties in assigning an accurate financial figure within reasonable uncertainty levels.
3. In the current economic climate, many business departments are afraid to ‘admit their shortcomings’ and justifying the budget being spent on unknown faults.
Although, the warranty costs within the automotive industry has been realized as the most significant overhead, globally, the automotive sector spends only 1–3% of its product revenue on warranty. Warranty expenses associated with recalls are approxi-mately $12.3 billion annually exceeding the manufacturers' yearly profits (Tian, 2007). This adds up to a vehicle’s life-cycle cost, and more importantly, indicates the proven potential of failure with a 1
part which may reduce customer satisfaction to damage vehicles' brand image (Jones and Hayes, 2001). This means that there is no complete, robust and reliable cost model currently available for measuring and calculating thefinancial impact of NFF. Therefore, one of the novelties presented in this paper makes use of an agent based model to help with this analysis.
2.2. Cost modelling
The literature on‘cost modelling’has mainly focused on man-ufacturing physical products, whereas costing of services has received much less attention. NFF is an increasingly costly area in maintenance delivery and requires adequate approaches to esti-mate an NFF budget. This is especially the case where the service content is not viewed merely as an add-on feature to the product sale and is considered as an integrated solution. A minimum cost
flow model for“level of repair analysis”was discussed byBasten et al. (2011). For each component in the product, they determined whether it should be discarded (or be repaired upon failure) and at which location in the repair network to perform the maintenance activity. The focus of the costs varies between the delivery of products and services. For instance, the product development process encompasses several areas, including marketing, con-ceptual design, detailed design, process selection and cost esti-mation (Datta and Roy, 2010). Uncertainty also has a major role in managing the cost of NFF. This involves the level of certainty in the prediction of the outcomes. The source of uncertainty could be due to ambiguity, which is driven by knowledge or environmental variability (Erkoyuncu et al., 2011). The specific NFF costs will be further discussed inSection 5.4of this article.
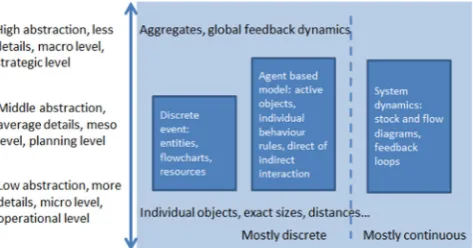
Anecdotal evidence suggests that NFF experienced in main-tenance cost is traditionally considered in a static manner where the system operates in a certain fixed time instant (e.g. Monte Carlo simulation). On the other hand, stochastic time based models use random variables to reproduce the possible occurrence of events that are unknown a priori. In this process, probability distributions are used to represent stochastic phenomena experi-enced randomly over time. Stochastic techniques have commonly been applied to represent dynamic behaviour in systems, espe-cially to monitor the supply chain (Forrester, 2003). Three simu-lation approaches are typically applied: discrete event simusimu-lation (DES), system dynamics (SD) and agent based modelling (ABM), as represented inFig. 3.
These approaches are applied at different levels including strategic, operational and planning (Erkoyuncu, 2011). In litera-ture, SD and ABM have been used equally to address strategic and planning problems. On the other hand, DES has heavily focused on planning problems, while it has also been used for the operational context (Chin-Yuan Fan and Fan, 2010).
ABM adopts a bottom-up approach that aims to build from the local-behaviour to capture the total system level outcomes. The
growing interest in ABM is associated to a number of reasons, including growth in complexity across activities, which is driven by the increased interdependencies. Although, this is not a new challenge, traditional approaches in some cases have built in potentially unrealistic assumptions for modelling purposes. ABM offers to model more fluid-turbulent conditions through agents that have decision making capability that are notfixed or given, but susceptible to changes that can adapt their behaviour (Nilsson and Darley, 2006). Although, there are a number of potential benefits to be realised from the approach, its application in NFF cost estimation has been limited. Therefore, the authors of this paper demonstrate that the application of ABM would be suitable to study NFF cost estimations, whilst yielding useful information regarding the outcomes of interactions across various main-tenance scenarios.
There are additional reasons for the growth of ABM such as ability to simulate increased amount of data at lower levels of granularity and the increase in computational power, which enables to conduct more detailed analysis. The key difference of ABM from other simulation approaches was highlighted in (Nilsson and Darley, 2006) as:
“... it is theflexibility and high-level nature of these interactions (cooperation, coordination, negotiation) which distinguishes multi-agent systems from other forms of software and which provides the underlying power of the paradigm”
The novelty of this paper is associated to breaking down the costs of NFF and building a dynamic approach to estimate NFF costs over time and across the supply chain. The term main-tenance strategy considers whether a reactive or breakdown maintenance, preventive and predictive maintenance type policy will be adopted (Pinjala et al., 2006). The type of maintenance policy influences a company’s ability to compete on the basis of cost, quality and delivery performance.Swanson (2003) state that information systems have a major role in handling complexity; which is highly relevant in delivering maintenance for NFF prone systems. Such systems can help with building decision support structure that aids the NFF management process (Darwish and Ben-Daya, 2007). The ability to predict NFF behaviour will reduce the need to keep excessive inventory of spare parts and it will allow effective equipment maintenance delivery (Horenbeek et al., 2013). In this process the ability to assess risk plays an important role, which it could facilitate with understanding the NFF drivers and how they impact on the maintenance costs (Chemweno et al., 2015).
3. Methodology
The methodology of the paper fits within the description of Soft Systems Methodology proposed by Checkland (1989). It is used to capture the critical cost drivers of NFF across the supply chain and to build a framework to estimate the cost of NFF. This
[image:6.595.51.288.607.731.2]flexible approach was taken in mind of the real world industrial context of NFF and to improve its practices through an iterative analysis, design, development, and implementation. An essential part of the study is the collaboration among researchers and practitioners. Within this process, the in-depth interaction with industrial practitioners was formed to gather data on current practice and challenges experienced. The research participants initially involved three engineers that illustrated the significance of the NFF challenge and how the cost of NFF was estimated. These pre interviews were used to develop a survey/questionnaire to collect relevant information about NFF costs.
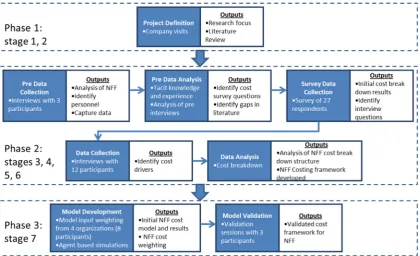
The Soft Systems Methodology is also useful to answer such ‘soft’problems, i.e. problems that have a lack of definition of‘what’ and ‘how’s of an investigated concept. The approach has com-monly been adopted to present‘a view of what could exist’in the real world (Gregory, 1993). Due to this feature, the research work reported in this paper adopted this approach against other methods, such as structured systems analysis, business process modelling and value stream. Soft Systems Methodology typically consists of seven stages: (i) approaching the problem situation, (ii) expressing the problem situation, (iii) generating root definitions of relevant systems, (iv) constructing conceptual models of ‘human activity systems’, (v) comparing the models with real cases, (vi) generate list of defining desirable and feasible changes, and (vii) taking steps to improve the problem situation. In this process industry input is necessary in Steps 1, 2, 5, 6 and 7, while Step 3 and 4 is based on decomposing the complexity of the sys-tem. This work divides these seven stages into three phases of the project. Phase 1 deals with stages 1 and 2. Phase 2 deals with stages 3, 4, 5 and 6. Phase 3 concentrates on stage 7. This helps identify and categorise NFF the cost drivers; adopting a ‘ situa-tion-driven’ mode to the Soft Systems Methodology approach (Checkland, 1989).
In order to implement these phases, the research utilised a multi-method design involving the use of online survey, work-shops and semi-structured interviews. These methods (online survey, 4 workshops and 2 rounds of semi-structured) were used to gather and analyse data from 12 key participants (from 7 UK organisations2) with industrial experiences ranging from 7 to 32 years, as described inTable 1. The methods selected to elicit data was influenced by the industrial context of the study and key informants during initial consultations. Key informants were considered to have extensive knowledge and willing to share their knowledge and skills with the researchers. These individuals were considered to have in-depth knowledge in NFF. The strategy for the methodology is illustrated inFig. 4.
During Phase 1 (stages 1 and 2) of the research project, an initial list of NFF cost drivers was developed. In Phase 2 (stages 3, 4, 5 and 6), the developed list was further developed, refined, analysed and categorised; leading to thefinalised list of NFF cost drivers. Phase 3 (stage 7) focused on developing a dynamic mod-elling approach using agent based modmod-elling as a means to esti-mate and improve the NFF costs.
3.1. Familiarisation of NFF cost (Soft Systems Methodology stages 1 and 2)
This initially involved an in-depth review of literature in order to understand the impact of the NFF phenomena and the state-of-the-art in academic related research. This consisted of topics such as the current technologies, drivers of NFF, cost drivers of NFF, processes and methodologies which are used in practice or have been proposed for the mitigation of the NFF problem. Subsequent to the literature review, a series of industrial interviews were carried out amongst industry organisations. Driven by the targets set out for this research, the focal point of the industrial data eli-citation was in line with the first three stages of Soft Systems Methodology (Checkland, 1989). The target was to address‘What cost drivers are experienced across the supply chain?’ ‘How NFF costs can be estimated?’ and ‘Who will benefit from NFF cost improvements?’ A major target of the literature review was to understand the state of current NFF research. This aims to yield
insights for industrial practitioners and academic researchers on the major trends, significant works, and future directions. There-fore a thorough review of literature has been conducted. The scope of the investigation covers the timeframe between 1990 and 2015. The research is based on reviewing a variety of journals and conference articles around NFF concepts and its application. A range of sources contributed to thefindings including electronic databases including: Scopus, Emerald insight, Science Direct, IEEE Xplorer, IET Digital Library. One of the keyfindings of the literature review was the lack of breakdown of cost drivers and a lack of systematic frameworks to estimate the cost of NFF. For the semi-structured interviews (three in total with Participants 1, 5 and 7), experts commented on how NFF costs are increasing and why it is growing in importance for service oriented contracts. The inter-views also put an emphasis on what are the NFF costs and how the NFF costs can be modelled.
The results from the interviews and literature review lead to the development of an online survey. The survey aimed to validate thefindings across a broader set of participants. Further details on the survey are provided inSection 4.1.
3.2. Development of an initial list of NFF cost drivers (Soft Systems Methodology stages 3 and 4)
An essential part of the research effort has been applied to gain NFF cost knowledge for both scheduled and unscheduled main-tenance practices. This involved carrying outfive industrial inter-views (Participants 1, 5 and 7) and one workshop (including Par-ticipants 3, 6 and 12), which lasted between one to two hours. In this process, the interviews were conducted iteratively to elicit a list of potential NFF cost drivers based on three challenging pro-jects that participants delivered within their context. The inter-views also explored the current processes for managing NFF and estimating NFF costs. Subsequently the workshop aimed to vali-date the list of cost drivers and processes that were collated. This approach has led to the basic understanding of how NFF costs manifest themselves in a diagnostic process. This process involved close collaboration with the UK NFF Working Group (NFF WG). The ADS MRO & Logistics Network has established the UK NFF WG with a view to cutting across organisational boundaries in pursuit of a joined-up approach to solving NFF across the aerospace industry. From the outset, support from Cranfield University and other industrial collaborators–like Copernicus Technology Ltd.– have been instrumental in the work of the group (Khan et al., 2014). The decision follows a strategic review of the UK MRO sector by members of ADS (the UK trade association for aerospace, defence and security industries) and the Aerospace, Aviation & Defence Knowledge Transfer Network. It was recognised that there Table 1
List of participants.
# Background Years of experience
Participant 1a
Reliability engineer 12 Participant 2 Reliability manager 8 Participant 3 Service manager 14 Participant 4 Maintenance engineer 18 Participant 5a Airworthiness manager 8þ
Participant 6 Project manager 7 Participant 7a
Senior reliability engineer 14 Participant 8 Maintenance engineer 8 Participant 9 Technical director 18 Participant 10 Commercial aviation consultant (retired) 30þ
Participant 11 Operational performance engineer 23þ
Participant 12 Managing director 23
a
Participants took part in the pre-data collection process and validation pro-cess.
2
is an opportunity to strengthen the UK MRO sector's capabilities and competitive edge by making a step-change in improvements to solve NFF problems. The group is actively involved with examining the potential to use members’maintenance data and to identify opportunities for NFF improvement case studies. As an outcome of the stages 3 and 4 the authors recognised that the NFF challenge is experienced across the supply chain and requires an integrated solution, which should be reflected in the cost esti-mation process. This promoted eliciting cost drivers for the cus-tomer, original equipment manufacturer and supplier.
3.3. Further refinement (Soft Systems Methodology stages 5 and 6)
The process of validating the collated cost drivers and cost estimation processes included two workshops (attended by Par-ticipants 5–9 and Par 10–12 in the two instances). The refinement was experienced in what are the key drivers of NFF and various costing processes.
3.4. Development of software tool for NFF cost estimation (Soft Systems Methodology stage 7)
A behavioural model was developed using agent based mod-elling in AnyLogic™. AnyLogic™ is the first and only tool that brings together System Dynamics, Discrete Event, and Agent Based methods within one modelling language and one model devel-opment environment. The language of AnyLogic™ is relatively
flexible and enables the capture of complexity and heterogeneity of business, economy and social systems at any level of detail to gain deeper insight into interdependent processes going on inside and around the organisation. Thisfinal stage involved a workshop that was attended by 8 participants (Participants 1–5, 8, 10, 11). The finalised model was presented and validated by the infor-mants of the study based on completeness of model to estimate cost and the comprehensiveness of how NFF is experienced across the supply chain. Using the NFF cost list, a dynamic model was developed to aid in the analysis of NFF costs. It focuses on aiding
engineering teams involved in delivering maintenance and face NFF challenges.
4. Identification of current practice
This section provides further details for each of the key stages identified inFig. 4. The next four sub-sections present the four steps in developing a NFF cost model and the validation of the model is presented inSection 5.
4.1. Survey data collection
The research developed a questionnaire (from literature review and pre data collection interviews) that primarily aims to gather information related to the cost impact of NFF. The set of questions have been included in the appendices. The primary questions in the online questionnaire focused on the identification of the costs involved:
During Preventive maintenance (PM), during Corrective maintenance (CM), and across the supply chain during NFF occurrence.In addition, other questions focused on:
The root cause of NFF occurrence, and their sensitivity to the project impact. [image:8.595.94.515.56.312.2]36%). Other than aerospace, railway is the next industry which is facing the problem.
The main findings of the survey are as follows: most of the participating organisations did not calculate NFF costs nor do they have any framework to estimate it. Organisations that do recognise NFF as a problem collect the following data: reliability rate, logistics costs, contractual var-iation within the customer base, repair cost, lost man-hour data, down time hours on the machine, time wasted on testing the unit, handling cost, shipping cost, assumption for cost to replenish stock during the shop visit and material cost. The costs of NFF are often distributed between corrective andpreventive maintenance. Most of the NFF cost (approximately 90%) is observed during corrective maintenance and the rest in preventive maintenance.
The supply chain is an integral part of both types of main-tenance and it affects both tangible and intangible costs. In both cases cost due to lost man-hour, capital expenditure cost, obsolescence cost and cost of maintaining a large inventory of spares are the major concerns within the organisation. Cost drivers: maintenance costs, costs due to machinedown-time and unavailability are the major cost drivers. Additional drivers include the cost of future failure (due to an unidentified cause of the fault) and rising NFF rates (increasing frequency of component transfer between operator and supplier), which in itself are logistics induced maintenance costs. With reference to the cost associated with the supply chain, the primary cost driver was identified to be the transportation cost, followed by machine downtime cost, packaging and handling cost and also the intangible cost. Additional intangible costs include loss of business, safety (when the fault still exists somewhere on the equipment) and unsatisfied customer.
4.2. Data collection: interviews
After the online survey wasfinished thefindings were analysed and thesefindings led to the creation of a detailed set of questions for the face-to-face interviews. These questions were more specific on how organisations handle NFF cost, processes involved, what key performance indicators are used and how do managers benchmark their performance (a list of some of these questions can also be found in theAppendix A). These interviews demon-strated that the main root causes noted were as follows:
1) Electronic connections, 2) ageing components,
3) rogue units that increase the rate,
4) occurrence but are not sorted out by inadequate processes, 5) tests or test equipment, and
6) poor soldering is a surprisingly significant cause resulting in intermittent faults that might not show up in the test period on the ground or at the supplier.
In addition, other prominent factors included customer culture, human influences (such as change a Line Replaceable Unit (LRU)3 because a pilot wants an action or because it is quicker than taking
the time to investigate properly) and poor training. The key areas where improvements should reduce the cost of NFF were
identi-fied as better diagnostics (such as ensuring maintainers only see messages that mean that they need to take an action). This requires better understanding of:
1) The Built-in Test Equipment (BITE),4 2) equipment integration issues,
3) health monitoring which allows data to be analysed separately, 4) enabling intermittent faults to be more easily identified and
linked to the environments or actions, 5) process improvements, and
6) recognition of true costs of NFF throughout the organisation not just at 1st line. Establishing a dedicated resource to drive in the process and diagnostic improvements.
4.3. Framework development
The literature review and industrial interactions demonstrate that there is a lack of frameworks that are available to assist with estimating the cost of NFF. This gap led to the development of a framework that is generic enough to be applied across organisa-tions and industry sectors. Due to the inability to collect actual costfigures from industry for different NFF cost drivers, the fra-mework offers ratios between cost drivers and offers a probabil-istic approach to recognise the cost across the supply network. There are two types of costs estimated in this framework:
1) the cost impact of NFF on a given system, and 2) the cost to mitigate NFF.
The first type, the cost impact of NFF, is experienced during corrective and preventive maintenance. This refers to the costs that are experienced after the NFF issue is identified. However, from the survey results and interviews with industry personnel it is clear that the primary NFF costs are experienced during cor-rective maintenance–which is divided between the supply chain, the OEM and the customer. The actual cost distribution would depend on the specific contractual obligations, but it is also clear that it is the customer who suffers more and bears the major portion of the cost. This impact of NFF is not limited only to the tangible cost as explained above, but also involves intangible costs too. In any business it is easier to estimate the costs which are tangible in nature, such as lost man-hour, handling and packaging cost, machine downtime cost and warranty cover cost, than the intangible costs like loss of business, deteriorating business rela-tion, impact on the brand and image of the company and safety. Among all the intangible costs, safety seems to be a key contributor.
The second type, the cost to mitigate (or reduce) the impact of NFF, is distributed across several areas within the supply chain. This involves activities that are undertaken in order to reduce the likelihood of experiencing NFF issues. It is also difficult to quantify such costs as it all depends upon the nature of the business. For example, if an organisation deals with a large number of equip-ment and man-hour then the cost of mitigating NFF will be rela-tively higher due to the higher risks. Training is one of the key areas for mitigating the effect of NFF. Hence, it is necessary to allocate a part of the training budget for NFF training and pre-paration of proper documents and manuals.
3
A Line Replaceable Unit (LRU) is a modular component that is designed to be replaced quickly at an operating location. It is usually a sealed unit, used to improve maintenance operations, because they can be stocked and replaced quickly from on-site inventory, restoring the system to service, while the failed (unserviceable) LRU is undergoing maintenance. Because they are modular, they also reduce system costs and increase quality, by centralizing development across different system platforms.
4
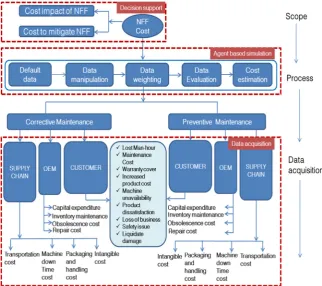
The proposed framework is composed of three steps:
1) scope definition,
2) data analysis (process), and 3) cost analysis (data acquisition).
Fig. 5aims to classify the costs into corrective and preventive cost across the supply chain, OEM and the customer.
Step 1. Scope definitionhelps in decision making at the stra-tegic level and has two subsections as cost impact of NFF and cost to mitigate NFF.
Step 2. Data analysis (process) is comprised of five sub-sections as default data, data manipulation, data weighting, data evaluation and cost estimation. Data manipulation is defined as one of many low level analysis techniques that are required. Data weighting allows assigning different weights to the variables during the analysis. It is usually used to remove skewness in the data that is meant to represent a particular population. Data evaluation is required to maintain both the quality of the available sources of data for the purpose of the analysis, and the removal of uncertainty from it. It is desirable to control the quality of raw data and is highly dependent on the sources of availability. Finally, the last section is the cost estimation.
Step 3. Cost analysis (data acquisition)focuses on the main cost drivers: CM and PM. Both cost drivers have three subsections as customer, supply chain and OEM.Table 2, covers the key cost drivers associated with NFF experienced across the supply network.
Each of these cost drivers are susceptible to dynamic behaviour and require appropriate techniques in order to capture their associated cost impact on the overall system. The following section explains the simulation approach that was adopted within the framework.
4.4. Model development
The model developed within the framework uses an agent based modelling approach using the software AnyLogic™. The presented work is not limited to this software package and alter-native agent based modelling solutions could also be employed to carry out a similar analysis.
AnyLogic™ supports the common simulation methods i.e. system dynamics, discrete events and agent based modelling. In the NFF context, there are multiple variables that are of interest that in common experience variability and exist in a highly com-plex modelling environment.
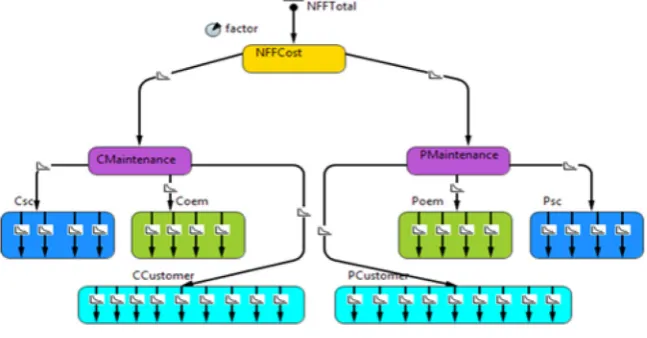
[image:10.595.140.463.57.343.2]The model developed includes a population of agents that contribute towards the total NFF costs, which are divided in to preventive and corrective maintenance costs. These two types of costs each have three agents that represent the supply chain, namely: customer, OEM and supply chain. Thus, there are nine agents in total based on the supply chain, as represented inFig. 6
[image:10.595.311.563.407.540.2]Fig. 5.The generic framework for estimating the cost of NFF.
Table 2
Cost drivers for NFF.
Cost drivers
Supply chain OEM Customer
Transportation cost Capital expenditure Lost man hour cost Machine downtime cost Inventory maintenance
cost
Maintenance cost
Packaging Obsolescence cost Warranty cover cost Handling cost Repair cost Increased product cost Intangible cost Machine unavailability
cost
and Table 3. The behaviour of the model is controlled by the transition from one state to another state. In the state chart for the model, attributes are assigned, and the model output depends upon these attributes. The state chart of the model is as shown in
Fig. 6, and the total NFF Cost is dependent on the amount of cor-rective and preventive maintenance experienced across the supply chain, OEM and customer. The main cost drivers across these were listed inTable 2.
Relationships between the agents and the dynamic behaviour of the model are described below:
1) In order to analyse the actual cost, a range of pre-defined default values can be selected before the execution of the model. Firstly, the values of input parameters depend upon the project and also on the industry. Secondly, it is also noted that the behaviour of NFF occurrence varies from project to project and also from industry to industry. Thirdly, it is observed that in the case of electronic components, the occurrence is approximately double as that of mechanical components. These three factors mean that the input parameter values depend upon many drivers, which can change dynamically.
2) The occurrence of corrective and preventive maintenance is controlled by the parameter“factor”defined in the model. To simulate the result dynamically users can increase or decrease the value as per their industry requirement.
3) Corrective and preventive maintenance cost comprises of three main agents including customer, supply chain and OEM. The model uses the state chart utility called“rate”to capture this relationship. Similarly, the rate was defined for other detailed parameters also. For the main and detailed cost drivers, user can increase or decrease the parameter values and analysis of the result with different combination of inputs.
4) The initial condition for the occurrences of NFF during CM is set at 80% and for PM is 20%. The occurrence of NFF during the year is considered as 500. From the online web survey result and
findings of the interview with industry experts, it is evident that the occurrence of NFF during corrective maintenance is 80% at the bare minimum. This is the basis for setting the initial con-dition for the model. Similarly, the initial concon-dition for customer (at 50%), supply chain (at 20%) and OEM (at 30%).
The similarities found when NFF occurs during preventive and corrective maintenance are; NFF mainly occurs atfirst line where faults are experienced. At second line much maintenance is scheduled inspection and it is unlikely that NFF results from scheduled maintenance. However, when a LRU is tested on second line, then a big rate of NFF may be experienced because of factors such as poor test equipment and test routines. Also, adequate data is not available to the tester of the LRUs which adds usage when the fault occurred. Even when available, it is required to replicate that environment for the test. However, the dissimilarities are as follows: preventive maintenance is an inspection or replacement of items at the end of useful life so this is dissimilar tofirst line corrective maintenance. Inspection and replacement do not gen-erate the sort of fault that will possibly end up as an NFF. In cor-rective maintenance, there is an assumption that there is a fault and if it is not located, it is declared NFF; preventative main-tenance does not assume a fault.
5. Verification and validation of model results
5.1. Model input
[image:11.595.131.455.60.229.2]As the actual cost figures from industry were not possible to collect, this paper offers an innovative ratio based classification of the cost drivers to be able to estimate the NFF cost estimate. It was collected during a workshop for the UK NFF WG with 8 partici-pants (Participartici-pants 1–5, 8, 10, and 11) who are employed across four UK aerospace organisations. Participants were requested to rank the NFF cost experienced. The rank was assigned on a 1–10 point basis (1 being the lowest and 10 being the highest impact). The generated default values are used in the agent based model to build relationships between different cost drivers. The default values for sub-component of corrective and preventive main-tenance are presented inTable 4. It can be observed that the lar-gest NFF cost is typically experienced by the customer, then OEM and supply chain.
[image:11.595.32.284.272.374.2]Fig. 6.State chart of the model.
Table 3
Variables used in the model.
Model variable Characteristic
NFFCost Cost of NFF events CMaintenance Corrective maintenance PMaintenance Preventative maintenance
The default values for the customer cost drivers are as shown in 5. As can be observed, the highest cost driver is the“maintenance cost”followed by the“lost man-hours”and“safety issues”. These cost drivers are essential when considering the NFF costs.
Table 5demonstrates the default values captured for the customer cost drivers.
The default values for cost drivers of OEM are as shown in
Table 6. Thefigures demonstrate that“repair cost”has the biggest impact on NFF cost.
The default values for the supply chain cost driver are as shown inTable 7. Accordingly, the“machine down time”and“ transpor-tation cost”are the two main cost drivers experienced.
The default values of the input parameters are being used for generating the output in unit cost. However, the actual value of the output depends upon the real input provided by industry for the respective project/component and it can be assigned dynamically. Similarly, in the real environment the unit cost is the actual cur-rency used by the respective industry.
5.2. Model output
The time unit for the model is defined in terms of month and the model generates output for twelve months/one year. An out-put of the model in unit cost is as shown inFig. 7.
The output stated above represents only one instance of the model, and in a similar way a number of outputs can be generated by varying the parameters dynamically and the result can be analysed. Tabular representations of the NFF cost in percentage as well as absolute value are also shown below.Tables 8and9show the distribution of corrective and preventive maintenance cost respectively, whereas Table 10 shows the distribution of total NFF cost.
5.3. Model uncertainty and sensitivity
5.3.1. Uncertainty
The model takes account of uncertainty through the number of NFF events that occur. This is represented through triangular dis-tribution, which requires specification of the maximum, minimum and most likelyfigures. The triangular distribution was the pre-ferred option due to the relative ease for industry to provide values to represent the extremes of NFF events occurring. The
values covered in the previous section represent the most likely estimates. This in turn influences the total cost. To analyse the uncertainty of the developed model, standard deviation, variance and standard error are calculated.
5.3.2. Sensitivity
NFF occurs due to a number of root causes. It means that the cost will not be the same for different root causes. To capture this behaviour of the model, the root cause sensitivity is provided. The purpose of this is to capture the varied output while the model is running. A graph was plotted from the survey result data and a bell shaped curve was formed. The frequency diagram of root cause sensitivity reflects the frequency of NFF events that is shown in Fig. 8. Thefigure shows that during operational maintenance there may be between 0 and 14 root causes. Furthermore, at 7 root causes the frequency of NFF events may be maximised.
5.4. Model optimisation
Optimisation is defined as a process in which the values of the parameters with respect to the objective function are found which gives an ideal solution (Huang and Teghem, 2012). Whilefinding the objective of minimising or maximising the factor, the best case for the parametric value (e.g. frequency of NFF events) of other parameters such as the value of customer, supply chain and OEM are obtained and reported. In order to clarify the terms used for the optimisation:
Factor is used to control the occurrences of NFF during cor-rective and preventive maintenance. If the value of‘factor’is set as 1, then the occurrence of NFF will be in corrective main-tenance only. Similarly, if the value of‘factor’is 0.9 it means that 90% occurrence of NFF will be in corrective maintenance and 10% in preventive maintenance. Optimisationrefers to achieve the maximum/minimum value of ‘factor’, which controls the occurrence of NFF during cor-rective and preventive maintenance. Values of the parameters:Once the objective maximisation/ minimisation is achieved the simulation gives the values of the different parameters at which the maximum/minimum value is achieved.Table 4
Default values of CM and PM sub-component.
Cost Driver Organisation-1 Organisation-2 Organisation-3 Organisation- 4 Sum Default value
Customer 10 10 7 5 32 0.5
OEM 7 5 5 3 20 0.3
Supply chain 6 5 1 2 14 0.2
[image:12.595.40.564.184.295.2]Total 23 20 13 10 66 1.0
Table 5
Default value of customer cost drivers.
Cost Driver Organisation-1 Organisation-2 Organisation-3 Organisation-4 Sum Default value
Lost Man-hour 8 8 10 5 31 0.14
Maintenance Cost 9 8 10 9 36 0.16
Warranty cover 5 4 10 19 0.09
Increased product cost 7 5 9 5 26 0.12
Machine unavailability 10 8 9 2 29 0.13
Product dissatisfaction 6 8 8 22 0.10
Loss of business 2 8 10 20 0.09
Safety issue 10 8 10 28 0.13
Liquidate damage 2 4 1 5 12 0.05
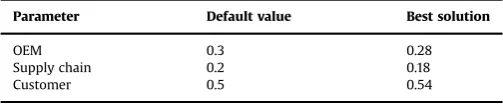
5.4.1. Case I objective: minimisation
In Case I the objective was set to minimise the parametric value of the parameter factor. The default value for this parameter (percentage of contribution to cost) is set at 0.8, which is not the best solution of the model. While running the model the other three parameters, i.e. the customer, supply chain and OEM are also optimised. The optimisation of the parameters is done by using the utility of the software named optimisation. The graphical repre-sentation of the optimised (minimise) solution is as shown inFig. 9. From the result as shown inTable 11, the minimum value of factor is 0.89, it means that the occurrence of NFF during cor-rective maintenance (CM) will be 89% while that of preventive maintenance (PM) will be 11%. The corresponding values of other parameters are customer (0.54), supply chain (0.18) and OEM (0.28).
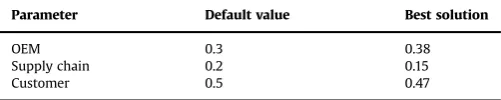
5.4.2. Case II objective: maximisation
In case II the objective was set to maximise the parametric value of the parameter factor. The graphical representation of the optimised (maximise) solution is as shown in Fig. 10. From the result as shown inTable 12the maximum value of factor is 1.00, it means that the occurrence of NFF during corrective maintenance (CM) will be 100%, while during preventive maintenance (PM) will be 0.00%. The corresponding values of other parameters are cus-tomer (0.55), supply chain (0.15) and OEM (0.40).
5.5. Model validation
The validation of the generic framework and the corresponding simulation model is done by three industry engineers/managers who face NFF problems. All three experts (Participants 1, 5 and 7) are working in the aerospace sector, and have a combined experience of 34þyears. These participants had also taken part in the pre data collection phase of this project.
The validation was achieved through semi-structured inter-views that lasted two hours each. The interinter-views comprised of questions that collect data for the following:
user interface, the calculation logic used for cost estimation, the input parameters and difficulty in obtaining these data, and the model output andfinally the tool applicability. [image:13.595.30.561.195.264.2]About the overall model applicability, the interviews revealed that it varies from organisation to organisation. About the overall Table 6
Default values of OEM cost drivers
Cost Driver Organisation-1 Organisation-2 Organisation-3 Organisation-4 Sum Default value
Capital expenditure 4 7 7 5 23 0.21
Inventory maintenance 4 8 9 5 26 0.24
Obsolescence cost 4 7 6 10 27 0.25
Repair cost 6 9 9 10 34 0.31
[image:13.595.306.549.276.456.2]Total 18 31 31 30 110 1.0
Table 7
Default values of supply chain cost drivers.
Cost Driver Organisation-1 Organisation-2 Organisation-3 Organisation-4 Sum Default value
Transportation Cost 5 6 6 10 27 0.30
Machine Down Time 5 8 10 5 28 0.31
Packaging and handling cost 4 5 3 10 22 0.24
Intangible Cost 3 5 5 13 0.14
[image:13.595.302.552.508.566.2]Total 17 24 24 25 90 1.00
Fig. 7.Model output.
Table 8
Corrective maintenance output.
Corrective maintenance parameters Contribution (%) Unit cost
Customer cost 75.5 d4,644.0
OEM cost 9.8 d599.2
Supply chain cost 14.7 d904.8 Total Corrective Maintenance Cost 100 d6,148.0
Table 9
Preventive maintenance output.
Preventive maintenance parameters Contribution (%) Unit cost
Customer cost 74.1 d1,096.5
OEM cost 11.0 d162.4
Supply chain cost 14.9 d220.4 Total preventive maintenance cost 100 d1,479.3
Table 10
Total output.
Total NFF cost parameters Contribution (%) Unit cost
[image:13.595.302.553.602.660.2] [image:13.595.303.554.695.746.2]model applicability the result shows that it varies from organisa-tion to organisaorganisa-tion because each stakeholder treats NFF differently.
Participant 1 highlighted that“the developed cost estimation framework is applicable at various levels including component, system/project and organisation”. Participant 5 emphasised that “in the absence of data for the whole organisation, the company may collect the data for one component and analyse its total cost”. All participants suggested that the model can provide their orga-nisation the ability to analyse the cost of NFF for a particular unit only. This was suggested to help in focusing the core areas where improvement can lead to reducing NFF cost. In summary, it can be advocated that the input, calculation logic and the output of the model fulfils the requirements of this research. Furthermore, its applicability depends upon the industry in consideration.
6. Discussion
The paper presents a dynamic time based modelling approach that can be applied (e.g. agent based) to represent the cost of NFF across the supply chain. To develop the simulation model, the prerequisite is to collect data to identify the key cost drivers within (and outside) the organisation–covering the entire supply chain. The managerial implication are to help understand the costs involved and hence in the decision making process. This section discusses the authors’outlook on the study.
6.1. Academicfindings
From the literature review it was realised that the costs attributed to NFF events can be classified into three categories:
1) The preliminary cost: these are all costs associated with the event investigation. These incorporate time for diagnosis, loss of man hour (due to surplus testing) and the replacement of ser-viceable components from operation.
2) The secondary costs: These are all costs associated with testa-bility of suspected units (that were removed). The atesta-bility to carry out environmental testing and intermittent fault detection and isolation can considerably affect the overall maintenance budget at this point.
[image:14.595.50.286.230.423.2]3) The tertiary costs: These are all costs associate with component support services. Within the supply chain, these costs will
Fig. 8.Root cause sensitivity.
[image:14.595.311.563.380.432.2]Fig. 9.Best feasible solutions while minimising factor.
Table 11
Optimised value of parameters (minimisation).
Parameter Default value Best solution
OEM 0.3 0.28
Supply chain 0.2 0.18
[image:14.595.85.523.384.723.2]consider the impact on inventory management (to keep up with demand–considering that a significant number of units in the repair loop are not in fact faulty).
Secondary costs are perhaps the most important of the three. Given the increasing total cost of ownership, tight maintenance bud-gets, and attempts to remain competitive, verifying the functionality of the component can be a risky option. How far would testability efforts go in order to ensure that all environmental conditions and system failure modes are recreated to test system functionality?
If the answer to the question is “minimal” testability efforts, then the organisation’s ethos is to maximise the return on their contracts rather than enhance their maintenance practises. This will result in a rise in the number of unscheduled removals – leading to an increase in NFF events. The fact that most commer-cial contracts do not acknowledge NFF as an issue; no mechanisms are placed to calculate its true costs. With no defined metrics or responsibility, NFF continues to cause wastage of resources and unproductive time utilisation – adding to maintenance costs, downtime and unavailability of systems.
The model presented in this paper has three sections that serve the purpose of the organisation at different levels. At the top level it has decision support feature which helps the top management of the organisation in making strategic decisions. At the second level it helps in making the decision at the middle management level, as most of the decisions taken by middle management deals with processes of the organisation. At the lowest level the detailed cost drivers are identified and are a part of shopfloor activities. This shows that the developed framework is useful to all the three levels of management in the organisation. Similarly, the generic
framework for NFF cost estimation demonstrates how qualitative and quantitative information can be used together to achieve maintenance objectives. It helps in understanding the inter-relationships of the various activities, which contain the functions and processes that interrelate to contribute to the overall system costs.
The developed framework can be improved if the real data from the industry were available. In the absence of real data the framework is built on some assumptions such as the contribution during the corrective and preventive maintenance. Similarly, the default values were collected during the NFF workshop and it may happen that due to small number of participants the values are skewed. The developed generic framework could also be verified and validated for their reasonableness in other companies having the similar work environment and these may be further refined or expanded.
6.2. Industrial perspective
The number of responses to the questionnaire is satisfactory, however the response might be skewed to aerospace, military and defence and railways. One of the reasons for this is that the ori-ginal respondents are predominantly from those areas. Similarly, mostly the respondents have a technical background and experi-enced NFF for a long time. This has led to the impression that the NFF problem is more technical than commercial. The people who hold more commercial roles in their organisation might have a better understanding of business and cost impact. It means that the contribution of these people may be more beneficial.
1) NFF corrective maintenance cost is much higher than the pre-ventative costs. This requires further methods and techniques that can help to reduce the costs experienced. The scale of corrective maintenance requirements could potentially be associated with the lack of information that getsfiltered down by the customer to the OEM and supply chain.
[image:15.595.83.508.62.323.2]2) The OEM experiences the least amount of NFF corrective maintenance cost, compared to the customer and the supply Fig. 10.Best feasible solutions while maximising factor.
Table 12
Optimised value of parameters (maximisation).
Parameter Default value Best solution
OEM 0.3 0.38
Supply chain 0.2 0.15
[image:15.595.33.284.368.418.2]chain. This promotes a lack of motivation to reduce costs across the supply chain. This demonstrates that there is a lack of recognition of the NFF costs in Contracting for Availability type arrangements, which is contrary to the literature. Future expectation would be to experience further NFF inclusive solutions offered by the OEM and supply chain.
3) NFF preventative maintenance costs are less than corrective maintenance costs as expected. Similar to corrective main-tenance, the OEM experiences the least amount of cost com-pared to the customer and the supply chain.
This framework is applicable to a particular component, sys-tem/project and organisation. In the absence of data for the whole organisation, the company may collect the data for one component and start analysing NFF cost. It is being experienced that some of the units are having more occurrences of NFF than another. By applying the framework on one component, the organisation has the liberty to analyse the cost of NFF for that particular unit only. This will help in focusing the core areas where improvement can lead to reducing NFF cost. Similarly, the electronic components are seen having more NFF occurrence than mechanical components. The framework is able to analyse the NFF cost separately for electronic and mechanical components considered as different projects. This can lead to the NFF cost calculation for a system or project. Finally, if the data is available for the whole organisation, the total cost impact can be calculated for the whole organisation. In summary, it can be said that the developed framework may be applied to calculate the NFF cost of a component, system/project as well as for the whole organisation.
7. Conclusions and future work
To the best of the authors’knowledge the performed study has moved the body of scientific knowledge by reviewing existing literature related to NFF costs and proposing a framework to model the cost impact of NFF. The aim is to provide a generic picture of the major cost drivers and provides academic and industrial perspectives to manage the NFF costs. The methodology presented has shown that models developed inSection 4can be used to support decision makers for managing their supply chains, both during normal operation and with an NFF overhead.
Supply chains are complex and adaptive systems with many heterogeneous actors and physical components interacting through differentflows, including material, information, monetary and socialflows. Furthermore, decision making in a supply chain is distributed among different actions, and each of these actors has its own objectives and procedures for decision making. The col-lective decisions made by these autonomous actors at various levels of the system result in the overall system behaviour. Therefore, the need for a modelling approach that can capture all these interactions and complexities becomes relevant. Agent based modelling is flexible and can define a broad range of experiments with different scenarios to answer“what if” ques-tions; this is critical for decision support under disruptions or in the design phase. The model developed here follows a top down approach, making it relatively simple to change the configuration at the systems level: it is easy to include new maintenance costs and attributes.
In summary, the research outcomes benefit organisations in estimating the cost of NFF within their organisation and also across the whole supply chain.
The developed framework serves the purpose of offering guidelines in the selection and estimation of NFF cost. In parti-cular, it helps with the following:
1) Identification of abnormal cost drivers and its behaviour. 2) Associated performance metrics with cost implications. 3) Allow analytical and heuristic sources to be used effectively
alongside process history, costs and risks.
4) Be accessible for additional cost/heuristic data to be incorpo-rated without any alterations.
5) The knowledge of how an NFF affects the overall system can lead onto the notions of where to concentrate and where to minimise effort.
The framework can help with answering a number of questions such as the following:
1) If in a contract the customer has bought a number of repairs up front, and if there is an NFF, it will result in additional cost to the customer, no significant cost to the contractor andfinal profit to the supplier.
2) If the supplier is asked to investigate NFF more vigorously he/ she will often have a significant additional charge (could be even double)–at this stage more profit to the supplier, more cost to the customer and the contractor.
3) If the investigation results in fewer components being sent back for repair, it will result in cost savings to the customer and a loss of profit for the supplier.
4) If the investigation results in a defect being identified on LRUs, this could result in the supplier charging against the repair contract for the fault or being liable for repairs and having to make preventative repairs on all other return LRUs.
5) Further strip and test at subsequent levels may uncover faults not related to the original fault, so may hide rate and the cost of NFF. On the other hand the cost of the test and repair will still have to be paid, but might not have really been needed if earlier tests had been more successful.
There are some barriers that may affect the applicability to use this modelling approach: one main challenge concerns validation and this is one of the main sources of much of the criticism that agent based modelling has received in the literature. However, in this case, agent based simulations help in analysing the actual distribution of the different costs associated with NFF which has been validated by three industry experts working in NFF supply chain management.
In addition, the behaviour of the model is dynamic and sensi-tive to various factors. Here, the sensitivity is provided at two levels: thefirst level of sensitivity is due to the variation in root-cause occurrence, whereas the second level of sensitivity is due to variation of different parameters involved across the customer, OEM and supply chain.
7.1. Future work
This work has opened up a wide area of future work. There are a number of areas that are being suggested by the author for consideration:
1) The costs and its breakdown are sensitive within and between organisations. The people within the company working in more commercial roles may have better access to these data as accessed by the people who are working in the UK NFF WG. Hence interdisciplinary involvement will provide better under-standing of the cost and its breakdown.