Mapping Blade Angle Effects for The Erosion of
Polymer Based Composites: An Approach to
Developing Smart Materials for Tidal Turbines
Rafee A.R Ahamed, Cameron M. Johnstone, Margaret M. Stack
Department of Mechanical and Aerospace Engineering, University of Strathclyde James Weir Building ǀ 75 Montrose Street, Glasgow, G1 1XJ, United Kingdom
University of Strathclyde rafee.rafee-ahamed@strath.ac.uk cameron.johnstone@strath.ac.uk margaret.stack@strath.ac.uk
Abstract Tribology in marine renewable technologies has become of increasing interest due to the implications for developing improved materials for tidal and wave energy conversion devices. For tidal devices, the materials of interest are primarily polymer based composite materials that are used to provide structural integrity while reducing weight. These are specifically applied to turbine blades to withstanding the high impact loadings in sea water conditions. At present, current materials in test trials have demonstrated some limitations in service. In this paper, fundamental research has been carried out to investigate tribological mechanisms of potential candidate composite materials to be used in tidal turbines by firstly considering the effects of various erosion parameters on the degaradation modes, with and without particles in sea water conditions. The erosion mechanisms of composite materials used in tidal turbine blades have been evaluated using Scanning Electron Microscopy techniques to analyse the surface morphologies following testing in water representative of the constituents of costal sea water. Generic erosion maps have been constructed as a first step approach to identify regions of minimum erosion for the operating conditions and to identify the significant effect of the sea water environment on the degradation of the composite.
Keywords G-10 GFRP composite; Tidal turbine blades; Composite blade degradation; Solid particle erosion; Erosion rate; Particle velocity; Impingement angle; Scanning Electron Microscopy (SEM).
I. INTRODUCTION
Converting the energy produced from tidal flows to an economic source of electric power has many challenges, particularly in the area of reducing device mass and capital investment. Increased use of composite materials has the potential to contribute to these goals; however a challenge exists in the production of materials sufficiently robust to withstand the environmental in-sea conditions of the exposure conditions [1]. Typically, G-10 grade, glass fiber-reinforced composite laminates are widely used as structural materials in various components and find applications in the area of precision mechanical parts, pipelines and high voltage insulations [2]. Due to the favourable mechanical properties,
the composites are broadly used in the engineering industries such as marine, energy, automobile, mechanical and aerospace applications [3]. The polymer composites involved in marine applications are often exposed to challenging environments in which they experience solid particle erosion. However, the erosion behaviour in extreme marine conditions is not well understood or established and this include the ability of the leading edges of tidal turbine blades to withstand the exposure conditions [4].
This paper investigates the erosion behaviour of G-10 grade fiber-reinforced composite laminates as used in tidal turbine blades and proposes the development of erosion maps to predict and understand the erosion rate based on conditions representative of the constituents of costal waters. Following a review of the consitituents of UK coastal waters, the erosion experiments have been carried out using irregular silica sand (SiC) particles (300-150µm) as a erodent. The erosion losses were evaluated at various impingement angles (15°-90°) representative of the range of angle of impingement experienced by tidal turbine blades and with the change of impact velocity (2.5ms-1 – 6.5ms-1) reflecting typical velocities experienced at the leading edge of the blade. The morphology of the eroded samples was observed under scanning electron microscopy conditions and the resulting damage mechanisms are discussed.
II. EXPERIMENTAL INVSTIGATION
A. Materials
The material used in the erosion test is a commercially available G-10 grade glass fiber-reinforced composite laminate material supplied by the Attwater & sons Ltd and Custom Composites Ltd. The properties of SRBG composites are given in the table 1. Rectangular specimens, with dimensions of 36mm×25mm×6mm were tooled and tested.
B. Experimental setup and procedure
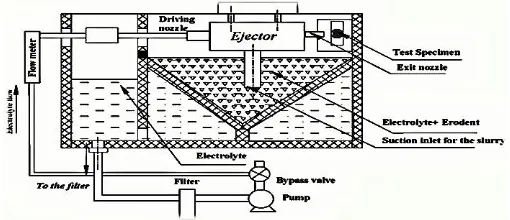
ratio of inlet nozzle to the outlet nozzle diameter (d/D), and the L- distance [6]. The erosion test was performed at three different impact velocities of 2.5ms-1, 4.5ms-1, and 6.5ms-1 and the corresponding combinations of inlet and outlet nozzles are 2.8mm & 6.52mm (2.5ms-1), 3.6mm & 6mm (4.5ms-1) and 3.6mm & 4.48mm (6.5ms-1). The impingement angle was adjusted in the range of 15-90°. The slurry mixture consist of 3.5% of the salt and 3% of irregular silica sand as a erodent. Table 2. The silica sand particles were supplied by the Fife Silica Sands Ltd. The samples were tested one at a time by fixing onto the specimen holder and eroding for 30 minutes.
Fig. 1 Schematic diagram of slurry impingement jet rig
TABLE I
PROPERTIES OF G10 SPECIFICATION [5]
G10 sample properties Flexural strength (MPa) 482
Tensile strength (MPa) 320 Shear strength (MPa) 131 Density (kg/m3) 2000 Specific gravity 1.82 Water absorption (mg) 0.8
Body colour Green
C. Erosion testing
The specimens were shaped and sized using the Sic paper grit 220, then cleaned with methanol and weighed using an electronic balance. In order to maintain the consistency of the erosion testing, and to avoid the particle degradation, the slurry chamber was completely cleaned, the erodent particles were dried blasting hot air and sieved to separate the degraded particle due to the recirculation process. The experiments were performed at ambient temperature, and irregular silica sand particles in fig 2 with the size of 300-150µm is used as a erodent. Table 3 lists the test parameters. The particle was driven by a static pressure of 0.5-1 bar, the specimens were approximately cut into 36mm×25mm×6mm in dimensions [7]. They were then mounted onto the specimen holder which fitted with an impact angle gauge, can be rotated about its vertical axis to represent the angle of attack the blade makes with the water, along the span. This was eroded for 30 minutes with the range of angles tested from 15-90°, representative of the typical angle of attack through to stall conditions of a stationary blade in the flow. Wear was measured by weight loss after 30 minutes of erosion. In order to understand the mechanism of material removal and to characterize the morphology of the eroded surfaces, the samples were analysed
using scanning electron microscope (SEM). In the analysis, all samples were sputter coated with gold before the examination and in these experiments the charge accumulation on the samples were prevented by application of carbon gum to the edge of the sample.
TABLE II
CHEMICAL COMPOSITION OF THE SAND PARTICLE [8]
SiO2 Fe2O3 Al2O3 K2O CaO Na2O LOI 98.88 0.031 0.50 0.29 <0.035 <0.02 0.22
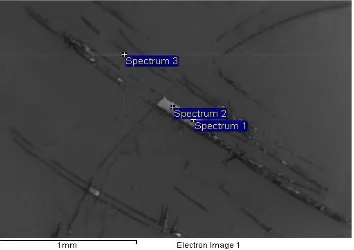
[image:2.595.38.293.192.302.2]Fig. 2 SEM analysis of SiC particles 300-150µm
Table III TEST PARAMETERS
Test parameters
Impact angle 15, 30, 45, 60, 75, 90° Solutions Salt only, and Salt + Sand
Salinity (wt %) 3.5
Sand concentration (wt %) 3 Test duration (mins) 30 Sand particle size (µm) 300-150
Impact velocity (ms-1) 2.5, 4.5, 6.5
III. RESULTS
A. Mass difference under two various environments
Figs 3 and 4 display the influence of various environments, the impact angle and the impact velocity on the mass difference of the test samples. The test samples from the seawater condition has gained weight, whereas the samples in the test slurry achieved a dramatic mass loss. All the test samples weighed within an accuracy of 10-4g. It is apparent that from the test results that intermediate impact angles have a marked more interaction with the slurry solution and the particles. This is discussed in detail under the effect of impingement angle section below.
B. SEM micro-graphs
[image:2.595.54.277.358.445.2]S-3700). The elemental analyses of the materials (EDS) have been taken using an S-3700 (Hitachi) SEM.
Fig 3. Mass difference as a function of impact angle in seawater
Fig 4. Mass difference as a function of impact angle in test slurry
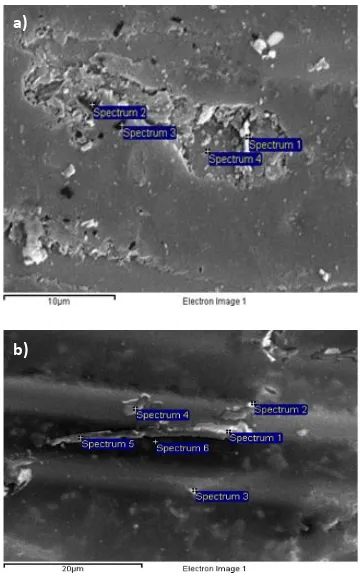
Fig 5. (a) A close image of a surface in seawater at 60°, (b) A close view of a surface in test slurry at 60°
Fig. 5 (a) clearly indicates the deposition of salt on the surface of the test sample whereas, the Fig. 5 (b) shows the initial formation of indentations/cracks. Both surfaces were
[image:3.595.342.519.203.328.2]eroded in the speed of 2.5ms-1 at 60°. This phenomenon was observed on the other samples tested in the seawater condition with different impact velocities. The impact velocity is the key factor and it heavily influences the crystal deposition on the surface. Fig. 6 justifies the above phenomenon and clearly indicates the salt crystals dried on the surface of the samples and suggersts that it increases with the impact velocity. In order to support the evidence, table 3 accounted the percentage of the salt deposited on the surface of the sample and it is noted that 5.98g of sodium and 6.84g of chloride are present on the surface. There was no indication for the presence of erosion under this condition on any of the samples.
Fig 6. SEM surface image of the eroded sample under seawater condition at 60°
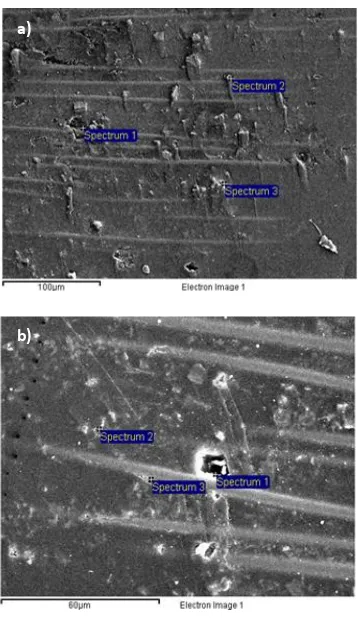
Further research to understand the solid particle erosion on the test samples was undertaken through testing at multiple impact velocities and impact angles. Fig 7 indicates the surface morphologies of the eroded samples at three different impact velocities for the fixed impact angle of 60°. On magnifying the samples, Fig 7 (a & b) clearly shows the formation of a large crater shaped cavity, and a multiple indentation marks associated with some linear scratches. These phenomena were consistent with other samples under similar conditions. Further results with different impact angles shown different mechanisms of erosion. Fig. 8 (a) shows a significant extruded region on the surface whereas, the Fig. 8 (b) shows an extended platelet formation. Fig. 9 (a) demonstrates a significant amount of lateral cracking and the presence of fragmented silica particle scattered over the eroded surface, Fig. 9 (b). The formation of a large crater is possibly associated with fiber fragmentation. Fig. 10 (a) shows the formation of fiber fracture along with some evidence of minor indentations. Fig. 10 (b) indicates platelet like morphologies with fiber fragmentation over the eroded surface.
TABLE IVEL EMENTAL ANALYSIS
Elemental analysis
Spectrum Na (%) Cl (%)
Spectrum 1 5.98 6.84
Spectrum 2 5.98 6.84
Spectrum 3 5.98 6.84
[image:3.595.75.256.362.648.2]samples at three different impact velocities for the fixed impact angle of 60°. On magnifying the samples, Fig 7 (a & b) clearly shows the formation of a large crater shaped cavity, and a multiple indentation marks associated with some linear scratches. These phenomena were consistent with other samples under similar conditions. Further results with different impact angles shown different mechanisms of erosion. Fig. 8 (a) shows a significant extruded region on the surface whereas, the Fig. 8 (b) shows an extended platelet formation. Fig. 9 (a) demonstrates a significant amount of lateral cracking and the presence of fragmented silica particle scattered over the eroded surface, Fig. 9 (b). The formation of a large crater is possibly associated with fiber fragmentation. Fig. 10 (a) shows the formation of fiber fracture along with some evidence of minor indentations. Fig. 10 (b) indicates platelet like morphologies with fiber fragmentation over the eroded surface.
IV. DISCUSSION
A. Effect of impingement angle
[image:4.595.337.519.52.196.2]Angle of impingement is usually defined as the angle between the trajectory of the solid particle and the specimen surface [9] and therefore typically the angle of attack of the blade through the water. It is a a widely studied and important parameter in the erosion study of materials [9]. Figs. 3 and 4 show mass loss as a function of impact angle for three different speeds under 2 conditions. The result shown in fig. 3 indicate that, the test samples seem to gain weight at certain angles and varies accordingly. Fig. 4 indicates that there is a significant amount of mass loss. Increases in impact velocity dramatically increases the mass loss. For example the mass loss is found to attain a peak at 4.5ms-1 (0.21g) at 60°. The change of environment has a significant impact; factors such as erodent particle, impact angle and the impact velocity increases the mass loss, this attaining a peak at intermediate impact angles [10], [11]. The reduction of the mass change at higher velocities i.e. 6.5 ms-1 may be due to frictional heating leading to a more ductile response to the erosion impacts and to the absorption of more salt on the composite at the higher velocities.
[image:4.595.339.519.232.520.2]Figure 7 - SEM surface images of eroded a) 6.5ms-1 b) 4.5ms-1 at impingement angle 60°
Fig 8. SEM surface images of eroded a) 6.5ms-1 b) 4.5ms-1 at impingement angle 45°
a)
b)
b) a)
[image:4.595.77.255.561.699.2]Fig 9. SEM surface images of eroded a) 6.5ms-1 b) 4.5ms-1 at impingement
[image:5.595.76.255.234.543.2]angle 75° and 15°
Fig 10. SEM surface images of eroded a) 6.5ms-1 b) 4.5ms-1 at impingement
angle 30 and 90°
The combined effect of the impact velocity and the impact angle of the particles is clear in the Figs. 3 and 4. Other parameters such as hardness of the erodent particle, their distribution and the exposure time should be considered. Previous studies on the behavior of GFRP materials indicate that so-called “ductile” and “brittle” erosion behaviour of the test samples is generally observed at an acute angle (15-30°) and (90°) [11], [12].
B. Morphology of the eroded surfaces
Studies on the solid particle erosion of materials clearly distinguish the difference between two erosion modes which
are often seen in the literature: brittle and ductile erosion [13]. “Ductile” erosion describes material removal due to cutting and ploughing, while “brittle” erosion involves material removal due to the formation of cracks. Generally, for polymer composite materials, with a combination of ductile matrix and brittle reinforcement, behaviour intermediate between these modes is observed in the literature, dependent on the fabrication process, the properties of the composite and the erosion footprint defined by the erosivity of the impacting particles [14], [15]. As it is shown in Fig. 11, the semi ductile erosion behaviour of GFRP was also reported by Patnaik et al. [15] in which the maximum erosion appeared at 60° at various fiber volume fractions. This indicates that achieving the maximum erosion rate in the range of 45-60° is not unexpected and the results above are consistent with such observations.
Fig. 11 Semi ductile erosion behaviour[15]
The surface morphology of eroded surfaces indicates the modes of erosive wear occurred on the surface of the test samples. Hence, scanning electron microscopy (SEM) studies are used to determine the wear mechanism at 15-90°impingement angles. Fig. 7 (a & b) show the micrographs of eroded surfaces at two different speeds (6.5 and 4.5ms-1) at fixed 60° impingement angles. It is evident from the micrograph that the material removal in the composite is dominated by the formation of a large crater shaped cavity, and multiple indentations associated with some linear scratches. A similar effect was observed in the samples tested at the 2.5ms-1 impact velocity. Fig. 8 (a & b) demonstrates the micrographs at at 45° impingement angle at 6.5ms-1 & 4.5ms1 impact velocity; the process of material removal gradually starts increasing at 45° and it reaches the peak at 60° impingement angle, whereupon the test samples experience significant erosion penetration. In order to understand the transitions at lower impact angles i.e. between the (15-30°), Fig. 10 (a) shows the formation of fiber exposure along with moderate indentation over the entire surface, with Fig. 10 (b) indicating evidence of fiber fragmentation over the eroded surfaces, with an absence of formation of deeper cracks on the composite surface. Therefore, for the conditions above, the reinforced composites exhibit a semi- ductile behaviour having the maximum erosion rate in the range of 45-60° [16].
It should be noted that the potential consequences of the b)
[image:5.595.340.519.250.376.2]surface degradation above will lead to considerable roughness of the blade surface, impacting on the tidal flow over the blade. Propogation of this roughness will induce turbulence in the flow over the blade surface resulting in detachment of the flow from the blade surface. The Cl and Cd characteristics of the blade will reduce and increase respectively, resulting in premature stalling of the blade during its range of operating conditions [17]. Hence, the blade operational performance will be compromised together with the power capture efficiency of the blade. Continued operation in these conditions will induce premature blade failure. Hence, the erosion studies above identify the possible reasons why composite materials developed to date pose limitations in service.
C. Wear mode regimes and maps
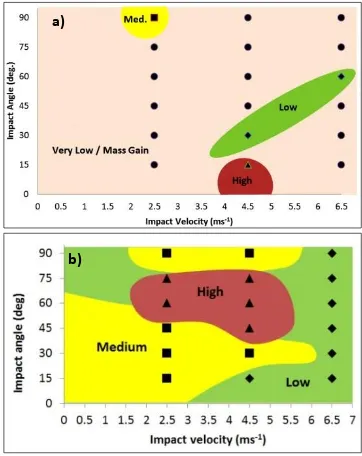
Wear maps indicate mechanistic changes on the degraded surfaces of the test samples over a range of operating conditions [18]. The construction of wear mode maps assists in understanding and identifying the mechanisms involved in the material degradation and the chemical effects involved in the surface. Wear mode maps highlight the wastage rates and indicates the potential safe operation conditions for the material chosen [19]. Fig.12 shows the wear mode maps for two different conditions. The wear modes are classified into four distinct regimes, namely (a) very low / mass gain, (b) low, (c) medium, and (d) high. The wear mode boundary limits are as below:
a) Very Low/Mass gain≤ 2.1*10-4g b) 2.1*10-4g < Low ≤ 6.3*10-4g c) 6.3*10-4g < Medium ≤ 1.47*10-3g d) 1.47*10-3g < High
[image:6.595.338.519.54.282.2]Fig. 12 (a) maps the wear mode regimes for the seawater condition only and it clearly indicates the dominance of very low mass loss / mass gain. As a result of comparison, there is almost no evidence indicating potential unsafe operating condition under seawater testing only for the limits set above, and for the experimental conditions evaluated in this study. Therefore, the combination of the very low / mass gain and low wear zones can be regarded as the safe operation zone for this material . Fig. 12 (b) shows the wear mode regimes for the slurry test condition. A very different behaviour is now observed. It is clear from the map that medium wear dominates the wear mode regime, with high wear being observed at intermediate impact angles and velocities. This indicates that in the presence of particles, very significant increases in wear can be identified over such exposure conditions, limiting the performance of the material. This wear mapping methodology for tidal turbine materials enables the optimum operating window to be identified for the exposure conditions and is a first step approach towards developing smart materials for the exposure conditions. Further work will be to include additional factors such as different distributions of erodent particles, erosion exposure time and properties of the composite to understand the important factors which change the regime transitions above.
Fig. 12 Wear mode map for test conditions (a) Seawater (b) Particles + seawater
V. CONCLUDING REMARKS
i. The combined influence of impingement angle and impact velocity on the erosive wear of the G.10 grade glass fiber-reinforced composite laminate resulted in semi-ductile erosive wear behaviour with a maximum wear at 60° impingement angle for the conditions studied.
ii. Wear mode maps were constructed to identify the minimum erosion zones in sea water conditions, with and without particles.
iii. SEM studies indicated that that erosion process for the composite was characterised by multiple cracks coupled with cavity formation and multiple indentation sites associated with linear scratches.
iv. The combination of the aqueous environment containing salt together with solid particless amplified the erosion rate in a synergistic manner, thereby increasing the depth of penetration, leading in turn to extended crack propagation on the test samples.
ACKNOWLEDGEMENTS
I would like to thank my supervisors Professor Margaret Stack and Mr Cameron Johnstone for their support and guidance. A special thanks to team TriboS (Tribology group, Strathclyde) for sharing their knowledge, work experience and also for the valuable recommendation that greatly helped me in completing this paper.
a)
REFERENCES
[1] C. M. Johnstone, D. Pratt, J. A. Clarke, and A. D. Grant, “A techno-economic analysis of tidal energy technology,” Renew. Energy, vol. 49, pp. 101–106, Jan. 2013.
[2] U. S. Tewari, a. P. Harsha, a. M. Häger, and K. Friedrich, “Solid particle erosion of carbon fibre- and glass fibre-epoxy composites,” Compos. Sci. Technol., vol. 63, no. 3–4, pp. 549–557, Feb. 2003.
[3] A. Kim and I. Kim, “Solid particle erosion of CFRP composite with different laminate orientations,” Wear, vol. 267, no. 11, pp. 1922–1926, Oct. 2009.
[4] T. Palin-Luc, R. Pérez-Mora, C. Bathias, G. Domínguez, P. C. Paris, and J. L. Arana, “Fatigue crack initiation and growth on a steel in the very high cycle regime with sea water corrosion,” Eng. Fract. Mech., vol. 77, no. 11, pp. 1953–1962, Jul. 2010.
[5] S. Wedges, H. V. Insulation, T. Boards, T. Strips, T. Spacers, P. Barriers, E. C. Insulation, C. Components, C. R. Components, P. Insulation, I. B. Spacers, P. M. Parts, W. Absorption, and T. Index, “G10 Product Data Sheet,” vol. 44, no. 0, pp. 1–2.
[6] J. B. Zu, I. M. Hutchings, and G. T. Burstein, “Design of a slurry erosion test rig,” Wear, vol. 140, no. 2, pp. 331–344, Nov. 1990.
[7] M. M. Stack and G. H. Abdulrahman, “Mapping erosion–corrosion of carbon steel in oil–water solutions: Effects of velocity and applied potential,” Wear, vol. 274–275, pp. 401–413, Jan. 2012.
[8] N. S. House and N. S. Avenue, “Commercial in confidence,” no. November, pp. 1–41, 1965.
[9] R. Rattan and J. Bijwe, “Influence of impingement angle on solid particle erosion of carbon fabric reinforced polyetherimide composite,” Wear, vol. 262, no. 5–6, pp. 568–574, Feb. 2007.
[10] H. Wensink and M. C. Elwenspoek, “A closer look at the ductile-brittle transition in solid particle erosion,” Wear, vol. 253, no. 9–10, pp. 1035–1043, Nov. 2002.
[11] A. J. Sparks and I. M. Hutchings, “Transitions in the erosive wear behaviour of a glass ceramic,” Wear, vol. 149, no. 1–2, pp. 99–110, Sep. 1991.
[12] A. Patnaik, A. Satapathy, N. Chand, N. M. Barkoula, and S. Biswas, “Solid particle erosion wear characteristics of fiber and particulate filled polymer composites: A review,” Wear, vol. 268, no. 1, pp. 249–263, Jan. 2010.
[13] I. Hutchings, “Friction and wear of ceramics,” Tribol. Int., vol. 28, no. 6, pp. 421–422, Sep. 1995.
[14] S. Arjula and a. P. Harsha, “Study of erosion efficiency of polymers and polymer composites,” Polym. Test., vol. 25, no. 2, pp. 188–196, Apr. 2006. [15] A. Patnaik, S. Biswas, R. Kaundal, and A. Satapathy, “Damage Assessment of Short Glass Fiber Reinforced Polyester Composites : A Comparative Study,” in Nanocomposites with Unique Properties nd Application in Medicine d ndustry, India, Creative common license, 2006. [16] A. W. Momber, “Effects of target material properties on solid particle erosion of geomaterials at different impingement velocities,” Wear, vol. 319, no. 1–2, pp. 69–83, Nov. 2014.
[17] D. M. Grogan, S. B. Leen, C. R. Kennedy, and C. M. Ó Brádaigh, “Design of composite tidal turbine blades,” Renew. Energy, vol. 57, pp. 151– 162, Sep. 2013.
[18] S. . Lim, “Recent developments in wear-mechanism maps,” Tribol. Int., vol. 31, no. 1–3, pp. 87–97, Jan. 1998.