Running head: An integrated model of walking in osteoarthritis
Using impairment and cognitions to predict walking in osteoarthritis: a series of n-of-1 studies with an individually-tailored, data-driven intervention
Nicola O’Brien1*, Siôn Philpott-Morgan2
and Diane Dixon
21
Institute of Health and Society, Newcastle University
2
School of Psychological Sciences and Health, University of Strathclyde
*Requests for reprints should be addressed to Nicola O’Brien, Institute of Health and Society, Baddiley-Clark Building, Newcastle University, Newcastle upon Tyne, NE2 4AX, UK
(e-mail: nicki.o’brien@ncl.ac.uk).
Acknowledgements
The authors would like to thank the participants in the study for the time and effort they gave to the project.
Statement of Contribution
What is already known on this subject?
N-of-1 methods have been used to study within-individual predictors of walking in healthy and chronic pain populations
An integrated biomedical and behavioural model of activity and activity limitations recognises the roles of impairment and psychology (cognitions)
Interventions modifying cognitions can increase physical activity in people with mobility limitations
What does this study add?
N-of-1 methods are suitable to study within-individual predictors of walking and interventions in osteoarthritis
An integrated and a psychological model are better predictors of walking in osteoarthritis than a biomedical model
There was no support for an individually-tailored, data-driven walking intervention
1 Running head: An integrated model of walking in osteoarthritis
Using impairment and cognitions to predict walking in osteoarthritis: a series of n-of-1 studies with an individually-tailored, data-driven intervention
Nicola O’Brien1*, Siôn Philpott-Morgan2
and Diane Dixon
21
Institute of Health and Society, Newcastle University
2
School of Psychological Sciences and Health, University of Strathclyde
*Requests for reprints should be addressed to Nicola O’Brien, Institute of Health and Society, Baddiley-Clark Building, Newcastle University, Newcastle upon Tyne, NE2 4AX, UK
(e-mail: nicki.o’brien@ncl.ac.uk).
Acknowledgements
The authors would like to thank the participants in the study for the time and effort they gave to the project.
2
Abstract
Objectives. This study compares the ability of an integrated model of activity and activity limitations, the International Classification of Functioning, Disability and Health (ICF), and the Theory of Planned Behaviour (TPB) to predict walking within individuals with
osteoarthritis. The effectiveness of a walking intervention in these individuals is also tested. Design. A series of n-of-1 studies with an AB intervention design.
Methods. Diary methods were used to study four community-dwelling individuals with osteoarthritis of the knee or hip. Data on impairment symptoms (pain, pain-on-movement and joint stiffness), cognitions (intention, self-efficacy and perceived controllability) and walking (pedometer step count) were collected twice-daily for 12 weeks. At six weeks, an
individually-tailored, data-driven walking intervention using action planning or a control cognition manipulation was delivered. Cross-correlations, trends and differences in mean between baseline and intervention phases were tested using simulation modelling analysis, and multiple regression analyses were conducted.
Results. Cognitions, intention in particular, were better and more consistent within-individual predictors of walking than impairment. The walking intervention did not increase walking in any of the three participants that received it. Both the integrated model and the TPB, which recognise a role for cognitions in predicting behaviour, accounted for substantially more variance in walking than the biomedical model of the ICF.
Conclusion. Despite the lack of evidence for an individually-tailored walking intervention, predictive data suggest that interventions for people with osteoarthritis that address
3 Physical inactivity is a leading cause of death and diseases, including Type II diabetes and coronary heart disease (Kohl et al., 2012; Lee et al., 2012). People with osteoarthritis have higher levels of physical inactivity and lower levels of physical activity than people without osteoarthritis (Dunlop et al., 2011; Stubbs et al., 2013), rendering them at excess risk of diseases linked to physical inactivity. Engaging in more physical activity not only reduces the risk of conditions secondary to osteoarthritis, but is also a recognised core treatment for the management of osteoarthritis, reducing pain, improving function and mobility (Centers for Disease Control and Prevention, 2010; National Institute for Health and Care Excellence, 2014).
There are evidence-based recommendations for the role of structured exercise or physical therapyin the management of osteoarthritis (Hochberg et al., 2012; Roddy et al., 2005; Zhang et al., 2010); however, these interventions are often limited by high attrition, poor adherence and a lack of evidence for effectiveness beyond the short-term (Fransen & McConnell, 2008; Fransen, McConnell, Hernandez-Molina, & Reichenbach, 2014; Jordan, Holden, Mason, & Foster, 2010). In contrast to structured exercise, interventions encouraging more habitual, moderate intensity physical activity like walking may be a promising solution to overcome the limitations to exercise as a therapy and help manage osteoarthritis and secondary diseases (Chang et al., in press; Roddy et al., 2005).
4 (ICF:(World Health Organization, 2001). The integrated model preserves the direct
relationship between impairment and activity found in the ICF, but also incorporates a role for psychology through cognitions (see Figure 1). TPB cognitions, such as intention and perceived behavioural control, act as process variables that mediate the relationship between impairment and activity. In chronic conditions where curative treatment to target impairment is unavailable, limited or costly, the role for cognitions, recognised in the integrated model, is key. Cognitions provide an opportunity to intervene to increase activity and reduce disability without the need to reduce impairment. Experimental evidence has shown that cognitions can be modified to promote physical activity and reduce activity limitations in typically sedentary individuals with chronic conditions including osteoarthritis (Fisher & Johnston, 1996; Lorig, Ritter, Laurent, & Fries, 2004).
Figure 1 about here
5 Within the field of physical activity research, n-of-1 designs have been used to predict
walking in healthy individuals (Hobbs, Dixon, Johnston, & Howie, 2013) and physical activity in people with chronic pain (Quinn, Johnston, & Johnston, 2013). In addition, the suitability of n-of-1 randomised controlled trials to test behavioural walking interventions has been explored (Sniehotta, Presseau, Hobbs, & Araujo-Soares, 2012). In pursuit of
personalised medicine, n-of-1 designs are ideal to test individualised data-driven
interventions within individuals, data from which can be used to inform the design of trials of stratified interventions (Lillie et al., 2011).
This study tests whether the integrated model is a better predictor of walking in individuals with osteoarthritis than the ICF or TPB alone. Specifically, we examined whether milder impairment (operationalised as symptomatic joint pain, joint stiffness and pain-on-movement) as set out in the ICF (Cieza et al., 2004; Dreinhofer et al., 2004) and stronger control cognitions (operationalised as perceived controllability and self-efficacy, the subcomponents of perceived behavioural control from the TPB) predicted objectively measured walking. Secondly, we test whether an individually-tailored, data-driven behavioural intervention can increase walking in these individuals.
Materials and Methods
Participants
Participants were recruited via adverts placed in local community facilities including the library, post office and church. The inclusion criterion was having knee or hip osteoarthritis that had been clinically confirmed by a health professional. Exclusion criteria were
6 inclusion and exclusion criteria and invited to take part. Four individuals (80%) accepted the invitation: participant A – male, 48 years old, knee osteoarthritis diagnosed 3 years
previously; participant B – male, 59 years old, hip osteoarthritis diagnosed 2 years previously; participant C – female, 67 years old, knee osteoarthritis diagnosed 1 year previously; participant D - female, 60 years old, knee osteoarthritis diagnosed 3 years previously. Participants were informed that they would complete a diary for 12 weeks and that at six weeks they would receive an individually-tailored intervention to help them increase their walking and improve their mobility. Participants were remunerated for their time with £50 on study completion.
Measures
Twice a day for a period of 12 weeks, participants completed a diary using a handheld personal digital assistant device (Hewlett Packard iPAQ 214). The device was programmed using the software ‘Pocket Questionnaire v1.2’ (University of Aberdeen Data Management Team 2006) and diary data were downloaded from the device using the Pocket Questionnaire software. With the exception of the objectively measures walking data, all measures were self-reported using a visual analogue scale (VAS) with scale anchors appropriate to each diary item (see below for details). Participants tapped the screen with a stylus at the
appropriate point on the VAS between the two scale anchors. A higher score indicated greater impairment, higher intention, greater self-efficacy and higher perceived controllability. The VAS was recorded by the software as a numerical value between 0-100.
7 Walking was assessed objectively by pedometer (Omron HJ-113) and participants entered their step count at each diary entry.1
Impairment
Joint pain and pain-on-movement were measured by two items: ‘How would you describe your pain right now?’ and ‘How would you describe your pain when you move right now?’, the VAS was anchored with no pain and extreme pain. Joint stiffness was assessed with one item: ‘How would you describe your joint stiffness right now?’, anchored with no stiffness
and extreme stiffness.
Theory of planned behaviour cognitions
The proximal predictors of behaviour posited by the TPB were measured by standard single items. Intention was assessed with the item: ‘To what extent do you intend to walk more than usual between now and the next time you fill in the diary?’, anchored with no intention and
definitely intend. Self-efficacy was assessed by the item: ‘How confident are you that you can
walk more than usual between now and the next time you fill in the diary?’, anchored with
not at all confident and extremely confident. Perceived controllability was measured with
‘How much do control do you have over walking more than usual between now and the next time you fill in the diary?’, anchored with no control and complete control.
Walking Intervention
The interventions were data-driven and designed to increase walking. For each participant, baseline data were analysed to identify the cognitions that were significantly correlated with walking reported at the next diary entry, approximately 12 hours later. Each participant then
1Self-reported walking, and cognitions and self-reported behaviour of an individualised non-walking behaviour
8 received an intervention using either action planning or a control cognition manipulation accordingly. For example, if intention was significantly correlated with walking, the participant received the action planning intervention; if perceived controllability was significantly correlated with walking, the participant received the perceived controllability intervention; and if self-efficacy was significantly correlated with walking, the participant received the self-efficacy intervention. When both intention and perceived controllability or both intention and self-efficacy were significantly correlated with walking, the participant received either the perceived controllability or self-efficacy intervention respectively. Delivering the intervention which targeted one of the subcomponents of perceived behavioural control maximised the opportunities for intervention success either directly impacting on behaviour or via intention (see Figure 1),
Perceived controllability or self-efficacy intervention. The content of the intervention was
based on a previously successful experimental manipulation of control beliefs (Fisher & Johnston, 1996). The following instructions were given to the participant (wording was adapted for the perceived controllability (or self-efficacy) interventions, respectively):
‘One of the things that influences whether you as individual walk is your sense of control
(confidence) over walking. The more control you believe you have (confident you feel), the
better you will succeed at walking. Please tell me about three occasions when you felt in
control of (confident about) walking. It may help you to visualize the occasions.’
Participants wrote down the descriptions to use as reminders of feeling this way.
Action planning intervention. Participants were told that one of the things that influenced
9 activity (Michie, Johnston, Cockcroft, Ellinghouse, & Gooch, 1995). Participants were asked to complete a written version of their plan and to use it as a reminder of what they planned to do.
Procedure
Participants were provided with a pedometer, a diary device and instructions on how to operate them. With the researcher, participants completed a practice diary entry to ensure comprehension. Device alarms prompted each participant to complete the diary at two agreed time points each day (approximately 12 hours apart). Participants were advised to miss the diary entry if they were not able to complete it within one hour of the original alarm. At six weeks, baseline data were downloaded from the devices and analysed. Each participant then received the data-driven intervention at home. The intervention was delivered by the
researcher and lasted between 10 and 15 minutes.
Analyses
Data for each participant were analysed separately using the open source statistical package R, v.2.15.2. Simulation modelling analysis for time series data (Borckardt et al., 2008) was used. Missing data were imputed using the package “norm” and a suitable transformation for those variables which were not normally distributed. For each variable, a number of
10 correlated nature of the data. Three tests were applied to these simulations: a test for
significant cross-correlations between variables, a test for a significant change in mean from the baseline to the intervention phase, and a test for a significant trend across the whole study period.
In addition, multiple regressions were conducted testing three different models for each participant: the TPB, the ICF and the integrated model. The aim was to see how well each of these models predicted step count at the next time point; for instance, the regression testing the ICF model included joint pain, pain-on-movement and joint stiffness at time 0 as predictors, and steps at time 1 as the response variable.
Ethics
This study was approved by the [BLINDED] Ethics Committee, which conforms to the ethical standards of the British Psychological Society.
Results
Descriptive data
Adherence to diary completion was high. The lowest rate of adherence was 89.5% (participant C) and the highest was 99.8% (participant B). The descriptive data for
impairment symptoms, cognitions and walking for each participant over the 12-week study period are shown in Table 1. Between and within-participant variability was evident in all measures.
Table 1 about here
11 Overall, cognitions served as better predictors of walking than impairment and intention was the most consistent predictor of walking (Table 2). The same pattern of association between intention and walking was observed for all four participants; stronger intention now was associated with higher step count approximately 12 hours later (i.e., at the next diary entry) whilst, in contrast, weaker intention now was associated with higher concurrent step count and higher step count approximately 24 hours later (i.e., two diary entries later).
Other variables were also predictive of walking. For participant A greater self-efficacy now predicted higher step count 12 hours later. Pain was predictive for participant B; there was a concurrent positive relationship between pain-on-movement and step count. For participant D, stiffness and self-efficacy were predictive; less stiffness predicted higher step count 24 hours later and stronger self-efficacy predicted higher step count concurrently and 24 hours later. All impairment and cognition variables were predictive for participant C, however the manner of the relationships varied. The same general relationship between each impairment symptom and walking was observed; the concurrent relationship between impairment and step count, and the relationship between impairment and step count 24 hours later were positive, i.e. worse symptoms were associated with higher step count. In contrast, worse symptoms now were associated with lower step count 12 hours later. As with intention, stronger self-efficacy now predicted higher step count 12 hours later whilst higher step count now predicted a weaker self-efficacy. In this case, stronger self-efficacy now also predicted higher step count 24 hours later. The direction of these relationships was reversed for perceived controllability which showed a negative relationship with step count 12 and 24 hours later and a positive concurrent relationship.
12
Data-driven interventions
The final row of Table 2 shows the walking intervention delivered to each participant, determined by the predictors of walking at the next diary entry evident in baseline data. For participant A, both intention and self-efficacy were significantly correlated with step count 12 hours later thus the self-efficacy intervention was delivered. Intention was significantly correlated with steps for both participant B and D so these participants received the action planning intervention. Participant B did not fully engage with the intervention, however, as he declined to make a plan. Hence, he only received feedback that his intention predicted walking and that making a plan would help him walk more. Participant C did not receive a walking intervention as she did not want to walk more than she currently did. Instead, she received an action planning intervention to increase a non-walking behaviour, data on which are not reported in this paper, and therefore intervention data for participant C are not
presented.
Predicting walking during intervention phase
As found at baseline, intention was the most consistent predictor of walking during the intervention phase (Table 3). The previous pattern of association between intention and walking was observed in the data from all three participants, weaker intention now was associated with higher concurrent step count and higher step count approximately 24 hours later whilst stronger intention now was associated with higher step count approximately 12 hours later. In addition during this phase, pain-on-movement was associated with higher concurrent step count for all participants.
13 For participants A and D, new relationships emerged during the intervention phase that were not identified at baseline. Both control cognitions were predictive of step count; however, their predictive pattern varied. For participant A, stronger perceived controllability and weaker self-efficacy now were associated with higher concurrent step count, whilst for participant D, stronger perceived controllability and weaker self-efficacy now were associated with lower step count 12 hours later. In addition, the concurrent relationship between self-efficacy and step count was positive at baseline but negative during the
intervention phase. As identified at baseline, in general, cognitions served as better predictors of walking than impairment; however, during the intervention phase pain-on-movement also served as a relatively good predictor.
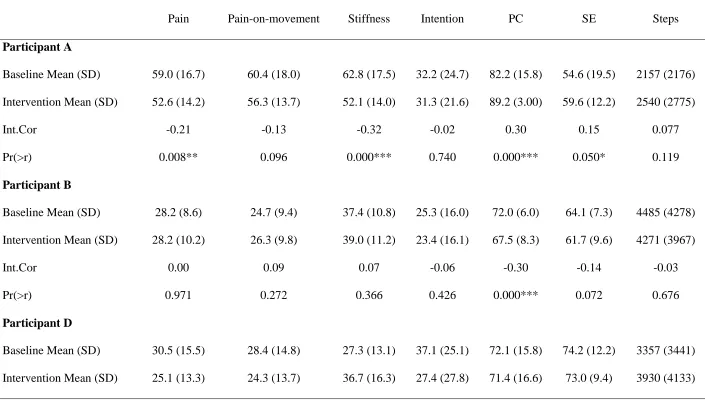
Testing the effect of the intervention on impairment, cognition and walking
Figure 2 displays the serial data for step count and either intention or self-efficacy, depending on whether the participant received an action planning or self-efficacy intervention
respectively, for each participant across the study period.
Figure 2 about here
14 cognitions were seen however, with perceived controllability decreasing for participant B and intention for participant D. Moreover, a significant decrease in joint pain was identified for participant D; yet, interestingly it was coupled with a significant increase in joint stiffness.
Table 4 about here
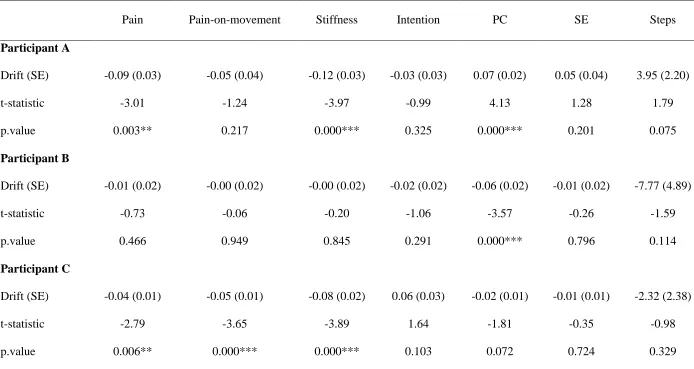
Trend analyses across the study period
Increasing or decreasing trends in each variable were explored across the study period (Table 5). For participants A and B the trends found almost exactly matched the results of the tests for significant differences in mean values between baseline and intervention phases. From week 0 to week 12, perceived controllability trended upwards whilst pain and stiffness trended downwards for participant A, and perceived controllability trended downwards for participant B. The only difference between mean difference and trend analyses was that a significant change in self-efficacy for participant A was found between baseline and
intervention phases, but there was no significant trend in self-efficacy across the whole study period. For participant D, the trend analyses identified an increase in stiffness and a decrease in intention from week 0 to week 12, which matches the pattern of mean differences
identified in these variables; however, no trend in pain was found despite the previously reported significant mean decrease in pain from baseline to intervention. For participant C, there was a decreasing trend in pain, pain-on-movement and stiffness over the study period.
Table 5 about here
The ability of the TPB, ICF and the integrated model to predict walking across the
15 The multiple regression analyses are presented in Table 6. With the exception of participant A for whom the ICF did not predict walking, each of the three models, the TPB, the ICF and the integrated model, significantly predicted walking 12 hours later in all participants. The ICF, however, accounted for the least amount of variance in walking, explaining less than a quarter of the variance that the other models explained. When compared to the TPB, the integrated model accounted for marginally more variance in walking in all participants.
Table 6 about here
Discussion
This study used an n-of-1 design to test the ability of an integrated model of activity and activity limitations to predict objectively measured walking in individuals with osteoarthritis. The effectiveness of an individually-tailored, data-driven walking intervention was also tested. Within-participant analyses were used to identify whether an individual was more likely to walk when impairment symptoms are milder and cognitions are more positive towards walking than at other times. During the intervention phase in particular, the impairment symptom of pain-on-movement was a good predictor of walking in all
participants, providing evidence for a direct relationship between impairment and activity as proposed by the ICF. In addition, the regression analyses revealed that the ICF could
significantly explain walking in three of four participants albeit only explaining between 2% and 10% of variance.
16 when a predictive relationship was identified it was more variable both within and between participants.
The direction of the significant relationships between intention or self-efficacy and walking at baseline and intervention differed depending on the temporal lag of the relationship. In all cases, stronger intention and self-efficacy now predicted more steps 12 hours later; whereas, in all but one case, at times when the individual recorded having walked more steps they also concurrently reported weaker intention and less confidence about walking within the next 12 hours. This suggests that for individuals with osteoarthritis, walking may be a finite
17 The walking intervention was ineffective for all three participants that received it. Participant A received the intervention designed to increase self-efficacy and despite a significant
increase in self-efficacy between the baseline and intervention phases no positive effects on walking were observed. Enhancing self-efficacy is a key element of many effective arthritis self-management programmes, which have demonstrated increases in physical activity, reductions in pain and the adoption of more effective pain coping strategies (Bruno, Cummins, Gaudiano, Stoos, & Blanpied, 2006; Marks, Allegrante, & Lorig, 2005). A significant decrease in joint pain from baseline to intervention was observed in this
participant suggesting that even though the intervention did not increase walking, it may have had a positive impact on pain. However, a decreasing trend in pain was observed across the entire study period, which may also explain the significant mean difference from baseline to intervention. The cause of this trend and other trends identified in participants’ data are unclear. Trends may be unrelated to the intervention and instead reflect fluctuations in
impairment symptoms or cognitions over time related to the trajectory of the health condition, environmental factors such as changes in the weather or a reaction to taking part in a study that prompted regular self-monitoring through the diary. For example, data from participant C reveal decreasing trends in all impairment symptoms, yet this participant chose not to receive the walking intervention. The inability to shed light on the reason(s) for the identified trends is a limitation of this study, which future studies should address using mixed-methods to elicit information from participants about their perceptions of changes in variables over time, either in the form of real-time noting of events in the diary or retrospectively probing in an interview at the end of the study.
18 Luszczynska, 2014); however, this conclusion is based on literature dominated by group-based design studies investigating between rather than within-individual intervention effects. The lack of effect of action planning for participant B can perhaps be explained by the fact that they refused to make a plan. Evidence from action planning studies has indicated that participants who actually make an action plan are more likely to perform the target behaviour than participants who do not (Michie, Dormandy, & Marteau, 2004; Rutter, Steadman, & Quine, 2006). Nonetheless, our exploration of the effectiveness of action planning
interventions within-individuals is original and therefore, before drawing conclusions about why the intervention was ineffective in the current study, the finding first needs to be replicated.
The current findings show that the TPB and the integrated models were able to explain
considerably more variance in walking than the ICF. Findings from the chronic pain literature are in line with this. Dixon et al (2012) similarly found the TPB to be a better predictor of walking than the ICF in a group-based study and Quinn et al (2013) found that the TPB better predicted activity measured by accelerometry than the ICF in an n-of-1 study. Specifically, in the current study, the ICF explained less than 10% of the variance in walking in each
19 or other of the cognitions. Future work is needed to explore potentially mediating
relationships.
A strength of this study was the use of an objective measure of walking. The variance in objectively measured walking explained by the TPB in the participants in this study is greater than has been reported previously in TPB studies of objectively measured physical activity (McEachan, Conner, Taylor, & Lawton, 2011). However, the dominance of group-based studies of the TPB in the literature, on which previous findings are primarily based, means that there is a lack of data on the predictive ability of the TPB at the within-individual level from which to compare. However, the n-of-1 study by Quinn et al (2013) did report that 32% of the variance in activity could be explained by the TPB in one of the studied participants. A potential limitation of the current study is the use of single item measures of the TPB variables, which may be less sensitive reducing statistical power. Single items were used to reduce participant burden and the likelihood of poor study compliance. In comparison to multiple item measures, which are more commonly used in TPB studies, single item measures may contain more measurement error making them susceptible to attenuation effects. However, if more measurement error did exist in the single items used then this would mean that the identified relationships were in fact underestimated.
21
References
Ajzen, I. (1991). The theory of planned behavior. Organizational Behavior and Human
Decision Processes, 50, 179-211.
Baker, M. K., Atlantis, E., & Fiatarone Singh, M. A. (2007). Multi-modal exercise programs for older adults. Age and Ageing, 36(4), 375-381. doi: 10.1093/ageing/afm054 Bandura, A. (1977). Self-efficacy: toward a unifying theory of behavioral change.
Psychological Review, 84(2), 191-215.
Borckardt, J. J., Nash, M. R., Murphy, M. D., Moore, M., Shaw, D., & O'Neil, P. (2008). Clinical practice as natural laboratory for psychotherapy research: A guide to case-based time-series analysis. American Psychologist, 63, 77-95. doi: 10.1037/0003-066X.63.2.77
Bruno, M., Cummins, S., Gaudiano, L., Stoos, J., & Blanpied, P. (2006). Effectiveness of two Arthritis Foundation programs: Walk With Ease, and YOU Can Break the Pain Cycle.
Clinical Interventions in Aging, 1(3), 295-306.
Centers for Disease Control and Prevention, Arthritis Foundation. (2010). A national public health agenda for osteoarthritis. Retrieved 25/06/2014 from
http://www.cdc.gov/arthritis/docs/oaagenda.pdf
Chang, R. W., Semanik, P. A., Lee, J., Feinglass, J., Ehrlich-Jones, L., & Dunlop, D. D. (in press). Improving physical activity in arthritis clinical trial (IMPAACT): Study design, rationale, recruitment, and baseline data. Contemporary Clinical Trials. doi: 10.1016/j.cct.2014.08.010
Cieza, A., Ewert, T., Ustun, T. B., Chatterji, S., Kostanjsek, N., & Stucki, A. (2004). Development of ICF core sets for patients with chronic conditions. Journal of
22 Craig, P., Dieppe, P., Macintyre, S., Michie, S., Nazareth, I., & Petticrew, M. (2008).
Developing and evaluating complex interventions: new guidance. Retrieved 02/02/2009 from www.mrc.ac.uk/complexinterventionsguidance
Curran, P. J., & Bauer, D. J. (2011). The disaggregation of within-person and between-person effects in longitudinal models of change. Annual Review of Psychology, 62(1), 583-619. doi: 10.1146/annurev.psych.093008.100356
Dixon, D., Johnston, M., Elliott, A., & Hannaford, P. (2012). Testing integrated behavioural and biomedical models of activity and activity limitations in a population-based sample. Disability and Rehabilitation, 34(14), 1157-1166. doi:
10.3109/09638288.2011.635749
Dixon, D., Johnston, M., Rowley, D. I., & Pollard, B. (2008). Using the ICF and psychological models of behavior to predict mobility limitations. Rehabilitation
Psychology, 53(2), 191-200.
Dreinhofer, K., Stucki, G., Ewert, T., Huber, E., Ebenbichler, G., Gutenbrunner, C., . . . Cieza, A. (2004). ICF core sets for osteoarthritis. Journal of Rehabilitation Medicine, 36(S44), 75-80.
Dunlop, D. D., Song, J., Semanik, P. A., Chang, R. W., Sharma, L., Bathon, J. M., . . . Hootman, J. M. (2011). Objective physical activity measurement in the osteoarthritis initiative: Are guidelines being met? Arthritis & Rheumatism, 63(11), 3372-3382. doi: 10.1002/art.30562
Fisher, K., & Johnston, M. (1996). Experimental manipulation of perceived control and its effect on disability. Psychology & Health, 11, 657-669.
Fransen, M., & McConnell, S. (2008). Exercise for osteoarthritis of the knee. Cochrane
Database of Systematic Reviews(4), Cd004376. doi:
23 Fransen, M., McConnell, S., Hernandez-Molina, G., & Reichenbach, S. (2014). Exercise for
osteoarthritis of the hip. Cochrane Database of Systematic Reviews(4), Cd007912. doi: 10.1002/14651858.CD007912.pub2
Gorczynski, P. (2012). The use of single-case experimental research to examine physical activity, exercise, and physical fitness interventions: a review. Journal of Applied
Sport Psychology, 25(1), 148-156. doi: 10.1080/10413200.2012.664606
Hagger, M. S., & Luszczynska, A. (2014). Implementation intention and action planning interventions in health contexts: state of the research and proposals for the way forward. Applied Psychology: Health and Well-Being, 6(1), 1-47. doi:
10.1111/aphw.12017
Hobbs, N., Dixon, D., Johnston, M., & Howie, K. (2013). Can the theory of planned behaviour predict the physical activity behaviour of individuals? Psychology &
Health, 28(3), 234-249. doi: 10.1080/08870446.2012.716838
Hochberg, M. C., Altman, R. D., April, K. T., Benkhalti, M., Guyatt, G., McGowan, J., . . . Tugwell, P. (2012). American College of Rheumatology 2012 recommendations for the use of nonpharmacologic and pharmacologic therapies in osteoarthritis of the hand, hip, and knee. Arthritis Care & Research, 64(4), 465-474. doi:
10.1002/acr.21596
Johnston, D. W., & Johnston, M. (2013). Useful theories should apply to individuals. British
Journal of Health Psychology, 18(3), 469-473. doi: 10.1111/bjhp.12049
Johnston, M., Bonetti, D., Pollard, B., Backman, L., & Hofston, C. V. (2002). Disability as behaviour: models of measurement and explanation Psychology at the turn of the
24 Johnston, M., & Dixon, D. (2013). Developing an integrated biomedical and behavioural
theory of functioning and disability: adding models of behaviour to the ICF
framework. Health Psychology Review, 1-23. doi: 10.1080/17437199.2013.855592 Jordan, J. L., Holden, M. A., Mason, E. E., & Foster, N. E. (2010). Interventions to improve
adherence to exercise for chronic musculoskeletal pain in adults. Cochrane Database
of Systematic Reviews(1), Cd005956. doi: 10.1002/14651858.CD005956.pub2
Keysor, J. J., & Brembs, A. (2011). Exercise: necessary but not sufficient for improving function and preventing disability? Current Opinion in Rheumatology, 23(2), 211-218. doi: 10.1097/BOR.0b013e3283432c41
Kohl, H. W., Craig, C. L., Lambert, E. V., Inoue, S., Alkandari, J. R., Leetongin, G., & Kahlmeier, S. (2012). The pandemic of physical inactivity: global action for public health. The Lancet, 380(9838), 294-305. doi: 10.1016/S0140-6736(12)60898-8 Lee, I. M., Shiroma, E. J., Lobelo, F., Puska, P., Blair, S. N., & Katzmarzyk, P. T. (2012).
Effect of physical inactivity on major non-communicable diseases worldwide: an analysis of burden of disease and life expectancy. The Lancet, 380(9838), 219-229. doi: 10.1016/S0140-6736(12)61031-9
Lillie, E. O., Patay, B., Diamant, J., Issell, B., Topol, E. J., & Schork, N. J. (2011). The n-of-1 clinical trial: the ultimate strategy for individualizing medicine? Personalized
Medicine, 8(2), 161-173. doi: 10.2217/pme.11.7
Lorig, K. R., Ritter, P. L., Laurent, D. D., & Fries, J. F. (2004). Long-term randomized controlled trials of tailored-print and small-group arthritis self-management interventions. Medical Care, 42(4), 346-354.
Marks, R., Allegrante, J. P., & Lorig, K. (2005). A Review and Synthesis of Research
25 Implications for Health Education Practice (Part I). Health Promotion Practice, 6(1), 37-43. doi: 10.1177/1524839904266790
McEachan, R. R. C., Conner, M., Taylor, N. J., & Lawton, R. J. (2011). Prospective prediction of health-related behaviours with the Theory of Planned Behaviour: a meta-analysis. Health Psychology Review, 5(2), 97-144. doi:
10.1080/17437199.2010.521684
Michie, S., Dormandy, E., & Marteau, T. M. (2004). Increasing screening uptake amongst those intending to be screened: the use of action plans. Patient Education and
Counseling, 55, 218-222.
Michie, S., Johnston, M., Cockcroft, A., Ellinghouse, C., & Gooch, C. (1995). Methods and impact of health screening for hospital staff. Journal of Organizational Behavior, 16(1), 85-92. doi: 10.1002/job.4030160110
National Institute for Health and Care Excellence. (2014). Osteoarthritis: Care and
management in adults. London, UK: NICE.
Quinn, F., Johnston, M., Dixon, D., Johnston, D. W., Pollard, B., & Rowley, D. I. (2012). Testing the integration of ICF and behavioral models of disability in orthopedic patients: Replication and extension. Rehabilitation Psychology, 57(2), 167-177. doi: 10.1037/a0028083
Quinn, F., Johnston, M., & Johnston, D. W. (2013). Testing an integrated behavioural and biomedical model of disability in N-of-1 studies with chronic pain. Psychology &
Health, 28(12), 1391-1406. doi: 10.1080/08870446.2013.814773
26 Rutter, D. R., Steadman, L., & Quine, L. (2006). An implementation intentions intervention
to increase uptake of mammography. Annals of Behavioral Medicine, 32(2), 127-134. Schroder, C., Johnston, M., Teunissen, L., Notermans, N., Helders, P., & van Meeteren, N.
(2007). Perceived control is a concurrent predictor of activity limitations in patients with chronic idiopathic axonal polyneuropathy. Archives of Physical Medicine and
Rehabilitation, 88(1), 63-69.
Sniehotta, F. F., Presseau, J., Hobbs, N., & Araujo-Soares, V. (2012). Testing self-regulation interventions to increase walking using factorial randomized N-of-1 trials. Health
Psychology, 31(6), 733-737. doi: 10.1037/a0027337
Sniehotta, F. F., Scholz, U., & Schwarzer, R. (2006). Action plans and coping plans for physical exercise: a longitudinal intervention study in cardiac rehabilitation. British
Journal of Health Psychology, 11, 23-37.
Sniehotta, F. F., Schwarzer, R., Scholz, U., & Schuz, B. (2005). Action planning and coping planning for long-term lifestyle change: theory and assessment. European Review of
Social Psychology, 35, 565-576.
Stubbs, B., Binnekade, T. T., Soundy, A., Schofield, P., Huijnen, I. P., & Eggermont, L. H. (2013). Are older adults with chronic musculoskeletal pain less active than older adults without pain? A systematic review and meta-analysis. Pain Medicine, 14(9), 1316-1331. doi: 10.1111/pme.12154
Thomas, S., Reading, J., & Shephard, R. J. (1992). Revision of the Physical Activity Readiness Questionnaire (PAR-Q). Canadian Journal of Sport Science, 17(4), 338-345.
27 Vancouver, J. B., Thompson, C. M., & Williams, A. A. (2001). The changing signs in the
relationship among self-efficacy, personal goals, and performance. Journal of Applied
Psychology, 86(4), 605-620.
World Health Organization. (2001). WHO International Classification of Functioning,
Disability and Health: ICF. Geneva, Switzerland: World Health Organization.
28 Table 1. Descriptive statistics for impairment, cognitions and walking (steps) for each participant across the 12-week study period.
Pain Pain-on-movement
Stiffness Intention PC SE Steps
Participant A (n=169)
Mean (SD) 55.8 (16.6) 57.9 (16.6) 57.2 (16.6) 31.9 (23.1) 85.6 (11.9) 57.1 (16.3) 2349 (2498)
AR(1) 0.31 0.44 0.36 -0.35 0.00 0.34 -0.42
AR(2) 0.00 0.00 0.00 0.31 0.00 0.00 0.43
Participant B (n=168)
Mean (SD) 28.2 (9.4) 25.5 (9.6) 37.2 (10.9) 24.2 (16.1) 69.9 (7.8) 62.8 (8.7) 4369 (4103)
AR(1) 0.32 0.29 0.20 -0.34 0.38 0.41 -0.35
AR(2) 0.00 0.00 0.00 0.00 0.00 0.00 0.33
Participant C (n=179)
Mean (SD) 32.1 (9.7) 34.0 (9.9) 46.0 (14.6) 39.8 (31.6) 94.9 (6.0) 38.0 (14.9) 1741 (1900)
AR(1) 0.00 0.00 0.00 -0.07 0.00 -0.37 -0.29
29
AR(3)1 0.00 0.00 0.00 -0.28 0.00 0.00 0.00
Participant D (n=161)
Mean (SD) 27.4 (14.5) 26.2 (14.3) 32.3 (15.7) 31.6 (27.0) 71.6 (16.1) 73.5 (10.7) 3664 (3825)
AR(1) 0.37 0.34 0.33 -0.23 0.00 0.35 -0.57
AR(2) 0.00 0.00 0.00 0.45 0.00 0.00 0.00
Impairments and cognitions were measured on VAS from 1-100; a higher score = worse impairment and stronger cognitions. Walking was measured objectively by pedometer. Mean number of steps = mean number at each diary entry; doubling this value provides an estimate of the mean number of steps per day.
PC = Perceived Controllability; SE = Self-Efficacy; Steps = pedometer step count; AR(1) = first order autoregressive term; AR(2) = second order autoregressive term; AR(3) = third order autoregressive term
1
30 Table 2. Lagged cross-correlations between impairment and cognitions, and walking (steps) during the baseline phase (0-6 weeks), accounting for serial correlation
Participant A Participant B Participant C Participant D
Variable CCF -2 CCF -1 CCF 0 CCF -2 CCF -1 CCF 0 CCF -2 CCF -1 CCF 0 CCF -2 CCF -1 CCF 0
Lagged cross-correlation with step count
Pain -0.06 -0.04 0.13 -0.05 -0.02 0.02 0.23* -0.26* 0.27** -0.12 0.08 -0.07
Pain-on-movement 0.02 -0.04 0.14 -0.03 -0.04 0.22* 0.41*** -0.39*** 0.48*** -0.08 -0.03 -0.07 Stiffness -0.18 0.15 -0.13 -0.15 0.18 0.06 0.48*** -0.40*** 0.51*** -0.23* 0.09 -0.18 Intention -0.62*** 0.84*** -0.68*** -0.46*** 0.71*** -0.40*** -0.65*** 0.75*** -0.69*** -0.59*** 0.79*** -.58**
PC -0.05 -0.11 0.17 -0.08 0.14 -0.17 -0.55*** -0.38*** 0.29** 0.21 -0.12 0.10
SE 0.13 0.27* -0.18 0.05 -0.05 -0.12 0.27* 0.69*** -0.67*** 0.26* -0.04 0.25*
Intervention SE Action Planning None Action Planning
32 Table 3. Lagged cross-correlations between impairment and cognitions, and walking (steps) during the intervention phase (6-12 weeks),
accounting for serial correlation
Participant A Participant B Participant D
Variable CCF -2 CCF -1 CCF 0 CCF -2 CCF -1 CCF 0 CCF -2 CCF -1 CCF 0
Lagged cross-correlation with step count
Pain 0.16 -0.16 0.20 0.01 -0.03 0.10 -0.11 -0.04 0.16
Pain-on-movement 0.13 -0.10 0.24* 0.16 -0.11 0.25* -0.11 -0.12 0.23*
Stiffness 0.13 0.11 0.15 -0.01 0.11 0.01 -0.15 -0.02 0.19
Intention -0.56** 0.81*** -0.59** -0.40*** 0.70*** -0.47*** -0.50*** 0.69*** -0.52***
PC -0.16 0.13 0.24* 0.10 0.16 -0.20 -0.02 -0.21* 0.12
SE -0.14 0.27* -0.27* -0.10 -0.05 -0.03 0.19 0.22* -0.21*
Participant C did not receive a walking intervention so intervention data are not reported.
33 Table 4. Tests for significant difference in mean values of variables between baseline and intervention phases, accounting for serial correlation
Pain Pain-on-movement Stiffness Intention PC SE Steps
Participant A
Baseline Mean (SD) 59.0 (16.7) 60.4 (18.0) 62.8 (17.5) 32.2 (24.7) 82.2 (15.8) 54.6 (19.5) 2157 (2176) Intervention Mean (SD) 52.6 (14.2) 56.3 (13.7) 52.1 (14.0) 31.3 (21.6) 89.2 (3.00) 59.6 (12.2) 2540 (2775)
Int.Cor -0.21 -0.13 -0.32 -0.02 0.30 0.15 0.077
Pr(>r) 0.008** 0.096 0.000*** 0.740 0.000*** 0.050* 0.119
Participant B
Baseline Mean (SD) 28.2 (8.6) 24.7 (9.4) 37.4 (10.8) 25.3 (16.0) 72.0 (6.0) 64.1 (7.3) 4485 (4278) Intervention Mean (SD) 28.2 (10.2) 26.3 (9.8) 39.0 (11.2) 23.4 (16.1) 67.5 (8.3) 61.7 (9.6) 4271 (3967)
Int.Cor 0.00 0.09 0.07 -0.06 -0.30 -0.14 -0.03
Pr(>r) 0.971 0.272 0.366 0.426 0.000*** 0.072 0.676
Participant D
34
Int.Cor -0.19 -0.14 0.30 -0.18 -0.02 -0.06 0.08
Pr(>r) 0.020* 0.069 0.000*** 0.028* 0.779 0.479 0.350
Participant C did not receive a walking intervention so intervention data are not reported.
35 Table 5. Tests for significant trend in variables across the whole study period (0-12 weeks), accounting for serial correlation
Pain Pain-on-movement Stiffness Intention PC SE Steps
Participant A
Drift (SE) -0.09 (0.03) -0.05 (0.04) -0.12 (0.03) -0.03 (0.03) 0.07 (0.02) 0.05 (0.04) 3.95 (2.20)
t-statistic -3.01 -1.24 -3.97 -0.99 4.13 1.28 1.79
p.value 0.003** 0.217 0.000*** 0.325 0.000*** 0.201 0.075
Participant B
Drift (SE) -0.01 (0.02) -0.00 (0.02) -0.00 (0.02) -0.02 (0.02) -0.06 (0.02) -0.01 (0.02) -7.77 (4.89)
t-statistic -0.73 -0.06 -0.20 -1.06 -3.57 -0.26 -1.59
p.value 0.466 0.949 0.845 0.291 0.000*** 0.796 0.114
Participant C
Drift (SE) -0.04 (0.01) -0.05 (0.01) -0.08 (0.02) 0.06 (0.03) -0.02 (0.01) -0.01 (0.01) -2.32 (2.38)
t-statistic -2.79 -3.65 -3.89 1.64 -1.81 -0.35 -0.98
p.value 0.006** 0.000*** 0.000*** 0.103 0.072 0.724 0.329
36 Drift (SE) -0.05 (0.03) -0.04 (0.03) 0.10 (0.03) -0.10 (0.04) -0.01 (0.03) -0.01 (0.03) 4.58 (3.36)
t-statistic -1.32 -1.29 2.97 -2.51 -0.41 -0.35 1.36
p.value 0.189 0.199 0.003** 0.013* 0.685 0.723 0.175
PC = Perceived Controllability; SE = Self-Efficacy; Steps = pedometer step count; Drift = slope of fitted line after accounting for serial correlation; p.value= probability of this slope arising by chance for a time series with the observed autocorrelation profile.
37 Table 6. Multiple regression analyses comparing the ability of the integrated model, ICF and TPB to predict walking (steps) at the next diary entry
Integrated ICF TPB
Participant A
R2 0.656 0.022 0.650
F-statistic (DF) 51.19 (6,161) 1.21 (3,164) 101.6 (3,164)
p.value 0.000*** 0.309 0.000***
Participant B
R2 0.567 0.054 0.541
F-statistic (DF) 34.9 (6,160) 3.10 (3,163) 64.11 (3,163)
p.value 0.000*** 0.028* 0.000***
Participant C
R2 0.464 0.102 0.462
F-statistic (DF) 24.63 (6,171) 6.59 (3,174) 49.87 (3,174)
p.value 0.000*** 0.000*** 0.000***
Participant D
R2 0.535 0.066 0.478
F-statistic (DF) 29.35 (6,153) 3.65 (3,156) 47.68 (3,156)
p.value 0.000*** 0.014* 0.000***
Testing TPB: single case studies
38 Figure captions
Figure 1: The integrated model: the Theory of Planned Behaviour integrated into the International Classification of Functioning, Disability and Health
Testing TPB: single case studies
39 Attitude
Subjective Norm
Perceived Behavioural
Control
Intention Activity
Testing TPB: single case studies
40
0 50 100 150
0 20 40 60 80 100
Participant A Self-Efficacy
Diary entry
VAS
0 25 50 75 100 125 150 175
baseline intervention
0 50 100 150
0
2000
4000
6000
8000
Participant A Measured Steps
Diary entry P e d o m e te r re a d in g
0 25 50 75 100 125 150 175
baseline intervention
0 50 100 150
0 20 40 60 80 100
Participant A Self-Report Walking
Diary entry
VAS
0 25 50 75 100 125 150 175
baseline intervention
0 50 100 150
0 20 40 60 80 100
Participant B Intention
Diary entry
VAS
0 25 50 75 100 125 150
baseline intervention
0 50 100 150
0
5000
10000
15000
20000
Participant B Measured Steps
Diary entry P e d o m e te r re a d in g
0 25 50 75 100 125 150
0
5000
10000
15000
20000 baseline intervention
0 50 100 150
0 20 40 60 80 100
Participant B Self-Report Walking
Diary entry
VAS
0 25 50 75 100 125 150
baseline intervention
0 50 100 150
0 20 40 60 80 100
Participant D Intention
Diary entry
VAS
0 25 50 75 100 125 150
baseline intervention
0 50 100 150
0
5000
10000
15000
Participant D Measured Steps
Diary entry P e d o m e te r re a d in g
0 25 50 75 100 125 150
baseline intervention
0 50 100 150
0 20 40 60 80 100
Participant D Self-Report Walking
Diary entry
VAS
0 25 50 75 100 125 150