Waste Management & Research ISSN 0734–242X
Life cycle modelling of environmental impacts of
application of processed organic municipal solid
waste on agricultural land (EASEWASTE)
A model capable of quantifying the potential environmental impacts of agricultural application of composted or anaerobi-cally digested source-separated organic municipal solid waste (MSW) is presented. In addition to the direct impacts, the model accounts for savings by avoiding the production and use of commercial fertilizers. The model is part of a larger model, Environmental Assessment of Solid Waste Systems and Technology (EASEWASTE), developed as a decision-support model, focusing on assessment of alternative waste management options. The environmental impacts of the land application of processed organic waste are quantified by emis-sion coefficients referring to the composition of the processed waste and related to specific crop rotation as well as soil type. The model contains several default parameters based on liter-ature data, field experiments and modelling by the agro-eco-system model, Daisy. All data can be modified by the user allowing application of the model to other situations. A case study including four scenarios was performed to illustrate the use of the model. One tonne of nitrogen in composted and anaerobically digested MSW was applied as fertilizer to loamy and sandy soil at a plant farm in western Denmark. Applica-tion of the processed organic waste mainly affected the envi-ronmental impact categories global warming (0.4–0.7 PE), acidification (–0.06 (saving)–1.6 PE), nutrient enrichment (–1.0 (saving)–3.1 PE), and toxicity. The main contributors to these categories were nitrous oxide formation (global warm-ing), ammonia volatilization (acidification and nutrient enrich-ment), nitrate losses (nutrient enrichment and groundwater contamination), and heavy metal input to soil (toxicity poten-tials). The local agricultural conditions as well as the compo-sition of the processed MSW showed large influence on the environmental impacts. A range of benefits, mainly related to improved soil quality from long-term application of the processed organic waste, could not be generally quantified with respect to the chosen life cycle assessment impact
cate-gories and were therefore not included in the model. These effects should be considered in conjunction with the results of the life cycle assessment.
Trine Lund Hansen
Gurbakhash S. Bhander
Thomas Højlund Christensen
Institute of Environment & Resources, Technical University of Denmark, Lyngby, Denmark
Sander Bruun
Lars Stoumann Jensen
Plant and Soil Science Laboratory, Department of Agricultural Sciences, Royal Veterinary and Agricultural University, Thorvaldsensvej 40, DK–1871 Frederiksberg C, Denmark
Keywords: Environmental assessment, waste management, life cycle assessment, organic waste, land application, soil, wmr 858–1
Corresponding author: Thomas H. Christensen, Institute of Environment & Resources, Technical University of Denmark, Building 115, DK–2800 Lyngby, Denmark.
Tel: +45 4525 1600; fax: +45 4593 2850; e-mail: thc@er.dtu.dk
DOI: 10.1177/0734242X06063053
Received 11 April 2005; accepted in revised form 20 November 2005
Archived
at
Introduction
The organic fraction of municipal solid waste (MSW) derives mainly from agricultural products. Waste treatment options allowing recycling of the content of organic matter and nutri-ents to agricultural land might be a method for closing the cycle between city and agriculture and simultaneously reduce the production and use of commercial fertilizers. A sufficient quality of organic MSW for recycling to agriculture can usu-ally be obtained only by separate collection of the organic waste at the source, followed by biological treatment (i.e. com-posting or anaerobic digestion). The processed organic waste differs from commercial fertilizers with respect to nutrient availability and content of contaminants. This may affect nutri-ent losses to the atmosphere, surface and groundwater, heavy metal contamination of soils and carbon sequestration (tem-porary or permanent binding of carbon in the soil). The govern-ing factors are organic waste composition, climate, soil type and agricultural practice. Thus, the environmental impacts of the land application of processed organic waste are the result of many complex and interacting processes that largely depend on local conditions.
For evaluation of different waste management options it is important to quantify and assess the potential environmental impacts of using processed organic waste on agricultural land, including any environmental benefits from a reduction in the production and use of commercial fertilizer. For this purpose, the principles from life cycle assessment (LCA) are applicable. Basically, LCA accounts for all uses of resources and all emissions from the system accumulated through the system’s ‘lifetime’. In addition, LCA aggregates all the infor-mation into defined impact categories, which furthermore can be normalized into person-equivalents (PE; one average persons contribution to the impact category per year) mak-ing the results more understandable for the user (Wenzel et al. 1997).
This paper presents a model using LCA principles for assessing the environmental impacts of application of proc-essed organic waste to agricultural land. The model consti-tutes a sub-model in the general waste management model EASEWASTE (Kirkeby et al. 2006).
Modelling of environmental impacts
of waste systems
EASEWASTE (Environmental Assessment of Solid Waste Systems and Technologies) is a life-cycle-based model devel-oped at the Technical University of Denmark for environmen-tal assessment of waste systems. The model offers a detailed inventory of the waste management system and uses the EDIP life-cycle-assessment method, originally developed for
environmental assessment of industrial products (Wenzel et al. 1997). The model considers environmental impacts of waste generation, collection, treatment, recovery and disposal, including upstream as well as downstream activities, by com-piling impacts of each part of the system (Kirkeby et al.
2006). Emissions to air, surface water, ground water and soil as well as resource consumptions are considered with respect to their contribution to defined environmental impact cate-gories: global warming, stratospheric ozone depletion, photo-chemical ozone formation, acidification, nutrient enrichment, persistent toxicity, ecotoxicity, human toxicity and resource consumption; identical to the categories used in the EDIP method (Wenzel et al. 1997). Furthermore, emissions to groundwater will be included. The calculated impacts of each category are compared with the impacts of society as a whole; for example, the global warming potential from the system is compared with the total yearly emission of global warming gases to air. This comparison is called normalization and the normalization references used (total environmental load divided by the population) might be local, regional or global references. Normalized results have the unit of PE, as defined above. Furthermore, the results might be weighted according to political targets. The applied normalization and weighting methods are further described in Wenzel et al. (1997) and Stranddorf et al. (2005). Table 1 presents the normalization references applied in the case study.
Modelling of environmental impacts of land
application of processed organic MSW
The EASEWASTE land application model
The land application model in EASEWASTE deals with agri-cultural application of residues from composting or anaerobic digestion of organic MSW. The model was intended to be simple and flexible, but respecting key processes of environ-mental importance. The included parameters are shown in Figure 1. Default values are provided for relevant parameters reflecting typical Danish conditions, but the parameters are all adjustable, thus allowing for modelling of a variety of agri-cultural systems if the necessary data are available.
Organic MSW recycled to agricultural land constitutes only a smaller fraction (a few percent) of the amount of nutrients
[image:3.595.36.537.65.254.2]used in Danish agriculture in terms of manure and commercial fertilizers (Eilersen et al. 1998). Thus, a likely scenario is that processed organic waste will be applied to a specific field occa-sionally and practically managed, in respect of the existing crop rotation, as a commodity together with commercial fertilizers, animal manure and other organic wastes (e.g. sewage sludge). Since mineralization of the organic MSW extends beyond a single growing season, the environmental impact assessment of a single organic waste application must consider the effects also in the following years. Estimating key processes, for exam-ple accumulated leaching of nitrate over a longer time period, is thus very complicated and requires the use of advanced mod-els beyond the capability of waste management modmod-els. Table 1: Normalization references from Stranddorf et al. (2005).
Environmental impact category Unit
Global warming1 kg CO
2eq./person year 8700
Ozone depletion1 kg CFC11 eq./person year 0.103
Photochemical ozone formation2 kg C
2H4eq./person year 20
Acidification2 kg SO
2eq./person year 101
Nutrient enrichment2 kg NO
3eq./person year 260
Pollution of groundwater2 m3groundwater/person year Under development
Human toxicity to water2 m3water/person year 1.79×10⁵
Human toxicity to air2 m3air/person year 5.56×10¹⁰
Human toxicity to soil2 m3soil/person year 157
Ecotoxicity to water, chronic2 m3water/person year 7.91×10⁵
Ecotoxicity to water, acute2 m3water/person year 7.40×10⁴
Ecotoxicity to soil2 m3soil/person year 6.56×10⁵
[image:3.595.35.537.500.738.2]1Global reference. 2Danish reference.
The agro-ecosystem model Daisy has been used to esti-mate default data for the land application module. Daisy is a relatively complex model describing the water, heat, C and N dynamics in the soil–plant–atmosphere system (Hansen
et al. 1991). The model is based on state-of-the-art soil phys-ics and biochemistry, and different parts of the model have been validated and compared with other models in a number of different studies (de Willigen 1991; Diekkrüger et al. 1995 and Bruun et al. 2003). Daisy was used to estimate emissions of nitrogen through leaching to groundwater and drainage to surface waters as well as air emissions of ammonia, nitrous oxide and carbon dioxide to air after application of composted or anaerobically digested MSW under different environmen-tal and management regimes (Bruun et al. 2005). The appli-cations of composted or anaerobically digested MSW was simulated for three different farm types (plant, pig and dairy farms) on two soil types (loam and sand) and in two different climatic zones in Denmark (eastern and western Denmark, characterized by difference in precipitation). The fertilization schemes in the constructed scenarios followed the Danish legislation and normal agricultural practice. The scenarios (42 in total) and the obtained results are described further in Bruun et al. (2005).
The emission coefficients calculated from these results were used as default values for the EASTEWASTE land applica-tion model. As the default parameters are based on the Daisy simulations they are primarily suitable for simulating impacts under conditions similar to Danish conditions. However, the model structure is general and the model can be used for dif-ferent conditions if appropriate data are available.
Nutrient losses
Each agricultural field is a complex system characterized by local conditions such as climatic conditions, soil type, nutrient content in the soil, yearly sequence of crops, crop management as well as fertilizer type, composition, amount and application method; many of which are affected by farming practice and legal regulations. To determine the effects from application of the processed organic waste, two scenarios must be modelled: A reference scenario, as it would be without application of the organic waste, and an organic scenario, in which the organic waste substitutes commercial fertilizer according to agricultural practice and legal regu-lations. All emissions are determined for both scenarios accumulated over a specified time frame (in most cases until no additional emissions are found in the scenarios with application of processed MSW). In EASEWASTE the dif-ferences in emissions are expressed as emission coefficients determined as the accumulated difference in nutrient loss between the two scenarios divided by the nutrient amount
applied with the processed organic waste. Thus, the emis-sion coefficient quantifies the extra emisemis-sion originating from the use of processed organic waste in place of commer-cial fertilizers:
where k is the emission coefficient; EX,W is the accumulated
emission of X in the scenario with waste application; EX,R is
the accumulated emission of X in the reference scenario; and
SX is the amount of X applied to the waste
The nutrients may be lost to the environment through volatilization (NH3), denitrification (N2 and N2O), run-off to
surface waters (NO3 –
) or leaching to ground water (NO3 –
). The chemical form of the nutrients is important for the envi-ronmental impact. Nutrients in processed organic waste are partly bound in organic matter and therefore only partly avail-able to the plants. This decreases the immediate risk of loss, but as the organic matter is degraded, the nutrients are released and if not taken up by plants, they may be lost. In contrast, commercial fertilizer consists mainly of mineral nutrients, which are readily available for the plants in large amounts for a relatively short period of time. This increases the immediate risk of loss, but enables the farmer to optimize the fertilization with respect to amount and timing with plant demands, pos-sibly reducing the nutrient loss.
One application of organic matter will affect the soil system for several years due to slow release of nutrients and carbon from the organic matter. The emission coefficients in the model should cover the total loss of nutrients from this single application, and thus cover the time period from application until no more emissions can be related to the application.
Emissions of nutrients are strongly dependent on the applied amounts of nutrients. At low application, the marginal loss will be small due to a high plant uptake. Conversely, at high appli-cation, the marginal plant uptake is very small and the losses will thus be relatively large. Therefore, linearity cannot be assumed and the emission coefficients are valid only at stand-ard fertilization levels (reasonably close to the farmer’s eco-nomic optimum) and under the circumstances defined in the scenarios.
Leaching of nitrate to groundwater
Nitrate leaching is defined as nitrogen leaving the plant-rooting zone (in the Daisy simulations, 3 m), thus no longer being available to the crops. The magnitude of nitrate leach-ing depends strongly on local conditions; in the model the emission coefficient for leaching is quantified as follows:
k EX,W–EX,R SX
---=
where is the nitrate leached to groundwater (kg nitrogen); is the emission coefficient (kg N lost/kg Ntot); and Ntot is the total nitrogen in the waste (kg).
Nitrate leached from the root zone may enter the ground-water, contributing to a decreased quality of water potentially discharging to surface water or being extracted for drinking water or irrigation.
The default emission coefficients for nitrate leaching to groundwater implemented in the model are based on the described Daisy simulations. Values in the range of 0.03–0.87 were obtained; meaning that between 3 and 87% of the applied nitrogen is leached from the soil, the highest values deriving from sandy soils but with no clear difference between waste types. Large differences between farm types are partly caused by the impacts of redistribution of the different available types of fertilizers (manure, commercial fertilizers and other organic fertilizers) at the specific farms, reflecting the dependency upon the local conditions (Bruun et al. 2005).
Nitrate loss to surface water
Quantification of run-off of nitrate to surface waters is even more site specific than leaching to groundwater. Factors affect-ing the magnitude of run-off are soil type, natural and artificial drainage, precipitation, crop rotation, the slope of the field, the position of the nearest stream and whether a ‘safety bar-rier’ of non-cultivated land surrounds the field (the three last factors are very difficult to quantify and were not included in the simulations of default data for EASEWASTE in Daisy).
The emission coefficients for nitrate loss to surface waters in EASEWASTE are quantified as follows:
where is the nitrate to surface water (kg nitrogen); is the emission coefficient (kg N lost/kg Ntot);
and Ntot is the total nitrogen in the waste (kg).
Nitrate run-off to surface waters contributes to the envi-ronmental impact category ‘nutrient enrichment’ affecting surface waters.
The default emission coefficients in the land application model are based on Daisy simulations, which considered losses from direct surface run-off and through artificial drains. No direct surface run-off was found, so the emission coefficients describe drainage losses only. For loamy soil 4–30% of the applied nitrogen was lost through drains, although there were no losses from sandy soils, since these usually are not drained (Bruun et al. 2005).
Volatilization of ammonia
Volatilization of ammonia from spreading of fertilizers depends on spreading methods, weather conditions, pH in the soil and
fertilizer and the chemical form of the nitrogen applied. Numer-ous field experiments have been done to determine the gov-erning factors. In Denmark, comprehensive registration of spreading methods, field measurements and modelling of the resulting ammonia emissions to air from application of differ-ent types of manure and commercial fertilizers have been per-formed. Ammonia losses of 2–30% of the applied nitrogen were found depending on annual season, time of incorpora-tion and type of fertilizer (Hutchings et al. 2001). Emission coefficients from solid manure were found to be lower than that from the equivalent slurry.
Only the fraction of nitrogen present in the processed organic waste as ammonia can volatilize directly. In the land application model the ammonia volatilization is therefore cal-culated as a fraction of the added ammonia-nitrogen:
where is the loss of ammonia to air (kg nitrogen); is the ammonia fraction of total nitrogen; is the emission coefficient (fraction of ammonia nitrogen); and
Ntot is the total nitrogen in the waste.
Since the emission is based on the ammonia content, appli-cation of anaerobically digested MSW will lead to in relatively higher ammonia volatilization than composted MSW.
Volatilization of ammonia contributes to the environmental impact category ‘nutrient enrichment’ due to its nitrogen con-tent as well as to ‘acidification’ due to bacterial oxidization of ammonia (through nitrite) to nitrate releasing hydrogen ions (Hauschild & Wenzel 1998).
The default volatilization coefficients for ammonia in processed organic waste are for most scenarios modelled as 15% of the applied ammonia (Bruun et al. 2005). No signifi-cant emission of ammonia to air from commercial fertilizer is assumed.
Formation of nitrous oxide
Nitrous oxide is a byproduct from the nitrification and deni-trification processes, which strongly depend on the redox conditions in the soil. The rate of nitrous oxide formation is often high at interfaces between aerobic and anaerobic areas. The nitrous oxide emission to air in the model is determined as a fraction of the total nitrogen applied:
where is the nitrous oxide to air (kg nitrogen); is the emission coefficient (fraction of total nitro-gen); and Ntot is the total nitrogen in the waste (kg).
Nitrous oxide contributes strongly to the environmental impact category ‘global warming’.
LNO3–N( )gw
kNO3–N( )gw
LNO3–N( )sw = kNO3–N( )sw ⋅Ntot
LNO3–N( )sw
kNO3–N( )sw
LNH3–N = XNH4⋅kNH3⋅Ntot
LNH3–N
XNH4 kNH3
LN2O–N = kN2O–N⋅Ntot
LN2O–N
The loss of nitrous oxide from the system was determined for each scenario by the Daisy simulations (Bruun et al. 2005). The emission coefficients for nitrous oxide were found to be in the interval of 0.013–0.022.
Phosphorus losses
Phosphorus losses to groundwater and surface waters depend mainly on existing soil conditions (the history of phosphorus fertilization, soil type, redox conditions and numerous other factors) and less on the actual application of phosphorus fertilizers (Andersen et al. 2005). Therefore, these effects are not quantified in the model and do not contribute to the impact categories nutrient enrichment or pollution of ground-water.
Substitution of commercial fertilizers
The processed organic waste is assumed to substitute for com-mercial fertilizers, which will be the realistic case for marginal substitution in Denmark. Substitution of nitrogen, phosphorus and potassium are included in the model structure, whereas other nutrients (e.g. Ca, Mg, Cu and S) can be added by the user.
The environmental impacts of fertilizer substitution are calculated separately for N, P and K fertilizers to simplify the calculations and the procedure of updating data or adding new fertilizer types. In reality mixed mineral fertilizer types are often used in agriculture; however, this simplified calcu-lation procedure is assumed not to influence the results deci-sively (Audsley et al. 1997).
The reduction in use of commercial fertilizer is determined from the content of nutrients in the processed organic waste and their mineral fertilizer equivalent (MFE) value (plant-availability of organic waste compared to plant (plant-availability of commercial fertilizers).
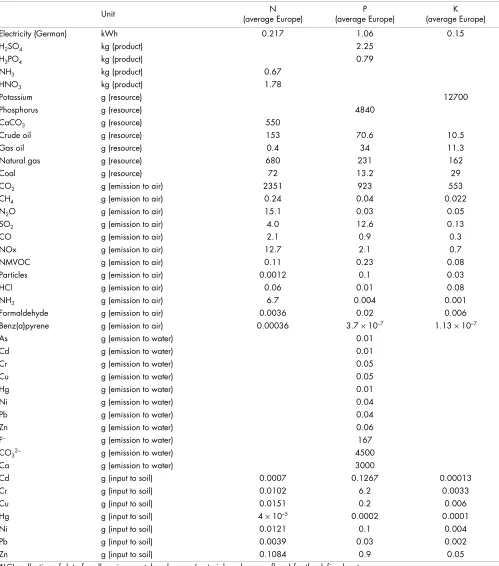
The model contains data for process emissions, resource consumption (raw material use in production) and heavy metal content of nitrogen, phosphorus and potassium fertilizers based on Audsley et al. (1997), Patyk & Reinhardt (1997) and Davis & Haglund (1999). These data are examples of fertilizer pro-duction in Denmark, Holland, England and Germany. Fur-ther fertilizer types can be added to the database. Table 2 shows an example of the environmental loads (LCIs) from production of commercial fertilizers (average European pro-duction of N, P and K).
Utilization of nitrogen
In composted MSW most of the nitrogen is bound to organic matter and is thus not readily available to plants. Compre-hensive field experiments in Denmark have determined the MFE values for nitrogen in composted MSW used for
agri-cultural purposes (Bundgaard et al. 1993, Nielsen 1994). Up to 30% of the nitrogen spread was found to be actually sub-stituting commercial fertilizer during the first 2 years. Thereaf-ter, no measurable nutritional effect was seen. The 30% MFE value does not distinguish between different agricultural sys-tems or different soil types.
No Danish field experiments have investigated the utiliza-tion of nitrogen in anaerobically digested MSW spread on agri-cultural soil. Bundgaard et al. (1993) assume that 60–100% of the nitrogen in liquid anaerobically digested MSW consists of ammonia and therefore is readily available to the plants. Thus, the fraction of nitrogen in anaerobically digested MSW possibly substituting commercial fertilizers might be as high as 80% (representing the interval 60–100%).
In Denmark registration of all nitrogen application to field crops is mandatory for farmers and nitrogen fertilization norms are specified for each specific crop on specific soil types. Legal regulations specify the minimum MFE values for composted and anaerobically digested MSW to be 20 and 40%, respec-tively, meaning that the farmer needs only to account for 20 or 40% of the nitrogen content in the processed organic waste when calculating the required reduction in use of com-mercial nitrogen fertilizers (Plantedirektoratet 2003). These law-enforced MFE values for nitrogen are significantly lower than the actual utilization ratios showed by experiments, in which 30 and 80% of the nitrogen in composted and anaero-bically digested MSW, respectively was found to replace com-mercial fertilizers. With the current practice, application of organic fertilizers is therefore likely to increase the nitrogen losses to the environment, because the total amount of nitro-gen available to the plants is increased.
Utilization of phosphorus and potassium
the actual MFE value for phosphorus and potassium should be determined according to the local agricultural conditions.
Organic pollutants and heavy metals
Processed organic MSW may contain numerous organic pol-lutants. In the model, four organic pollutants are included:
[image:7.595.38.537.74.640.2]di-ethyl-hexyl-phthalate (DEHP), nonylphenol ethoxylates (NPE), linear alkylbenzene sulfonate (LAS) and polyaro-matic hydrocarbons (sum of 11 different PAHs). These com-pounds are identical to the indicator comcom-pounds chosen by the Danish EPA to assess the pollution state of processed organic waste for land application. However, organic pollut-ants may degrade in the soil given the right conditions. A Table 2: Example of life cycle inventory (LCI)* for production of 1 kg commercial fertilizers (N, P or K) mainly based on Patyk & Reinhardt (1997). Input to soil are based on Audsley et al. (1997).
Unit N
(average Europe)
P (average Europe)
K (average Europe)
Electricity (German) kWh 0.217 1.06 0.15
H2SO4 kg (product) 2.25
H3PO4 kg (product) 0.79
NH3 kg (product) 0.67
HNO3 kg (product) 1.78
Potassium g (resource) 12700
Phosphorus g (resource) 4840
CaCO3 g (resource) 550
Crude oil g (resource) 153 70.6 10.5
Gas oil g (resource) 0.4 34 11.3
Natural gas g (resource) 680 231 162
Coal g (resource) 72 13.2 29
CO2 g (emission to air) 2351 923 553
CH4 g (emission to air) 0.24 0.04 0.022
N2O g (emission to air) 15.1 0.03 0.05
SO2 g (emission to air) 4.0 12.6 0.13
CO g (emission to air) 2.1 0.9 0.3
NOx g (emission to air) 12.7 2.1 0.7
NMVOC g (emission to air) 0.11 0.23 0.08
Particles g (emission to air) 0.0012 0.1 0.03
HCl g (emission to air) 0.06 0.01 0.08
NH3 g (emission to air) 6.7 0.004 0.001
Formaldehyde g (emission to air) 0.0036 0.02 0.006
Benz(a)pyrene g (emission to air) 0.00036 3.7×10⁻⁷ 1.13×10⁻⁷
As g (emission to water) 0.01
Cd g (emission to water) 0.01
Cr g (emission to water) 0.05
Cu g (emission to water) 0.05
Hg g (emission to water) 0.01
Ni g (emission to water) 0.04
Pb g (emission to water) 0.04
Zn g (emission to water) 0.06
F– g (emission to water) 167
CO32– g (emission to water) 4500
Ca g (emission to water) 3000
Cd g (input to soil) 0.0007 0.1267 0.00013
Cr g (input to soil) 0.0102 6.2 0.0033
Cu g (input to soil) 0.0151 0.2 0.006
Hg g (input to soil) 4×10⁻⁵ 0.0002 0.0001
Ni g (input to soil) 0.0121 0.1 0.004
Pb g (input to soil) 0.0039 0.03 0.002
Zn g (input to soil) 0.1084 0.9 0.05
Danish 3-year experiment has shown that use of processed organic waste (wastewater treatment sludge, composted source separated organic MSW and pig manure) did not increase the amount of LAS, NP, DEHP or PAHs in the soil after 3 years of supplying three times the maximally allowed concentra-tion (Henriksen & Jacobsen 2002). The experiments showed that LAS, NP and DEHP degraded to very low concentra-tions during 6–12 months. As default the land application of these organic pollutants does therefore not contribute to the environmental impacts, assuming that the load is within cur-rent regulations.
Processed organic MSW has a certain heavy metal con-tent, as does the commercial fertilizer substituted by the proc-essed organic waste. The difference in input of heavy metals to soil from substitution of commercial fertilizers is included in the model.
An increased level of heavy metals and organic pollutants in agricultural soil has a potential toxic impact on humans and ecosystems. Thus, the input of these substances to soil from use of either organic or commercial fertilizers influences the environmental impact as ecotoxicity and human toxicity as defined in the EDIP system (Hauschild & Wenzel 1998). Quantification of the ecotoxicological impact from a com-pound is based on the final distribution between air, surface water, ground water and soil, and the toxicity of the com-pound as defined in laboratory experiments. The ecotoxicity is quantified as the amount of air, water or soil necessary to dilute the compound to a concentration that will not affect living organisms. Since most compounds will migrate in the environment, emissions to one compartment might result in ecotoxicological impacts in air, water and soil. To define the human toxicity it is furthermore necessary to define the exposure routes for human intake of the compound. Direct exposure routes are inhalation of air or intake of water or soil. Indirect exposure routes are intake of the pollutant via crops, meat, fish or dairy products. The exposure routes and human intake is based on numerous physical and chemical characteristics as well as average values for human intake of water and different types of food. The methods for determin-ing the toxicological impacts as well as impact factors for several compounds can be found in Hauschild & Wenzel (1998).
Carbon sequestration
Degradation of organic matter results in release of carbon dioxide, which is a global warming gas. However, carbon dioxide from degraded fresh organic matter is considered neutral with respect to the global warming impact, because the plants have recently removed an equal amount of carbon dioxide from the atmosphere during growth. Non-degraded
organic matter stored in the soil thus represents a ‘saved’ emis-sion of carbon dioxide (carbon sequestration).
Experiments have shown that the equilibrium concentra-tion of carbon in soil depends on soil type, climate and yearly supply of organic matter. A change in agricultural practice might change the equilibrium concentration of carbon in the soil. In the transitory state the amount of carbon in the soil will change contributing (positively or negatively) to global warming. It is assumed that it requires a steady supply of organic matter to maintain an increased concentration of organic matter in the soil due to a steady and slow release of the bound carbon.
When quantifying nutrient losses from one application of organic waste the goal was to determine the total effect of the application meaning that the yearly effects were accu-mulated until no more (siaccu-mulated) effects could be related to the application. Applying the same principle to carbon sequestration, the effect of delayed carbon release will be zero, since each carbon atom will eventually be released. In the impact assessment, release of 1 kg of CO2 has a certain
defined impact in the atmosphere during its lifetime (120 years in the EDIP method) not depending on the time of release. Therefore, temporary binding of carbon will not affect the global warming impact in the EDIP method. How-ever, if the application is considered to contribute to a permanent increase of the carbon level in the soil due to changed agricultural practice, it will represent an actual decrease in CO2 release thereby contributing (by a saving)
to the global warming impact. In EASEWASTE it is possi-ble to include carbon sequestration as a percentage of the applied carbon in the waste being permanently bound in the soil:
Cbinding=kC-binding·Ctot
where kC-binding is the carbon-binding coefficient (fraction of
total C); and Ctot is the total carbon in the waste (kg).
Impacts which are not included
The land application model does not include all possible impacts of application of processed organic waste. Improved soil quality (including improved workability, drainage capac-ity, water retention capacity and biological activity) due to increased organic carbon content in the soil could not be generally quantified with respect to the chosen output cate-gories and are therefore not accounted for.
The spreading of pathogens is not included in the model, since the law-enforced (Danish/European law) heat treatment of composted or anaerobically digested MSW originating from organic MSW is assumed to reduce the pathogens in the waste sufficiently.
Experiments have indicated that use of compost might increase the health of crops through resistance towards cer-tain diseases, especially in horticulture. However, this impact is too specific to be modelled as a general parameter as it may vary from light disease-causing to heavy disease-suppressing depending on the combination of crop type, growth media and specific disease (Hoitink & Fahy 1986, Litterick et al. 2004, Noble & Coventry 2005).
The manner in which the model is constructed is such that the phosphorus and potassium in the treated organic MSW do not contribute to any identified environmental impacts. The only impacts of these compounds in the waste are therefore the impacts of savings in production of com-mercial fertilizers.
Alternative applications
This version of the land application model (in EASEWASTE 2006) includes only application in agriculture. Future ver-sions of the model might include other applications such as use in gardens, parks, golf courses, football fields, landscaping or organic farming. This will change the conditions for envi-ronmental exchanges/emissions and might involve substitu-tion of different products affecting the saved externalities.
Case study
Four scenarios were constructed to illustrate results from the model and their dependency on local conditions and input waste composition. The four scenarios considered the appli-cation of 1 tonne of nitrogen in composted or anaerobically digested MSW on loamy or sandy soil at a plant farm in west-ern Denmark. Further description of the scenarios can be found in Bruun et al. (2005).
One tonne of nitrogen was chosen as common functional unit, since nitrogen is considered the most valuable of the com-pounds in the processed organic waste in Danish agriculture.
Comparison of 1 tonne of dry matter or wet weight waste would have yielded large differences in the environmental impacts due to different nitrogen content in composted and anaerobi-cally digested MSW. Inclusion of both composted and anaer-obically digested MSW illustrate the importance of the com-position of the processed waste. Similarly, two different soil types were included, because the emissions of nutrients largely depend on the soil type. The application was modelled for a plant farm, since this is the most likely routing of processed organic MSW in Denmark. Very few animal farmers will be interested in processed organic waste due to the Danish legis-lation limiting application of organic nitrogen (maximum 170 kg organic N ha–1year–1) and demanding animal farmers to utilize the manure produced on the farm as fertilizer on the fields within the year of production (Plantedirektoratet 2003). Therefore, the following scenarios were performed:
1. anaerobically digested MSW applied to loamy soil; 2. anaerobically digested MSW applied to sandy soil; 3. composted MSW applied to loamy soil; and 4. composted MSW applied to sandy soil.
The applied processed organic waste was assumed to sub-stitute commercial fertilizers.
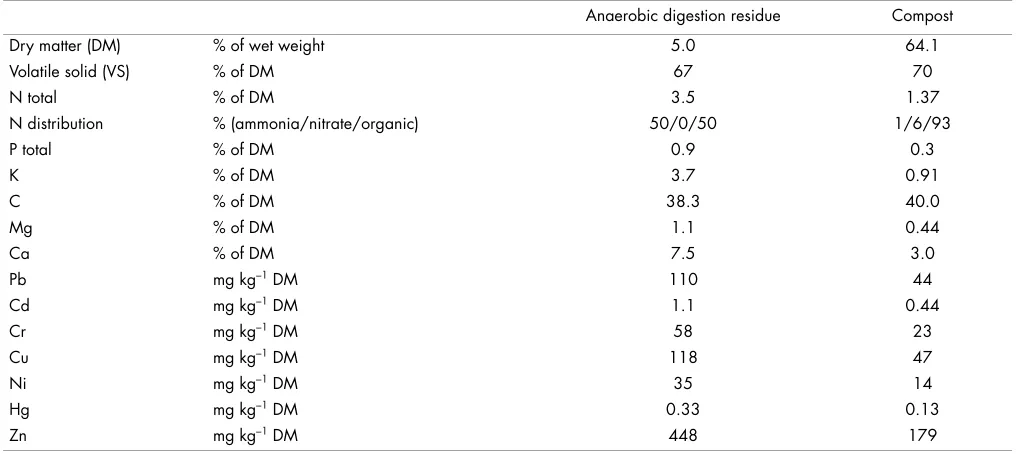
Case study: input condition
Table 3shows the composition of the processed organic waste. The chemical composition of the anaerobically digested MSW (except heavy metals) is based on chemical analyses of digestion residues from anaerobic pilot-scale digestion of source separated organic MSW (Christensen et al. 2003). The heavy metal content in the processed organic waste was estimated from data for composted source-separated organic MSW in Landes et al. (2003) assuming 50 and 80% dry matter reduction in the composting and anaerobic digestion process, respec-tively based on experiments performed by Eklind & Kirch-mann (2000) and Hansen et al. (2006b). The composition of the composted MSW is based on Landes et al. (2003).
Table 4 shows the input parameter values for the model. The nitrogen composition was based on Christensen et al.
(2003) for anaerobically digested MSW and on Kirchmann (1985) for composted MSW. The mineral fertilizer equiva-lent (MFE) values for nitrogen reflects the Danish legislation (Plantedirektoratet 2003), and the emission coefficients are based on the performed simulations of specific Danish sce-narios with the Daisy model (Bruun et al. 2005). The min-eral fertilizer equivalents (MFE) for phosphorus and potas-sium were set to 100% in the case study.
deter-mined for scenario (1) assuming permanent binding of the carbon left in the soil after 10, 50, 100 years and infinite time, respectively (calculation based on Bruun et al. (2005)). Case study: results and discussion
Figure 2 shows the environmental impact potentials from the four scenarios in the case study for the environmental impact categories global warming, acidification, nutrient enrichment, groundwater pollution and resource consumption (primary energy and phosphorus reserve). Impact potentials for
strat-ospheric ozone depletion and chemical ozone formation are not shown, as the contributions to these categories from the system were small.
[image:10.595.55.563.65.292.2]The contributions to global warming were comparable for the four scenarios. The main contributor was nitrous oxide; a global-warming gas contributing about 310 times as much to global warming as carbon dioxide (on weight-basis) (Hauschild & Wenzel 1998). Contributions from energy saved by avoided nitrogen fertilizer production were of the same magnitude (savings from application of anaerobically digested MSW being Table 3: Composition of treated organic waste in the case study based on Christensen et al. (2003) and Landes et al. (2003).
Anaerobic digestion residue Compost
Dry matter (DM) % of wet weight 5.0 64.1
Volatile solid (VS) % of DM 67 70
N total % of DM 3.5 1.37
N distribution % (ammonia/nitrate/organic) 50/0/50 1/6/93
P total % of DM 0.9 0.3
K % of DM 3.7 0.91
C % of DM 38.3 40.0
Mg % of DM 1.1 0.44
Ca % of DM 7.5 3.0
Pb mg kg–1DM 110 44
Cd mg kg–1DM 1.1 0.44
Cr mg kg–1DM 58 23
Cu mg kg–1DM 118 47
Ni mg kg–1DM 35 14
Hg mg kg–1DM 0.33 0.13
[image:10.595.63.561.346.590.2]Zn mg kg–1DM 448 179
Table 4: Input data for the soil application model in EASEWASTE for the four presented scenarios: Anaerobic digestion residue and compost applied on loamy and sandy soil on a plant farm in western Denmark. The emission coefficients are based on simulations of the actual scenarios in Daisy. The phosphorus dose and the utilization ratios for nitrogen are set according to the Danish law.
Anaerobic digestion residue Compost
Units Loam Sand Loam Sand
Ammonia % of total N 50 50 1 1
Nitrate % of total N 0 0 6 6
Organic N % of total N 50 50 93 93
Ammonia evaporation Fraction of ammonia N 0.15 0.15 0.15 0.15
Nitrous oxide (N2O-N)
evaporation
Fraction of nitrogen applied with the treated organic waste
0.014 0.016 0.014 0.015
C binding Infinite/100 years
Fraction of C applied with the treated organic waste
0/0.14 0/0.10 0/0.14 0/0.09
Nitrate run off
(NO3–-N) to surface water
Fraction of nitrogen applied with the treated organic waste
0.19 0 0.08 0
Nitrate leaching (NO3–-N) to
groundwater
Fraction of nitrogen applied with the treated organic waste
0.18 0.60 0.07 0.53
MFE* value N Fraction of applied nutrient substituting commercial fertilizer
0.4 0.4 0.2 0.2
MFE* value P Fraction of applied nutrient substituting commercial fertilizer
1 1 1 1
MFE* value K Fraction of applied nutrient substituting commercial fertilizer
1 1 1 1
twice the savings from application of composted MSW due to a larger MFE value for anaerobically digested MSW). Energy savings from avoided production of phosphorus and potassium fertilizers were negligible under the given circumstances. Car-bon sequestration was not included in the standard scenarios, since the carbon binding was considered a temporary effect. Including the carbon sequestration will reduce the global warming impact or even result in a total negative contribu-tion (saving) within this impact category. Figure 3 shows the global warming impact from scenario (1) considering that the carbon applied with the treated waste left in the soil after 10, 50, 100 years and infinite time, respectively, is a permanent
contribution to the soil carbon. As can be seen from this fig-ure, the assumptions considering the temporary/permanent nature of the sequestered carbon is crucial for the magnitude of the global warming impact potential of the system. In LCA context the infinite or 100 years time horizon will be com-mon approaches.
[image:11.595.47.529.53.546.2]posted MSW applied to loamy soil) showed the second largest contribution. For scenario two this was mainly due to ammo-nia volatilization (due to high ammoammo-nia content), while the effect from scenario three originated from surface run-off of nitrate. The saving from substituted phosphorus fertilizer was caused by avoided phosphorus emissions to water from pro-duction of commercial phosphorus fertilizers.
The only significant emission to groundwater from the described scenario derived from nitrate leaching. Therefore, the contributions depended only on the estimated emission coefficients for leaching, which were significantly higher for sandy soils than for loamy soils.
Acidification was mainly caused by ammonia volatilization in the described scenarios. Since anaerobically digested MSW contains significantly more ammonia than composted MSW (in this case 50 and 1% of the applied nitrogen, respectively), scenario one and two (application of anaerobically digested MSW) showed the largest contributions to acidification.
The resource consumption of the system is described only by primary energy and phosphorus consumption to simplify the illustration of the results. However, the case study results included many more resource consumption categories, such as coal, oil and potassium. For both composted and anaerobi-cally digested MSW the largest saving of primary energy derived from avoided production of substituted commercial fertilizers, while the main consumption was fuels used for spreading of organic fertilizers. Spreading of 1 tonne of nitrogen as anaerobically digested MSW costs significantly more energy than spreading of 1 tonne of nitrogen as composted MSW due to the difference in dry matter content (5 and 64%, respec-tively). Therefore, the energy consumption for spreading was significantly higher for anaerobically digested MSW. Due to differences in the MFE values for nitrogen in anaerobically digested MSW and composted MSW (40 and 20%,
respec-tively) the savings from substitution of commercial nitrogen fertilizer varied between the two waste types. The differences in savings from substitution of phosphorus and potassium fer-tilizers derived from different content of these nutrients in comparison with the nitrogen content in the two waste types. The saving of phosphorus resource was derived from substitu-tion of commercial phosphorus fertilizers.
The toxicity impacts (not shown) were quantified as human toxicity to air, water and soil as well as ecotoxicity to water (chronic and acute) and soil. The main contributions to these categories from the described scenarios were heavy metal input to soil and water. Nitrous oxide also contributes to toxicity (human toxicity, air). After normalization, the toxicity impact categories are grouped in three categories: persistent toxicity (average of normalized contributions from ecotoxicity to water (chronic), ecotoxicity to soil, human toxicity to water and human toxicity to soil); ecotoxicity (ecotoxicity to water (acute)); and human toxicity (human toxicity to air).
[image:12.595.319.558.49.248.2]Figure 4 shows the normalized contributions to the different environmental impact potential categories from the described scenarios. Only the emissions to groundwater are not included, since no normalization reference has been developed yet for this environmental impact potential category. The similar figure for normalized resource consumptions is not shown since the environmental impacts were considered the most controversial to quantify. Figure 4 shows all normalized impacts expressed in PE. The impacts of application of 1 tonne of nitro-gen in the described systems were of the magnitude of one to four person-equivalents (the yearly contribution one to four people to the environmental load). The large contributions from persistent toxicity derive from human toxicity to soil (mainly caused by input of mercury and other heavy metals to Fig. 3: Global warming potentials for scenario 1 (anaerobic digestion
[image:12.595.59.301.55.214.2]residue applied to loamy soil) assuming permanent binding of the carbon left in the soil after 10, 50, 100 years and infinite time, respectively.
soil). The impact potentials for toxicity in the model are very sensitive to the amounts of heavy metal emitted (due to very high impact factors). As the heavy metal content of the proc-essed organic waste and commercial fertilizers vary signifi-cantly between references, the resulting impact potentials for toxicity are quite uncertain.
The relatively low MFE values for processed organic waste used in the scenarios reflect the Danish legal regulations where a maximum nitrogen load is defined for each farm. This nitro-gen load can be distributed between different fertilizer types meaning that if the organic nitrogen application increases, the commercial fertilizer application must be decreased according to the MFE values defined. Since the allowed nitrogen load is defined below the economical optimum for the farmers (to avoid loss of nitrogen to the environment) most farmers will apply all the allowed nitrogen. Change in the MFE values will affect both the emission coefficients and the substitution of commercial fertilizers. As legal regulations in addition to natural/agricultural conditions and farming practice differ greatly between countries, simulations of local conditions with an approach similar to Bruun et al. (2005) may be relevant prior to modelling environmental impacts of land application of processed organic waste under conditions that are signifi-cantly different from Danish conditions.
The amount of processed organic waste spread on agricul-tural soil in the described scenarios (1 tonne of nitrogen) orig-inates from approximately 130 tonnes of organic waste, which is equivalent to the generation of organic waste from around 1800 people [assuming 3% nitrogen (% of dry matter), 25% dry matter, 3 kg organic waste generated per household per week and 2.1 person per household]. All the normalized impact potentials from land application of the waste were below 4 PE, meaning that these 1800 people generating the waste will ‘use’ 0.2% of their total pollution ‘quota’ (within each cate-gory) by land application of their processed organic waste.
Conclusions
The proposed land application model offers a quantitative and consistent approach for environmental assessment of land application of processed organic MSW. The model is a
simple model based on relatively few parameters, but includ-ing quantification of most relevant effects. Guidelines for LCA in the waste management sector developed for Nordic countries, recommend the inclusion of substitution of com-mercial fertilizers, impacts of transport and spreading as well as emissions of toxic compounds when assessing land applica-tion of processed organic waste (Fridriksson et al. 2002). Com-pared to these guidelines, the described land application model is very detailed, since it fulfills the recommendations and fur-thermore includes nutrient emissions and possibly carbon sequestration. Guidelines for LCA within agriculture devel-oped for the European Commission also include recommen-dations for assessment of land application of organic and com-mercial fertilizers (Audsley et al. 1997). These guidelines are developed for full LCAs for agricultural systems and not spe-cifically for waste management systems, thus being somewhat more detailed. However, all parameters mentioned in these guidelines are included in the described model, even though the quantification is not necessarily performed as suggested by Audsley et al. (1997).
Effects related to improved soil quality due to increased organic carbon in the soil could not be quantified with respect to the included LCA impact categories. These effects are there-fore not directly included in the model, but must be assessed independently along with the results of the LCA.
The structure of the land application model is general and applies to most agricultural conditions if sufficient input data are provided through experiments, external simulations or lit-erature. However, all default data described in this paper are based on Danish conditions.
The case study showed strong influence from local agri-cultural conditions and composition of the processed organic waste on the resulting environmental impact potentials. Assuming Danish conditions for waste generation and com-position the simulated land application of processed organic waste constitutes around 0.2% of a citizen’s average (Danish) environmental load.
Due to the large variations no general conclusions for envi-ronmental assessment of land application of processed organic waste can be drawn; serious environmental assessment requires case-specific estimation of the environmental impacts.
References
Andersen, J.M., Boutrup, S., Svendsen, L.M., Bøgestrand, J., Granth, R., Jensen, J.P., Ellermann, T., Rasmussen, M.B.,; Jørgensen, L.F. & Lau-ersen, K.D. (2005) Aquatic Environment 2003. State and trends – techni-cal summary. NERI Technitechni-cal Report 500, National Environmental Research Institute, Denmark.
Audsley, E., Alber, S., Clift, R., Cowell, S., Crettaz, P., Gaillard, G., Hausheer, J., Jolliet, O., Kleijn, R., Mortensen, B., Pearce, D., Roger, E., Teulon, H., Weidema, B. & Zeijts, H.v. (1997) Harmonization of Environmental Life Cycle Assessment for Agriculture, AIR3-CT94-2028. Community
Research and Technological Development Programme in the Field of ‘Agriculture and Agro-Industry, including Fisheries’ AIR 3, European Commission DG VI Agriculture, Brussels.
Bruun, S., Christensen, B.T., Hansen, E.M., Magid, J. & Jensen, L.S. (2003) Calibration and validation of the soil organic matter dynamics of the Daisy model with data from the Askov long-term experiments. Soil Biology and Biochemistry, 35, 67–76.
source-separated municipal solid waste on agricultural land. Journal of Envi-ronmental Quality, in press.
Bundgaard, S., Carlsbæk, M., Juul, U. & Jørgensen, E. (1993) Jordbrugsmæs-sig værdi af produkter fra organisk dagrenovation (Agricultural value of products form organic household waste). Arbejdsrapport nr. 64, The Danish Environmental Protection Agency, Copenhagen, Denmark. Christensen, T.H.; Jansen, J.l.C.; & Jørgensen, O. (2003) Datarapport om
sammensætning af organisk dagrenovation (Data report concerning com-position of organic household waste). Miljøprojekt nr. 815, The Dan-ish Environmental Protection Agency, Denmark.
Davis, J. & Haglund, C. (1999) Life Cycle Inventory (LCI) of fertilizer pro-duction, Fertilizer products used in Sweden and Western Europe. Mas-ter thesis, Chalmers University of Technology, Sweden.
de Willigen, P. (1991): Nitrogen turnover in the soil-crop system; compari-son of fourteen simulation models. Fertilizer Research, 27, 141–149. Diekkrüger, B., Soendgerath, D., Kersebaum, K.C. & McVoy, C.W. (1995)
Validity of agroecosystem models: A comparison of results of different models applied to the same data set. Ecological Modelling, 81, 3–29. Eilersen, A.M., Tjell, J.C. & Henze, M. (1998) Muligheder for
jordbrugsan-vendelse af affald fra husholdninger (Possibilities for application of household waste in agriculture). In Magid, J. (ed): Recirkulering fra by til land -Næringsstoffer på afveje, pp. 11–40, Institut for Jordbrugsviden-skab, KVL, Copenhagen, Denmark.
Eklind, K. & Kirchmann, H. (2000) Composting and storage of organic household waste with different litter amendments. I: carbon turnover. Bioresource Technology, 74, 115–124.
Fridriksson, G.B., Johnsen, T., Bjarnadottir, H.J. & Sletnes, H. (2002) Guidelines for the Use of LCA in the Waste Management Sector. Nordtest Project Nr. 1537–01, Linuhönnun, Nordtest.
Hansen, S., Jensen, H.E., Nielsen, N.E. & Svendsen, H. (1991) Simulation of nitrogen dynamics in the soil-plant system using the Danish simula-tion model DAISY. Fertilizer Research, 27, 245–259.
Hansen, T.L., Schmidt, S. & Christensen, T.H. (2006a) Environmental modeling of use of treated organic waste on agricultural land: A com-parison of existing models for life-cycle-assessment of waste systems. Waste Management & Research, 24, 141–152.
Hansen, T.L., Jansen, J.l.C., Davidsson, Å. & Christensen, T.H. (2006b) Effects of different pre-treatment methods on quantity and quality of household waste for biogas recovery. Waste Management & Research, submitted.
Hauschild, M. & Wenzel, H. (1998) Environmental Assessment of Products, Volume 2. Chapman & Hall, London.
Henriksen, K. & Jacobsen, I. (2002) Det strategiske Miljøforskningsprogram 1997–2000, Final report (The Strategic Environmental Research
Pro-gram 1997–2000, Final Report). Center for bæredygtig arealanven-delse og forvaltning af miljøfremmede stoffer, kulstof og kvælstof, Aal-borg University, AalAal-borg, Denmark.
Hoitink, H.A.J. & Fahy, P.C. (1986) Basis for the control of soilborne plant pathogens with composts. Annual Review of Phytopathology, 24, 93–114. Hutchings, N.J., Sommer, S.G., Andersen, J.M. & Asman, W.A.H. (2001)
A detailed ammonia emission inventory for Denmark. Atmospheric Environment, 35, 1959–1968.
Kirchmann, H. (1985) Losses, Plant Uptake and Utilization of Manure Nitro-gen during a Production Cycle. Supplementum 24, The Scandinavian Association of Agricultural Scientists and the Royal Swedish Acad-emy of Agriculture and Forestry, Stockholm
Kirkeby, J.T., Hansen, T.L., Birgisdottir, H., Bhander, G.S., Hauschild, M. & Christensen, T.H. (2006) Environmental assessment of solid waste sys-tems and technologies: EASEWASTE. Waste Management & Research,
24, 3–15.
Landes, E., Timmermann, F., Grosskopf, W. & Ziegler, W. (2003) Nachhaltige Kompostverwertung in der Landwirtschaft (Sustainable use of compost in agriculture). Verbund-Forshungsprojekt, Abschlussbericht, Umwelt Stif-tung, Germany.
Litterick, A.M., Harrier, L., Wallace, P., Watson, C.A. & Wood, M. (2004) The role of uncomposted materials, composts, manures, and compost extracts in reducing pest and disease incidence and severity in sustain-able temperate agricultural and horticultural crop production – A review. Critical Reviews in Plant Sciences, 23, 473–479.
Nielsen, L.K. (1994) Dyrkningsforsøg med kompost 1989–1993 (Growth Experiments with compost 1989–1993). Miljøprojekt nr. 258, The Danish Environmental Protection Agency, Denmark.
Noble, R. & Coventry, E. (2005) Suppression of soil-borne plant diseases with composts: A review. Biocontrol Science and Technology, 15, 3–20. Patyk, A. & Reinhardt, G.A. (1997) Düngemittel- Energie- und
Stoffstrohmbi-lanzen (Fertilizer- Energy- and Massbalances). Vieweg, Heidelberg, Ger-many.
Plantedirektoratet (2003): Vejledning og skemaer 2003/2004 (Intructions and Tables 2003/2004). Ministeriet for Fødevarer, Landbrug og Fiskeri, Denmark.
Stranddorf, H.K., Hoffmann, L. & Schmidt, A. (2005) LCA vejledning: Opdatering af påvirkningskategorier, normaliseringsreferencer og vægtnings-faktorer i LCA. Udvalgte EDIP 97-data (LCA guidance: Updating of impact categories, normalization references and weighting factors in LCA). Environmental report, in press, Denmark.