An LC inventory based on representative and coherent farm types
Randi Dalgaard1, Niels Halberg1, Ib Sillebak Kristensen1 and Inger Larsen2
1Danish Institute of Agricultural Sciences, Department of Agroecology, Research Centre Foulum, P.O. Box 50, DK-8830 Tjele. Tel: +45 8999 1254 - Fax: +45 8999 1200. E-mail:
Randi.Dalgaard[a]agrsci.dk. 2Danish Research Institute of Food Economics
Abstract
There is a need for valid and representative data regarding the production, resource use and emissions from typical farming systems in Denmark for analysis of the environmental impact of different systems and as input to product oriented analyses such as Life Cycle Assess-ments of basic food items. An inventory of 31 farm types was constructed on the basis of 2138 farm accounts from 1999 selected and weighted to be representative for the Danish farming sector. The farm accounts were grouped according to the major soil types, the num-ber of standard working hours, the most important enterprise (dairy, pig, different cash crops) and the stocking rate (livestock units per hectare). For each group the account data on the average inputs and outputs, land use and herd structure was used to establish a farm type model with coherency between livestock production, total feed use, land use, yields, im-ported feed, home-grown feed, manure production, fertiliser use and crop production. The set of farm types were scaled up to national level thus representing the whole Danish agricul-tural sector for the included products. The sum of area and yield by crop, number and pro-duction by livestock type and the use of fertiliser, energy and concentrated feed was checked against national level statistics and corrected accordingly across all farm types. Resource use and emissions in each farm type was established using standard nutrient concentrations and models for nutrient cycling, energy use and emissions of e.g. ammonia, nitrous oxides and methane. For LCA the product oriented inventory was established using system expan-sion rather than allocations to account for the secondary enterprises in the livestock farm types. Data are made available on a web-based database and may be used for analyses of the primary production systems or as input for LCA across the whole production chain.
Background
For most products the primary agricultural food production is an important determinant of the total resource use and environmental impact, which is why life cycle assessment (LCA) of food products must carefully address the question of data quality for agricultural production.
Many existing Inventories for LCA of agricultural products have used case studies, based on recordings on a limited number of farms. However, there is a large variation in the resource use and environmental impact between farms with the same main enterprise (Halberg, 1999; Weidema et al., 2002). Thus, an LCA that aims at a more general validity must be based on a larger sample of farm data being representative for the systems in question (average or mar-ginal depending on the purpose of the LCA) and preferably be checked against statistical in-formation from the level the sample will represent (e.g. regional or national).
Archived
at
This paper present an LCI which is based on representative farm accounts and is used to model the input and production of typical farms using a method that allows to check that the models are consistent with higher level statistical information following ideas described by Halberg et al. (2000).
Objective
The objectives of this paper is:
• To present a method for establishing LCI for important farm types based on represen-tative data for the Danish agricultural sector and farm models.
• To give examples of LCI data and discuss problems and advantages in using represen-tative statistical farm data for LCI.
Methods
All Danish farms are obliged to keep detailed records of purchases and sales for tax purposes and the yearly accounts are made with professional help. A representative data set of these ac-counts, 2138, are reported by the advisors to the Danish Research Institute of Food Econom-ics (DRIFE) and constitute the basic empirical data input to the model of representative farm types presented here. The accounts include besides economical data, technical data on the land use, livestock numbers in different groups and cash crop yields including cereals. The representative data set was based on farm accounts from 1999, sampled as to present the total Danish agricultural sector of the main livestock and crop production. Thus, each farm account is given a weight to allow for division into sub-populations/groups and for scaling up the sample to national level (Larsen, 2003).
The accounts in the data set were divided into 31 groups. Each group contained from 5 to 185 accounts and represented one of the 31 farm types according to soil type (loamy vs. sandy), main enterprise (dairy, beef, pig, poultry and different cash crop types), organic vs. conven-tional and animal density (e.g. livestock units per ha). For each farm type a detailed model was established partly based directly on the average accounts data within each group and partly on general knowledge as explained in the following: Step 1: Modelling coherent farm types which have a realistic balance between crop and livestock production, use of inputs and sale of products. Step 2: Modelling the emissions (CH4, CO2, NO3, HPO3, NH3 and N2O)
from the individual farm types.
Step 1. Modelling farm types
was modelled using standards. Due to the public regulation of manure and fertiliser use in Denmark representative average values for feed efficiency in livestock production (e.g. feed use per kg live weight pig) and the production of Nitrogen (N) and Phosphorus (P) in manure by livestock types is well established (Poulsen et al., 2001). Moreover, each farm has a fertil-iser quota based on official crop-N norms deducted the plant available manure-N produced or imported. Thus, the fertiliser use on the farm types was calculated using these norms. As part of Danish compliance with the Nitrates Directive the use of manure-N is limited (e.g. 140 kg manure N per ha on pig farms) why some farms are obliged to export manure to cash crop farms. This was modelled as transfer of manure from farm types with high stocking rate to o-ther types, which then reduced the fertiliser input accordingly.
[image:3.595.71.524.523.703.2]This way a coherent model of crop-livestock interactions was established for each farm type with a consistent relation between livestock production, use of home-grown vs. imported feed and export of cash crops. Energy use for traction was modelled following Dalgaard et al. (2001) where each crop is assigned a number of field operations multiplied by diesel use per ha. Electricity use was estimated directly from the accounts. The total land use and yields of each crop, the number of livestock, imported feed and fertiliser etc. across all farm types were then checked against national level statistical information (Agricultural Statistics, 2000) to make sure that the typology as whole was consistent and representative for Danish agricul-tural sector. As shown in table 1 the data set based on farm accounts is in good agreement with the Danish national statistics (Agricultural Statistics, 2000) for land use and for pig and milk production. The total area and yield of major cash crops (not shown) also fits to national statistics.
Table 1. Selected data from the typology of farm models scaled up to national level and com-pared with the Danish national statistics (Agricultural Statistics, 2000)
Typology of farm types Danish national statistics Deviation from nat. stat.
Slaughtering pigs 1produced, 1000 20639 20801 -1%
Sows (yearly basis) 1000 1083 1052 3%
Milking cows2, 1000 633 661 -4%
Milk production, 1000 tons 4624 4455 4%
Agricultural area, 1000 ha 2585 2644 -2%
Area with cereals, 1000 ha 1395 1448 -4%
Area with roughage, 1000 ha 567 570 -1%
Fertiliser N, 1000 tons N 226 252 -10%
Soybean meal, 1000 tons N 142 156 -9%
Grain, 1000 tons 6571 6728 -6%
Diesel and fuel, PJ 13 14 -18%
1 Living weight = 100 kg
The typology of farm models did, however, not account satisfactorily for the total use of fer-tiliser. Therefore, the farm models were adjusted using some of the slack in the determination of individual fertiliser quotas per farm and finally the still unexplained difference was cor-rected using an overall factor on the input to all farm types. The model also underestimated the total use of diesel and fuel by 20%, and therefore the farm models were adjusted accord-ingly.
Use of medicine is not considered and pesticide use was not included in the first version. Re-source use and emissions related to the construction and maintenance of buildings and ma-chinery used on the farm was not included.
Step 2. Modelling emissions
The emissions of gasses and other substances relevant for LCA impact categories were calcu-lated based on the established resource use and production including land use and herd struc-ture. The emissions of green house gasses were calculated using standard IPCC methodology for methane production from livestock and nitrous oxide production from soils and all rele-vant manure and fertiliser compartments (IPCC, 1997; 2000). Following the TIER 2 of the IPCC principles specific data for Danish crops and manure handling were used. The CO2
emission was calculated from the use of fossil fuel for traction and stables. Emissions related to the production of farm inputs like fertiliser and soybean meal, which happen outside the farm may be included in a second step and have been established as separate processes in the LCI database (Nielsen et al., 2003).
Emissions of nitrate for the eutrophication/nutrient enrichment impact category was assumed to be equal to the farm gate balance minus ammonia losses, denitrification (Kristensen et al., 2003) and net change in soil N status. The ammonia emission from stables, manure storage and handling was calculated using standard values from Andersen et al. (1999). Denitrifica-tion was estimated using the method of Winter (2003), and net change in soil N status was modelled using the method of Petersen et al. (2002).
[image:4.595.76.523.702.759.2]Table 2 shows the aggregated emissions over all farm types compared with national statistics for emissions of green house gasses (Gyldenkærne et al., 2004) and ammonia (Andersen et al., 2001). The difference in nitrous oxide emission was expected since we used more detailed information regarding crop residues than in the national nitrous oxide budget. The methane emission was 10% lower and the ammonia emission was 1% lower than national statistics.
Table 2. Selected emissions from the typology of farm models scaled up to national level and compared with the Danish national statistics (Andersen et al., 2001; Gyldenkærne et al., 2004,)
Typology of farm types Danish national statistics Deviation from nat. stat.
N2O (1000 tons) 22 20 9%
CH4 (1000 tons) 160 177 -10%
Results
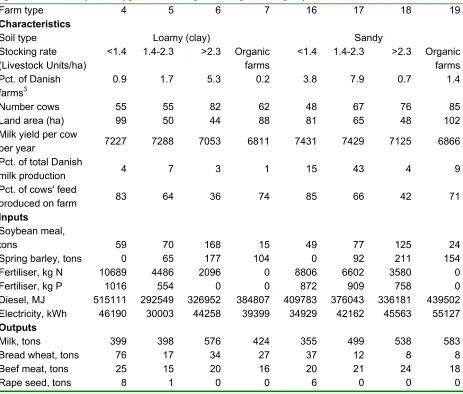
[image:5.595.76.539.233.627.2]The resulting 31 farm type models after correction for national level consistency shows inputs and outputs used to produce specific amounts of livestock and cash crop products with differ-ent land use according to major differ-enterprise and livestock density. Detailed results are presdiffer-ented at an open database (Nielsen et al., 2003). Table 3 shows a part of the inputs and outputs as-sociated with production at the different dairy farm types.
Table 3. Main characteristic, inputs and outputs associated with agricultural production at eight different dairy farm types. Data are provided per farm per year.
Farm type 4 5 6 7 16 17 18 19
Characteristics
Soil type Loamy (clay) Sandy
Stocking rate (Livestock Units/ha)
<1.4 1.4-2.3 >2.3 Organic farms
<1.4 1.4-2.3 >2.3 Organic farms Pct. of Danish
farms3
0.9 1.7 5.3 0.2 3.8 7.9 0.7 1.4
Number cows 55 55 82 62 48 67 76 85
Land area (ha) 99 50 44 88 81 65 48 102
Milk yield per cow
per year 7227 7288 7053 6811 7431 7429 7125 6866
Pct. of total Danish
milk production 4 7 3 1 15 43 4 9
Pct. of cows' feed
produced on farm 83 64 36 74 85 66 42 71
Inputs Soybean meal,
tons 59 70 168 15 49 77 125 24
Spring barley, tons 0 65 177 104 0 92 211 154
Fertiliser, kg N 10689 4486 2096 0 8806 6602 3580 0
Fertiliser, kg P 1016 554 0 0 872 909 758 0
Diesel, MJ 515111 292549 326952 384807 409783 376043 336181 439502 Electricity, kWh 46190 30003 44258 39399 34929 42162 45563 55127 Outputs
Milk, tons 399 398 576 424 355 499 538 583
Bread wheat, tons 76 17 34 27 37 12 8 8
Beef meat, tons 25 15 20 16 20 21 24 18
Rape seed, tons 8 1 0 0 6 0 0 0
More than 50% of the total Danish milk was produced on the sandy soil types with low and medium stocking rate. There are differences in farm size and the percentage of feed produced on farm between the types. Farm types with high stocking rate produce a smaller part of the feed on the farm and import more soybean meal compared to farm types with lower stocking
rate. The average organic farm is larger than the conventional farm types, has lower milk yield per cow and crop yields per ha and produces more feed on the farm, especially based on grass-clover leys in crop rotation with cereals. In the model the organic farm import around 20 kg N per ha in manure from conventional farms.
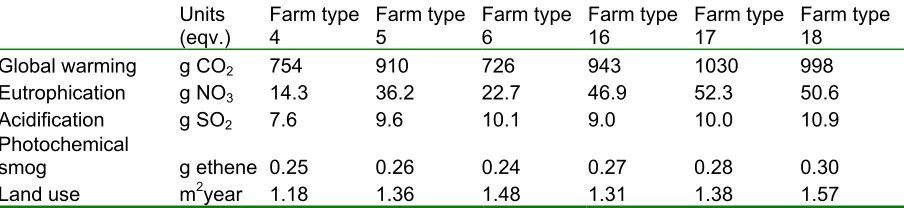
The resulting environmental impact per kg milk produced at farm-gate after system expansion and displacement of cash crops is shown in table 4. Milk produced at farm types with low stocking rates (farm type 4 and 16) shows a tendency to lower environmental impact than milk produced at farm types with medium stocking rates (farm type 7 and 17). The farms with high stocking rate have to export manure according to public regulation, which decreases emissions from the farm. Land use per kg milk increase with higher stocking rate, because the land used for imported feeds are involved.
[image:6.595.72.524.389.493.2]Similar results for pig meat and major cash crops on farm level and per kg product ex farm are presented by Nielsen et al. (2003) on the open database: www.lcafoods.dk.
Table 4. Environmental impact from production of 1 kg of milk from six different conven-tional dairy farm types
Units
(eqv.) Farm type 4 Farm type 5 Farm type 6 Farm type 16 Farm type 17 Farm type 18
Global warming g CO2 754 910 726 943 1030 998
Eutrophication g NO3 14.3 36.2 22.7 46.9 52.3 50.6
Acidification g SO2 7.6 9.6 10.1 9.0 10.0 10.9
Photochemical
smog g ethene 0.25 0.26 0.24 0.27 0.28 0.30
Land use m2year 1.18 1.36 1.48 1.31 1.38 1.57
Discussion and conclusion
avail-able N content (i.e. the part of total manure-N taken up by the crop when compared to fertil-izer in trials) the ammonia losses from spreading the manure on the importing farm is still in-cluded in the emissions of the manure producing farm.
The basis for the established typology of farm models is a set of representative farm accounts on the form that is used for statistical purpose including the Danish reporting to the Farm Ac-count Data Network (FADN), which again forms part of EU agricultural statistics (Poppe et al., 2000). Thus, this type of data will be available for most European countries, which again could facilitate the development of more uniform methods for LCI establishment across dif-ferent countries. Another advantage of this method is that it may be updated relatively easily with data for the subsequent years when accounts data are available.
The major drawback of the method from the authors’ point of view is that the large variation between farms in e.g. feed or fertiliser use efficiency due to differences in farmers’ manage-ment skills and strategic choices regarding crop rotation and feed planning is not reflected in differences between the farm types. This was, however, a necessary choice based on the pri-mary purpose: To get representative and statistically valid data for an LCI to be used for com-parison of different products and securing a valid baseline for LCA on processed food prod-ucts. The amounts of feed and fertiliser purchased could have been modelled based on the monetary information using standard prices per unit but that might have introduced another bias because of differences in the actual price per unit paid (e.g. large farms that get discount prices would in reality have used more feed or fertiliser than estimated from average prices). One hypothesis could be that farmers in the marginal types would be more efficient than the average farmers and thus have a lower resource use and emissions per kg product delivered. The results show differences in resource use and emissions per kg product between farm types, but more sensitivity analyses are needed in order to determine if these differences are significant.
Another drawback is the relatively large number of small co-enterprises in the farm types re-sulting from combining a large number of farm accounts with different co-enterprises (e.g. two dairy farms growing five hectares with cash crops, one bread wheat, the other sugar beets will result in a type growing 2.5 hectares of each). This results in a number of co-enterprises that have to be compensated for through system expansion. A solution to this would be to eliminate some of these co-enterprises in the modelled farm types, which however further would detach the model from the empirical data.
It can be concluded that the resulting LCI demonstrates successfully a method to establish co-herent and representative inventories of agricultural production based on generally available data.
Reference
Agricultural Statistics. 2000. Statistik om landbrug, gartneri og skovbrug. Danmarks Statistik. ISBN 87-501-1195-7. 287 pp.
Andersen, J.M., Sommer, S.G., Hutchings, N.J., Kristensen, V.F. and Poulsen, H.D., 1999. Emission af ammoniak fra landbruget - status og kilder. Ammoniakfordampning - rede-gørelse nr. 1, Danmarks JordbrugsForskning, 63 pp.
Andersen, J.M., Poulsen, H.D., Børsting, C.F., Rom, H.B., Sommer, S.G. and Hutchings, N.J. 2001. Ammoniakemission fra landbruget siden midten af 80’erne. Fagligt rapport fra DMU nr. 353. 47 pp.
Dalgaard, T., Halberg, N. and Porter, J.R., 2001. A model for fossil energy use in Danish ag-riculture used to compare organic and conventional farming. Agag-riculture, Ecosystems & Environment 87(1): 51-65.
Gyldenkærne, S. and Mikkelsen, M.H. 2004. Projection of Greenhouse Gas Emission from the Agricultural sector. Research Notes from NERI No. 194, National Environmental Research Institute. Denmark. 50 pp.
Halberg, N., 1999. Indicators of resource use and environmental impact for use in a decision aid for Danish livestock farmers. Agriculture, Ecosystems & Environment 76 17-30. Halberg, N., Kristensen, I.S. and Dalgaard, T., 2000. Linking data sources and models at the
levels of processes, farmtypes and regions. Agricultural data for Life Cycle Assess-ments. Series 2.00.01, vol.1. Agricultural economics research Institute (LEI), The Ha-gue, the Netherlands. p. 16-30. ISBN 90-5242-563-9.
IPCC, 1997. Greenhouse gas inventories. Revised 1996 IPCC Guidelines for National Green-house Gas Inventories. Available on-line: http://www.ipcc.ch/pub/guide.htm
IPCC, 2000. IPCC Good practice Guidance and Uncertainty Management in National Green-house Gas Inventories. Chapter 4. Agriculture. 4.1-4.83. IPCC. Available on-line:
http://www.ipcc.ch/pub/guide.htm
Kristensen, I. S., Halberg, N., Nielsen, A. H., Dalgaard, R., and Hutchings, N., 2003. N-turnover on danish mixed dairy farms, 1-21. Paper for workshop: “Nutrient manage-ment on farm scale: how to attain European and national policy objectives in regions with intensive dairy farming?”. 23-25 June 2003, Quimper, France. Available on-line:
http://www.agrsci.dk/jbs/isk/DK_country_report_partII.pdf.
Larsen, I., 2003. LCA project. Method description. Available online, 1/10 2003 at
www.lcafood.dk/database.
Petersen, B.M. & Berntsen, J., 2002. Omsætning i jordpuljen på forskellige bedriftstyper. Temadag arrangeret af Afd. for Jordbrugssystemer 24. april 2002. Forskningscenter Foulum. Intern rapport nr. 157: 13-24.
Poppe, J.K. and Meeusen, J.G., 2000. Using a Farm Accountancy Data Network in data man-agement for LCA. Agricultural data for Life Cycle Assessments. Series 2.00.01, vol.2. Agricultural economics research Institute (LEI), The Hague, the Netherlands. p. 115-127. ISBN 90-5242-563-9.
Poulsen, H.D., Børsting, C.F., Rom, H.B. and Sommer, S.G. 2001., Kvælstof, fosfor og kali-um i husdyrgødning -normtal 2000. DJF rapport nr. 36. Husdyrbrug.
Winter, F., 2003. Empirisk model beregning af N2O-emission og denitrifikation som funktion
af jordtype og gødningsmængde. Unpublished note from Danmarks JordbrugsForsk-ning. 10pp. (Empirical model of N2O-emission and denitrifikation as a function of soil
type and fertiliser application)
Weidema, B.P., Thodberg, L., Nielsen, A.H., Kristensen, I.S., Hermansen, J. & Hvid, S.K., 2002. Produktorienteret miljøindsats i landbrugets primærproduktion. Vurdering af vir-kemidler. Arbejdsrapport fra Miljøstyrelsen 19, 74 pp.
http://www.mst.dk/udgiv/publikationer/2002/87-7972-131-1/html.