I agree that, if this thesis is accepted for the award of a degree of the University of Tasmania, it may be
OF OLFACTORY SENSITIVITY UNDER CONDITIONS OF NON—ADAPTATION AND CO—ADAPTATION
by
JOHN WILLIAM FRASER B.Sc., Dip.Ed.
submitted In fulfilment of the requirements for the Degree of
Master of Science
UNIVERSITY OF TASMANIA HOBART
DECLARATION
To the best of my knowledge, this thesis contains no copy or paraphrase of material previously published or written, except when due reference is included in the text.
;7,1.",) • 1.-Istagf
Page
Abstract
Acknowledgements (iv)
Chapter 1 - The Olfactory System in Man
Chapter 2 - Stimulus Quantification and Presentation 7
Chapter . 3 - The Concept of Threshold 13
Chapter 4 - The Theory of Signal Detectability and its
Application to Olfactometry . 20
Chapter 5 - Olfactory Adaptation and Odour Classification nr,
Chapter 6 - The Aim and Method of the Present Study 34
Chapter 7 -.Procedures and Results of Experiments 50
Chapter 8 - Discussion and Conclusions 90
References 100
Appendix I - Chemical Composition of Samples of Isopropyl 108
Alcohol
Appendix II - Programming Detail .s . 109
Appendix III - Results of Panel X Subjects 111
Appendix IV - Results of Panel Y Subjects 125
ABSTRACT
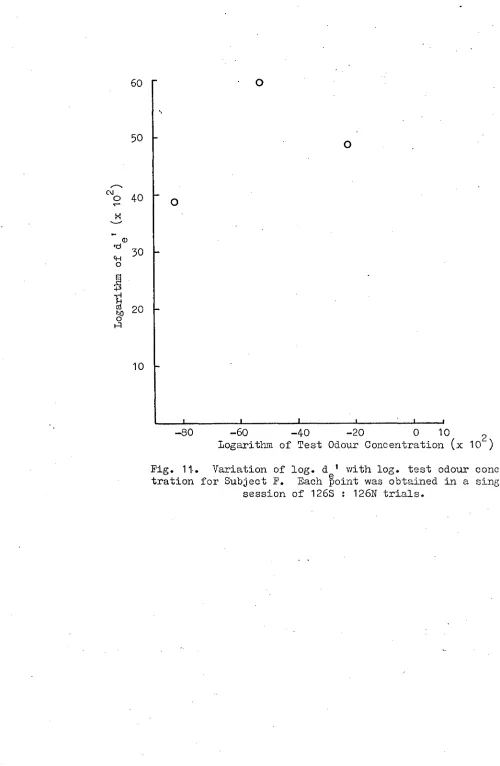
An investigation into the relative efficiency of Threshold and Signal Detectability measures of olfactory Sensitivity was under-taken using isopropyl alcohol as stimulus. Intensive testing of seven subjects under adaptive and non-adaptive conditions revealed that the -Signal Detectability paradigm, although theoretically desirable because
of its allowance for the subject's response bias, was difficult to implement because of the prolonged testing required. A variance of the rating technique involving multiple stimulus concentration presentations in a three-hour testing session was attempted.- Results in the
non-adapting environment indicated that the method was more effective than single-stimulus concentration presentations. However reliable results under adapting conditions were obtained In the case of one subject only.
As a comparison, the constant stimulus method was used to obtain threshold using a procedure similar to Cheesman's and Mayne's group threshold determinations, but modified for individual subject testing. Practice and learning effects were noted and their relevance discussed. The Cheesman hypothesis viz, that adapting odour concentra-tion and threshold elevaconcentra-tion obey a linear logarithmic relaconcentra-tion which is characteristic of the adapting and test stimulus compounds was confirmed in two subjects only. Reasons for non-confirmation include the extended adapting stimulus concentration range, subject boredom and inadequate control of the stimulus; the latter factors being a consequence of prolonged testing.
ion were employed, although not with the same subjects. Thus a direct contrast of these presentation methods was not possible. However results were generally more consistent with the air-dilution
technique.
ACKgOWLEDGEMMITS
I gratefully acknowledge the encouragement and guidance
of Dr. G.H. Cheesman, Chemistry Department, who made the equipment
and facilities of the Olfaction Unit available for this project. I
am also grateful to Dr. K. Kruup, Psychology Department, for his
interest and critical oversight particularly in the latter stages
of this programme.
An interdisciplinary study such as Olfaction requires
support from various sources. Thus Ian appreciative of the financial
assistance of the University of Tasmania and the approbation. of
Professor H. Bloom, Head of the Chemistry Department and of Professor
J.A. Cardno, Head of the Psychology Department.
Thanks are due to the following members of the Chemistry
Depar ment: Dr. A. Finney for assistance with computations;
Mr. W. Dixon for glassblowing in the construction of the Olfactometer;
Mrs. H. Hen for the drawing of diagrams in this thesis.
Finally, I am indebted to my wife Barbara for her proof
CHAPTER 1.
THE OLFACTORY SYSTEM IU MAN
The sense of smell is of reduced importance in man compared
to the lower animals whose survival is often dependent on its adequate
development. While the external organ is relatively large, the olfactory
brain (rhinencephalon) is diminished so that some areas such as the
olfactory tubercle, although prominent In macrosmatic animals, are
rudimentary in man.
Anatomically and operationally the olfactory sense is a
long-range system in that any stimulus presented to it must traverse the nasal
passages before impinging upon the receptors of the olfactory membrane
located high in the nasal cavity. Schneider (1967) suggests that only
three or four percent of odouraus molecules present at the nasal
open-ing reach the olfactory membrane thus makopen-ing stimulus quantification
indeterminate. Once the molecules have made contact with the receptor
cells, electrical impulses are generated which pass into the olfactory
nerve (Cranial Nerve I) and thence to the glameruli of the olfactory
bulb where 1,000:1 convergence occurs. From here they pass to the mitral.
cells and thence to the stria and olfactory areas along the *olfactory
tract. Co-laterals from the grey matter lining the olfactory bulb
contribute to the impulses along the olfactory tract. In this way
impulses from the contralateral olfactory bulb can modify incoming
infor-mation. Nerve endings from the trigeminal nerve (Cranial Nerve V) are
present in the olfactory membrane and are stimulated by certain odours.
Hence subject responses to Odouraus stimuli need not be a direct result
effects, particularly when the subject reports the presence of an odour with emphasis upon hedonic and irritant properties.
The specificity of neurons comprising the olfactory bulb and the nature of the convergence of the olfactoria file has prompted spec-ulation concerning the mechanism of odour discrimination. Walsh (1956) has investigated the electrochemical characteristics of three types of neurons having different functions in the olfactory bulb of rabbit. On the other hand, Adrian (1950) and Mulvaney and Heist (1970) suggest that discrimination is achieved by spatiotemporal means.
There is physiological evidence supporting some of the major psychophysical propositions in relation to the olfactory modality. Slow electrical changes occur at the olfactory epithelium under stimulation. Ottoson (1956) has found that the relation between the amplitude of response in frog epithelium and the strength of stimulation resembles the human psychometric function. Electrical stimulus reception in
receptor cells gives rise to a spike potential during which the intrinsic activity of the olfactory bulb is disrupted (Adrian, 1950), thus lending support to the Signal Detectability paradigm which assumes that signal is superimposed upon a continuous background of neural noise. Thus there is some justification for using Signal Detectability techniques in olfact-ory psychophysical experiments.
No direct relationship exists between overall brain size and olfactory acuity (Mulvaney and Heist, 1970). The relative size of the rhinencephalon decreases as one ascends the phylogenetic scale so that man and the primates are microsmatic. Nevertheless man's sensitivity
aid in signal communication and act as initiators of fixed action patterns (Comfort, 1971).
• Olfactory defects include hyperosmia, hyposmia and anosmia.. The aetiology of an anosmia may be congenital, hysterical or the result • of a local disorder. Zwaardemaker (1891) regarded most congenital
anosmias as having a "nervous characteristic" which could be of use in the clinical examination of patients with nervous disorders. However, his primitive olfactameter, which was based on a false premise regarding odour saturation, did not permit valid quantitative investigation. The potential usefulness of a study of olfactory defects is twofold. Firstly, one can ascertain the degree to which the trigeminal component of an
odour contributes to subject response and secondly, one can use the incidence of anosmia as an adjunct to the search for primary odours
(Amoore, Venstran and Nutting, 1972).
Differences in olfactory sensitivity between men and women have been observed (Bailey and Nichols, 1884; Schneider and Wolf, 1955; Venstrom and Amoore, 1968; Koelega and KOster, 1973). Variables such as the nature of the test stimulus, the time of testing and subject's age have been fully investigated to allow general statements regarding
sensi-tivity differences. In females, variability in sensisensi-tivity with the menstrual cycle is most evident when substances with some sexual
signif-icance are used e.g. exaltolide (Le Magnen, 1952). This has prompted speculation concerning the role of the olfactory system in sexual funct-ioning. Concentrations of female hormones such as oestrogen and progest-erone have been correlated with olfactory sensitivity (Vierling and Rock, 1967). The exocrinological theory (Parkes and Bruce, 1961) is based on the hypothesis that the presence of male odours may affect secretion of female hormones. Thus normal menstrual variation in the sensitivity of fernles to certain odours could be confounded by the frequency and degree of contact with males.
THE RELATION OF SMELL TO THE OTHER SENSES
The sense of smell exhibits features such as adaptation and absolute and differential thresholds which are common to other senses. The most striking differences, other than obvious anatomical ones, involve the physical parameters of the odour stimulus and psychological descript-ion. Whereas the link between parameter and description is clearly understood in the case of vision and audition (e.g. wavelength-hue and frequency-pitch relationships) , is not the case in olfaction.
5
information from both types of experiment. The numerous theories of. mechanism of olfactory stimulation stand in contrast to the relative paucity of experimental evidence supporting them. This reflects the unique methodological difficulties encountered in olfactory research as well as the inadequate vocabulary of odour description.
The Trichramatic Theory of colour vision put forward by Young (1807) and developed by Helmholtz (1852, 1866) has initiated a
search for primary odours by analogy. Multidimensional scaling techniques have been used in attempts to classify odours (Yoshida, 1964; Mitchell,
1971; Berglund, Berglund, Dagen and Ekman, 1972); the latter study follow-ing procedures used in colour analysis. Also adaptation effects of one odour on another should yield some information concerning odour relat-ionships which could be used to classify odours into primary groups. The relatively large informational capacity of the olfactory system for qualitative discrimination (Engen and Pfaffman 1959; Wright, 1964) points to the existence of at least twenty-five primary odours compared to the three primaries in the case of colour.
Adaptation is considered to be primarily a central phenomenon (Adrian, 1950). Intra-sensory masking experiments in audition and vision show an increase in the exponent on the psychophysical function (Stevens, 1966) whereas a decrease is noted in olfaction (Mitchell and McBride, 1971). Mitchell and McBride suggest that differing experimental restrictions may account for these results. The "single-channel
hypothesis" (Welford, 1960) presupposes a common mechanism of filtering out signals which are either non-essential or are presented too rapidly for the observer to perceive in toto. Moreover the hypothesis is
stimuli has important consequences for experimenters who attempt to control environmental variables. The lack of standardization and reproductability of olfactory sensitivity measures between experiment-ers is directly related to this point.
• The theory of Signal Detectability, originally formulated within visual and auditory senses has only recently been incorporated into olfactometry (Semb, 1968) yet is was used in gustatory studies as early as 1964 (Linker, Moore and Galante's, 1964).
It can be seen that the similarities between the sense of smell and the other senses are most evident with respect to psycho-physical characteristics. Anatomical and physiological differences are the limiting factors in the olfactametric application of psycho-physical techniques derived from studies of the visual and auditory senses. These factors influence the way in which quantification and presentation of the stimulus are dealt with in olfactory experiments.
CHAPTER 2.
STIMULUS QUANTIFICATION AND PRESENTATION
- Historically, quantification as well as presentation of odourous stimuli in psychophysical experiments may be divided into two lines of development: liquid dilution versus air dilution techniques and controlled (injection) presentation versus the natural sniff.
Very few liquids are completely odourless and thus suitable for use as diluents. Water, the most common diluent, has a characteristic "flat" odour in its distilled form. Diethyl phthalate (Semb, 1968), benzyl benzoate (Beck, Kruger and Calabresi, 1954) and silicon oil (Berglund, Berglund, Engen and Ekman, 1972) have been used as diluents. It must also be considered that the chemical interaction between solute and solvent may produce small quantities of compounds which act as impurities giving rise to changes in qualitative odour characteristics and hence influence quantitative judgments. In addition, the solubility of test compound in diluent is temperature dependent, the degree of it being a function of molecular characteristics and the kinetics of the solution system. It is therefore not possible to assume ideality despite the low solution concentrations used in olfactometry. Thus vapour concen-tration, the most common method of expressing stimulus intensity, may not be directly related to solution concentration.
The limited range of odourless liquid diluents available and their uncertain interaction olfactorily with test stimuli has prompted the use of pure air as a universal diluent. Wenzel (1948) gives a
8
The primitive olfactameter designed. by Zwaardemaker (1904)
for use in clinical investigations incorporated an indirect measure of
stimulus Strength, the olfactie. The assumption implicit in its use
was chemically unSound in as much as the degree of vapour saturation was
not related linearly to the extent of exposed stimulus since increases in
vapour concentration were not possible beyond saturation at a particular
vapour pressure (Gundlach and Kenway, 1939). More recent attempts at
accurate stimulus quantification have incorporated direct measures based
on molecular concentration at the saturated vapour pressure of the test
liquid and subsequent air dilution. Saturation is achieved by allowing
a stream of pure air either to pass over undiluted test liquid at a
predetermined constant temperature (Cheesman and Kirkby, 1959) or by
sparging air through the test liquid (Ough and Stone, 1961). Continuous
dilution is achieved by combination of air and odour lines according to
flow rates calibrated at a standard pressure difference. The time lag
involved in changing from one test concentration to another coupled with
adsorption of odours by glass flow lines has furthered the use of group
studies in which subjects undergo a limited number of tests per session.
(Cheesman 1955).
THE CHEESMAN AIR—DILUTION OLFACTOMETER
The prototype apparatus described by Mayne (1953) was based on
the principle that the saturated vapour pressure of an odour is a
reliable measure of concentration. 'Later developments (Cheesman and
Kirkby,
1959;
Cheesman, 1972) have either been of a sophisticated nature,(eg. separating functional , components - irom_thearea in_which the subject
operates) or discarding unnecessary features (e.g. constant pressure
bottles). The main components of the apparatus consist of a source of
exhaust system. The arrangement of these components is shown in Fig. 1. The apparatus is composed of glass connections with hemispherical and conical ground joints. Air is forced through the system from a cylinder of compressed air at the rate of 12 litres/minute so that a pressure difference of 5 cm. of head of water is maintained in the air and odour distributing lines. This is monitored by means of large dial-type
manometers situated at a considerable distance from the smelling points. The air purifier consists of an ethyl alcohol - dry ice bath which has proved to be more reliable than activated carbon filters. A coil of copper tubing, the only non-glass connection in the whole apparatus, passes from the air cylinder, through the air purifier and on to the saturator.
Saturator and thermostat
Exhaust duct
Air purifier
Air distributing line Odour distributing line
"t
Reducing valve and regulator
Air tank
^
Exhaust fan to exterior
,Metal-glass
seal
capillary capillary Air Odour
Hemispherical ground joint
"H"
Conical ground joint Smelling
point
Constant pressure bottles
Fig. 1. Diagrammatic representation of the Chedsman
_1
air—dilution olfactometer. (From Cheesmansmelling point caps are replaced at the conclusion of each trial.
"Blank"smelling points are set up when the odour capillary is replaced
by solid glass tubing and the air capillary delivers 1,000 ml./min. at
5
cm. water pressure.The prototype apparatus did not allow for adapting odour
pres-entation. In later studies the apparatus has been duplicated so that
adaptation effects can be investigated. Only one adapting odour
concen-tration is used during a testing session there being only one pair of
air and odour adapting capillaries provided for at any one time. Twelve
identical adapting smelling points corresponding to the twelve test
smelling points are arranged in a linear array so that subjects move
from one pair of adapting and test smelling points to the next.
The whole apparatus is constructed so that it can be dismantled
for cleaning purposes. Cleaning by washing in water, soaking in a
sulphuric acid-chromate bath, rinsing, steaming, drying in air, and
baking at 1100 0. is essential when a new odour is introduced into the
'system or when a lower working saturated vapour is desired.
PRESENTATION OF THE STIMULUS
A consideration of quantitative aspects of the stimulus
relates to the presentation techniques which are used. For example,
precise stimulus quantification favours artificial stimulus delivery,
e.g. injection procedures and the use of nose-pieces, whereas the natural
method, i.e. the sniff, does not allow the same degree of control but may
be an optimum subject procedure. Two factors, stimulus volume and rate
of delivery of the stimulus, have been shown to: be-determinants of_
subject's response (Elsberg, Levy and Brewer, 1935b). The "blast
injection" and "stream injection" techniques proposed by Elsberg et al.
12
(Elsberg, Levy and Brewer, 1935a) while allowing a high degree of control . over dispensation of the stimulus. However the nose-pieces reduced the
subject's acuity initially. Cheesman (1955) and Mayne (1953) argue that the subject's judgment is disturbed by the insertion of nose-pieces into the nasal passages and by the conscious attempt to refrain from inspirat-ion while the stimulus is presented. In any case, the experimenter cannot be certain that all odorous molecules will reach the olfactory receptors because of their distance anatomically from the external open-ings of the olfactory organ and the existence of turbulence in the nasal passages.
The inter-trial period is of paramount importance in olfactory psychophysical experiments. Cheesman (1972) recommends a 30 second interval between presentations based on adaptation curves studies
13
CHAPTER 3.
THE CONCEPT OF THRESHOLD
Fechner is generally accepted as having, introduced the threshold concept into modern psychophysics. Although he did not preclude the existence of "negative sensations" i.e. responses to subthreshold stimuli, he viewed the threshold as a barrier to be over-come - an idea akin to the "all-or-none" principle of neuronal function.
Since then the sensory threshold concept has come under attack (Corso, 1963) and has been supplanted by a statistical, operational definition. The classical threshold may be defined as that mean value of the stimulus which elicits some arbitrary positive response rate e.g. 50% or 75% within a Gaussian distribution of stimulus values. Threshold theories include High Level Theory (Blackwell, 1953), Low Level Theory including Multi-threshold Theory, (Luce, 1960; 1963 a, b) And Quantal Theory (Von Bekesy, 1960). The two-threshold theory proposed by Green approximates Signal Detection Theory and fits data quite adequately (Swets, 1961).
Tanner and Birdsall, 1955) and many "blanks", a number at least equal to that of the stimuli, must be presented to allow for 0 guessing (Steinmetz, Pryor and Stone, 1969). Even then non-independence of positive response and false-positive rates cannot be assumed (Green and Swets, 1966).
Methods of threshold .determination range from the method of adjustment, the method of limits and the method of constant stimuli, in which the order of presentation of stimuli is predetermined, to titration methods such as the stair-case method (Cornsweet, 1962) in which the
presentation sequence is dependent on O's responses. Procedural differ-ences, e.g. Yes-No t n-alternative forced choice and second choice,
successive response effects (Verplanck, Collier and Cotton, 1952), and warning-stimulus intervals (Treisman and Howarth, 1959), have been shown to contribute to individual threshold variation. As long as the threshold is used as a sensitivity measure without regard for the method by which it was obtained or the various criteria of positive response which 0 adopts, little hope for consistency of the threshold measure exists. Smith (1961) suggests that the reluctance of psychophysicists, until recently, to pursue new methods of measurement and analysis is a result of their interests being heavily directed towards precision in stimulus quantification.
OLFACTORY THRESHOLDS
15
presentation device into account he helped to establish the threshold as a fundamental psychophysical measure in olfaction.
Some odorous substances stimulate both trigeminal and olfactory nerve endings. Thus the proximity of olfactory threshold to trigeminal
threshold mustbe taken into account if pure olfactory response is desired and Moncrieff (1955) actually describes a technique for separat-ing irritant and odorous reactions to such substances.
One of the most frequent criticisms against the use of olfactory thresholds is that of standardization difficulties. With an ever increas-ing output of data from olfaction laboratories it becomes the more import-ant that stimulus, subject and environmental variables be adequately controlled and allowed for in interpretation of results.
Background odour, temperature and huniidity are the environ-mental factors which have been considered by most experimenters. Other less obvious features such as electrostatic charge density of both subject and surroundings have also received attention (Frey, 1968).
Background odour is most difficult to control without the aid of expensive air-conditioning and filtering apparatus which itself must be odourless. The use of nolfactorian (Schneider and Wolf, 1955) into which stimuli are introduced approximates real-life situations but
inadequate control of stimulus and subject odours limit their reliability. Possibly the most effective way of ensuring a constant, if not
non-existent background, is to maintain continuous flow of clean odourless air through the test room.
olfactory system attain temperature equilibrium very quickly and that olfactory acuity is not affected by ambient temperature change. This conclusion was reached using acetic acid as stimulus, a compound having both trigeminal and olfactory components and may not be typical for
purely olfactory stimuli. More recently Grundvig, Dustman and Beck (1967) measured thresholds for-ethyl alcohol at 5-degree intervals from 15 ° C.
to 45oC. and established a linear relationship between the logarithm of the threshold value and temperature. The conflicting evidence on temp-erature effects may be partly the result of different methods of stimulus presentation: Woerdeman, and Grundvig et al., used blast injection
techniques whilst Mayne and Stone employed the "natural sniff" as a means of obtaining receptor stimulation.
Subject variables likely to affect acuity include state of health, smoking habits, age, sex, degree of hunger, and task sophistica-tion. Subjects may be examined medically for nasal obstructions,
allergies and asked to indicate illnesses such as sinusitis, cold or influenza.
Mayne (1953) and Pangborn et al. (1964) found no significant differences between thresholds of groups of smokers and non-smokers. This does not negate the importance of smoking habits as possible influen-ces on acuity, especially as the olfactory system is directly involved and nervous and psychological changes in the subject accompany the physical effects of smoking.
17
and Campbell, 1970). Murray and Campbell showed that sensitivity is dependent on the level of arousal of the infant.while Lipsitt attributed threshold changes to temporal factors.
Female subjects are known to exhibit variability in olfactory detection thresholds for certain odours in accordance with bodily chemical changes accompanying the menstrual cycle (Le Magnen, 1952; Koster, 1965). Detection of some odours is at a peak at ovulation and decreases towards the end of the mensis. No such cyclic variation is known to occur in male subjects.
The evidence for hunger and satiety effects on thresholds is equivocal. Goetzl, Abel and Ahokas (1950), Goetzl and Stone (1948) and Guild (1956) suggest that sensitivity rises significantly prior to
ingestion and decreases afterwards, whereas the findings of Stone, (1966), Janowitz and Grossman (1949) and Furchgott and Friedman (1960) do not support the notion that minor variations in sensitivity are related to appetite and hunger sensations. Stone and Pryor (1967) report a ten-fold increase in odour sensitivity from morning to evening which was not evident when subjects repeated tasks blind folded. Procedural differences, inadequate control of experimental variables and degrees of rigour of
analysis of data may account for some of these disparite results. Practice effects have been observed in olfaction experiments (Engen, 1960; Friedman, 1960; Semb, 1968) and have been taken into account when determining the threshold by allowing the subject a "settling in" or "warm-up" period at the beginning of an experimental session. Little attention has been given to the subject's expectations, • criterion of discrimination or reaction to different pay-off situations.
Nor have personality characteristics of the subject been linked with sensitivity much beyond the casual remarks of some experimenters.
observed may be dependent on subject characteristics and methodology
(Pangborn, Berg, Roessler and Webb, 1964). Jones (1957) conducted a
factor analysis of absolute olfactory thresholds and concluded that
individual differences were systematic and not related to stimulus
parameters.
The use of group measures or community thresholds has been
suggested by Cheesman et al. (Cheesman and Mayne, 1953; Mayne, 1953;
Cheesman and Townsend, 1956; Cheesman and Kirkby, 1959; Cheesman, 1972)
as a means of randomizing idiosyncratic sources of threshold variations
between subjects. While individual differences must be appreciated by
the experimenter, the intensive study of relatively few "normal" subjects allows a more detailed examination of subject performance.
In the latter case inter-subject effects are minimal or absent and there
is no danger of confounding or losing information due to grouping of
individual data. The major disadvantage of using the individual threshold
(I.T.) is the lengthy procedure required to obtnin a reliable threshold -
.up to 15 times as long as the group threshold determination. Townsend
(1956) has compromised by calculating I.T. for each member of a group
and combining I.T.s to give a group threshold. Despite its mathematical
simplicity, this method suffers from the reduced reliability consequent
to the small number of trials used to calculate I.T.
The study of sub-threshold intensities has arisen incidentally
in the main. The recent interest in pheromones (Comfort, 1971) and the
possibility of low intensity or subliminal communication between animals
has emphasised the difficulties encountered in defining an olfactory
threshold. Amirov (1954) describes olfactory- experiments performed
with normal and pathological subjects in which "sub-threshold inhibition"
was demonstrated, the extent of inhibitions being dependent on the
1 9_
of nervous system displayed most inhibition for a period of up to six minutes after the introduction of the adapting stimulus.
20
CHAPTER 4.
THE THEORY OF SIGNAL DETECTABILITY AND ITS APPLICATION TO OLFACTOMETRY
The classical threshold concept has dominated olfactory sensitivity measurement for over one hundred years. Psychophysicists have been content to use percentage positive response within a stable false positive rate as a measure of sensitivity, not allowing for
subject variables such as degree of motivation, expectations or response bias. Some experimenters have noted that variation in subject instruct-ions can produce conflicting results (Fernberger, 1931), but an apprec-iation of subject attitudes is just beginning to develop among olfact-ometrists.
The theory of signal detectability allows quantitative con-sideration of hitherto unmeasurable aspects of subject performance. Originally put forward as a theory appropriate for the use of communic-ation engineers (Peterson, Birdsall and Fox, 1954) it has recently been wedded to statistical decision theory and applied to the human observer (0) . (Tanner and Swets, 1954). Instead of stimulus effect being considered as invariant and a subject who exdeeds an arbitrary false positive rate as being unreliable, the observer is seen as attempting to discriminate a signal from noise inherent in the system in which he operates. Noise may be the random neural activity within Ols central nervous system and/or either constant or varying physical environmental noise. 0 will be forced to take risks in order to maximize his gains taking into account the a priori probability of
.adopt a criterion for deciding whether a signal is present or not on any trial. Signals which reach criterion level or surpass it will be designated "signal present" while those that fail to reach the
criterion will be "signal absent" responses. There is the possibility that random fluctuations in noise may exceed the criterion and be interpreted as a signal.
Since noise varies randomly within O's nervous system and signals are superimposed upon it, overlapping Gaussian distributions of noise (N) and signal plus noise (S + N) can be thought of as being established centrally. This is shown in Fig. 2 where the abscissae represent either a "decision axis" or degree of neural activity in the
— decision making apparatus. The means of the distributions, XN. and X
S+N are separated by a distance d'Which is an indicator of 0's sensitivity. The greater the overlap of the two distributions, the smaller the
value of d' and the less sensitive is 0 to a given stimulus. In the limiting case of coincidence of distributions 0 is unable to distinguish between signal and noise i.e. d 0 and the "hit" rate and "false alarm" rates become equal. The criterion C
1 set by 0, is assumed to be constant under a given set of experimental conditions. It can be seen that C 1
cuts across both S and S + N distributions thus allowing for a small positive response rate. If the ordinates at C
1 are YS+N and YN for signal and noise distributions respectively, then the likelihood ratio Y
S+N/1N (ca1led48) provides a measure of O's tendency to use hits or false alarms as responses i.e. his response bias.
A
will become unity when the criter-ion is set at the inter-sectcriter-ion of the two distributcriter-ions (i.e. 0 has no bias) and less than unity when set well within the noise distribution' . (bias towards reporting "signal absent").Pro
ba
bi
li
ty
•ri 07
a)
— X
+N dl
4--
-3 -2 -1
X 0 +1 +2 C1 _ +3 +4
Fig. 2. Distributions of signal and noise. The mean of the noise distribution, XN , is set at zero and that of the signal distribution,
- sensitivity, the other of bias. This is a considerable advance on the threshold theories where bias estimates are not considered other than forcing 0 to adopt a high criterion and forming "signal absent" responses.
PRACTICAL IMPLEMENTATION OF THE THEORY OF SIGNAL DETECTABILITY
A priori probabilities of signal and noise occurence . are usually set at 0.50 each, except in those experiments where probabilty • is used as an independent variable. Four subject responses with
associated conditional probabilities are possible - (i) hits i.e. correct detections (ii) misses, (iii) false alarms (iv) correct negative responses. Hit rate is designated by the symbols P (S/s),
the conditional probability of a signal being interpreted as a signal by 0, and false alarm rate by P (S/n).
The criterion of Ols response can be manipulated by the experimenter (E) so that values of P (S/s) and P (S/n) can be obtained for a particular response criterion. P (S/s) and P (S/n) are determined for at least five criterion points and a receiver operating character-istic curve (ROC) is traced out by plotting P (S/s) against P (S/n) as shown in Fig. 3. The proportion of area under the ROC curve can be
calculated and P (A), a non-parametric measure of sensitivity determined. Since dt can only be used when S and S+N distributions are Gaussian
and of equal variance, P (A) and several other measures e.g. del andAm are used in cases of non-Gaussian and unequal variance situations. A double-probability plot of P (S/s) against P (S/n) yields a straight line graph from which d', d e l or4m and the ratio of standard deviations of signal to noise distributions can be determined.
DETECTION METHODS AND THEIR SUITABILITY FOR USE IN OLFACTION EXPERIMENTS
1.0
0.8
0.6
0.4
0.2
0.0 P (S/s)
0.0 0.2 0.4 , 0.6
P (S/n)
Fig. 3. ROC curve based on five criterion points (1 — 5).
1.0
power of a derived statistic and the time required to obtain it. The inter-trial period required for complete recovery of the olfactory system has been shown to be of the order of 0.5 minutes at least (KOster, 1965). Cfieesman (1972) advocates the use of even longer periods to be certain of recovery. This imposes severe restrictions on the number of trials that can be undergone by 0 in one session. Fatigue, boredom and attention effects can seriously Interfere with Ols performance if sessions are prolonged. Thus while it is possible to maintain high rates of auditory stimulus presentation per three hour sessions, no more than several hundred trials are possible wi .6h
olfactory stimuli. E must decide whether to combine results from different sessions or whether to settle for a less powerful measure such as P(A). The three principal methods used in Signal Detectability are now discussed.
THE SINGLE-INTERVAL YES-NO PROCEDURE
0 is limited to "yes" and "no" responses only. Decision criteria may be changed by either varying the a priori probability of signal occurence, varying the pay-off rewards and costs, or requir-ing 0 to adopt a "strict", "medium" or "lax" criterion. A minimum of 500 trials per point on the ROC curve is recommended (Green and Swets, 1966). If five points are sufficient to yield a reliable curve then 2500 trials are necessary to give values of dl and It is impossible for 0 to undergo such a large number of trials in one session when
olfactory stimuli are used.
THE RATING PROCEDURE
This approach is based on the assumption that 0 can deal
26
of signal presence or absence by using categories ranging from utmost certainty of signal presence to utmost certainty of signal absence. Up to six categories are generally used although an
infinite number of categories have been used in at least one experiment incorporating the use of a sliding marker on a rule (Watson, Rilling and Bourbon, 1964). The raw data are compressed to yield hit and false alarm rates for a number of criteria equal to one less than the
number of categories. The disadvantage of this method is that the points on the ROC curve are not independent as in the yes-no procedure. However, only 500 trials are needed to attain reliability if six
categories are used, and this is a more attractive proposition for olfactametrists.
In view of the considerably smaller number of trials required with the rating method as against the yes-no method, various researchers have attempted to compare the two procedures in similar experimental
situations. Egan, Schuldan and Greenberg (1959) and Emmerich (1968) found that both methods produced similar ROC curves with auditory signals, whereas Markowitz and Swets (1967) consistently reported ROC curve slopes of less than unity with the rating procedure. However, the fact that Egan and Emmerich varied a priori probability of signal occurence while Markowitz varied subject instruction may partly account for the disparate results.
THE TWO-INTERVAL FORCED-CHOICED PROCEDURE
The signal occurs in either of two temporal intervals occuring consecutively. It is an economical method and tends to minimize bias since signals are assigned randomly to the two intervals. The long recovery period in olfaction limits its usefulness.
bias characteristics (Green and Swets, 1966; McNicol, 1972) yet Treisman and Watts (1966) have established a statistical decision model for
absolute and difference thresholds obtained by the method of constant stimuli. Threshold measures, e.g. the Crozier ratio, are shown to be indicative of bias and d' estimates predicted from threshold data are . in line with those obtained using signal detectability techniques. That common features of both theories can be incorporated in a single theory offers the olfactometrist some limited comparison between the abundance of threshold determinations present in the literature and
the relatively few but growing number of signal detectability experiments. Physiological evidence supporting the statistical decision
theory approach to sensitivity measurement in humans is given by Bauer et al.. (1972). Unanaesthetized cats with electrodes implanted in their brainstem auditory nuclei were subjected to auditory stimuli which were interpreted according to a statistical decision model programmed into a digital computor. Psychometric functions were very similar to those of human O's using identical stimuli.
Olfactometrists have been slow to make use of signal detect-ability techniques. Semb (1968) stated that "sensory coding in the olfactory system had not been examined within the context of detection theory" until the appearance of his paper. This could be the result of
the tedious nature of olfactory experiments compared to the ease of administration of visual and auditory experimentation. The theory of
signal detectability, while providing a more "pure" measure of olfactory sensitivity, is tied to a relatively large number.of . trials in its
CHAPTER
5.
OLFACTORY ADAPTATION AND
opouR
CLASSIFICATIONOlfactory adaptation is well represented in psychological literature, the experimental study of the phenomenon dating back to the latter half of the nineteenth century (Aronsohn 1886; Zwaardemaker, 1895). Adaptation occurs when an observer (0) experiences a reduction of sensitivity to a stimulus either as a result of continuous exposure to that stimulus or by repeated contact with the same or different stimulus superimposed on the initial stimulus. Thus it is possible to distinguish between temporal and intensity aspects of adaptation although temporal aspects must, of necessity, be considered when intensity effects of adapting stimuli are being studied.
Adaptation curves (Ekman, Berglund, Berglund and Lindvall, 1967) and recovery curves (Stuiver, 1958) of simple odourous compounds show an exponential change in sensitivity with time. However further studies (Cain and Engen,
1969;
Berglund, Berglund, Engen and Lindvall, 1971) cast doubt on this generally accepted notion which Berglund suggests is an artifactual result arising from the experimenter's (E) inadequate methods of instruction to O. Possibly the differences of opinion arise from the discontinuous nature of the olfactory receptive process in that stimulus input is separated by regular intervals of expiration. During this time adaptation effects will, very quickly reach a maximum and dissipate slowly thereby reducing cumulative effects.29
two conditions viz, co-adaptation when adapting and test stimuli are identical and cross-adaptation when they are different. There is abundant evidence to show that co-adaptation processes have the more marked effect on sensitivity. Cross-adaptation is less severe and may
even facilitate sensitivity (Engen and Bosack, 1969; Corbit, 1969; Corbit and Engen, 1971). Cross-facilitation has received limited attention as yet and is in need of further experimental investigation.
ADAPTAT ION hlEASITIMENT
Adaptation studies may be divided into two classes - those in which stimuli at near threshold concentration have been used and those employing suprathreshold stimuli.
Cheesman, Mayne and Townsend (Cheesman and Mayne, 1953; Mayne, 1953; Cheesman and Townsend, 1956; Townsend, 1956), using the
sniff-bottle technique and a wide range of adapting stimuli concentrations have shown that the group threshold increases in a systematic manner as the adapting stimulus concentration is increased. The results of later experiments (Cheesman, 1972) incorporating air-dilution techniques of stimulus presentation lack the consistency of the earlier ones probably because of changing experimental conditions over the nine-year test period. Moncrieff (1956, 1959) repeated the Cheesman-type investigation and found support for Cheesman's proposition that a plot of the logarithm of the adaptive odour threshold concentration against the logarithm of adapting odour concentration yields a straight line. (Moncrieff used
•1 the ordinate log.
threshold prior to adaptation. Thresholds were based on 45 trials only). Cheesman points out that this relation holds only for a limited range of adapting odour concentration, probably up to 15 times adaptive odour threshold concentration.
Ekman et al. (1967) criticise the threshold experiments
arguing that processes of adaptation at supraliminal intensities cannot be inferred from such studies. As an alternative, scaling methods ) including direct scaling procedures, ratio estimation and magnitude estimation have been used to examine the intensity-sensitivity relation of suprathreshold odours (Engen, 1964; Gregson, Mitchell, Simmonds and Wells, 1969; Berglund, Berglund, Engen and Ekman, 1972; Cain, 1971). The findings support the power law of Reese and Stevens (19601 the
exponent of the function being less than unity. The effect of adaptation on the value of n has been determined when adapting and adaptive odour concentrations are subjectively equal. Pryor, Steinmetz and Stone (1970) and Cain and Engen (1969) report an increase in the value of n under adaptation conditions while Mitchell and McBride (1971) report a decrease. The use of different Scaling techniques and the limited number of odours investigated does not allow for generalization, but a
combination of scaling and threshold approaches has been put forward as suitable to the study of adaptation (Pryor, Steinmetz and Stone, 1970). The application of signal detectability theory to adaptation has only recently been tested (Corbit, 1969; Corbit and &igen, 1971; Berglund, Berglund, Engen and Lindvall, 1971). Berglund et al. developed a model of adaptation In which duration effects result in an equal
31
The relative contribution of peripheral and central factors
to olfactory adaptation has been clarified somewhat by electrophysiological measurement. Although Ottoson (1956) has shown that peripheral adaptation
can occur in the frog, Adrian (1954) places emphasis on the disruption and subsequent restoration of the underlying rhythmic electrical
activity in the olfactory bulb. Elsberg (1936) viewed adaptation as a central phenomenon resulting from the blockage of neural pathways from perception areas to discrimination areas of the brain. Koster (1965) and Moncrieff (1956) believe that most experiments on. adaptation are
measuring central rather than peripheral (or receptor) adaptation. If adaptation is primarily central in origin it may provide an indirect
means of investigating odour discrimination and hence odour classification.
• ODOUR CLASSIFICATION
Many attempts have been made to classify odours on the basis of molecular characteristics such as size and shape of the molecule, adsorption properties, absorption and emission spectra and solubility. All have lacked consistency, which has prompted Pfaffman to conclude that "no single stimulus-dimension is likely to account for the complex olfactory system" (Pfaffman, 1951, 1956).
The most satisfactory classification, at the operational,. level, is the stereochemical theory of Amoore (1952, 1963, 1964) in which seven "primary" odours based on molecular size and shape are proposed. Implicit in the theory is the notion of specific types of receptor capable of accommodating a "primary" odour.
greater adapting effects on each other than non-Similar ones. Cheesman and 14ayne (1953) developed this concept so that a derived measure viz. the slope of a log-log plot of threshold elevation against adapting stimulus concentration, was used as a "degree of Community" between the four odours investigated. Co-adaptation conditions yielded slopes of +0.7 whereas cross-adaptation slopes were always less than +0.7 and were not symmetrical for pairs of odours. Townsend (1956) repeated and reanalysed some of the earlier work and found that the number of subjects used to calculate a group threshold and the position of the threshold in the series of presentation stimulus were important
determinants of the slopes. Facilitatory effects of adaptation have not been considered by Cheesman and his co-workers, but if facilitation is established as fact consideration will have to be given to the meaning of negative slopes in the Cheesman hypothesis.
Inter-subject and intra-subject threshold variation tends to reduce the reliability of derived measures and Amoore (1972) views adaptation measurement as being supplementary to specific anosmia studies in classification research. He claims that adaptation alone cannot identify primary odours but can lend support to similarity scaling and confusion methods. Engen (1963) comes to a similar con-clusion supported by results of a factor analysis of odours likeness.. It appears that adaptation is a generally less powerful method than similarity scaling methods. But it is highly selective.
Adaptation measurement, as a specific example of olfactory sensitivity measurement, is worthy of investigation using the signal detectability paradigm. This is because any odour classification
33
34
CHAPTER 6.
THE AIM AND METHOD OF THE PRESENT STUDY
The aim of the experimental programme was to compare the applicability of threshold and signal detectability techniques to the study of olfactory acuity and adaptation within an established frame-work of operations viz, that adopted by Cheesnan and Mayne (1955). It was hoped to determine whether the allowance for subject response bias in the signal detectability paradigm was relevant to the Cheesman
approach since ultimately the building up of a classificatory system of odours based on olfactory adaptation measurement could be affected if subject response bias was a significant factor. The classification matrix developed by Cheesman and Mayne (1955), extended by Townsend
(1956) and later revised by Cheesman (1972), is based on mutual adaptation effects of one compound on another with minimum reference to the subject's decision-making characteristics except where related to stimulus intensity e.g. Mayne (1953) considered that subliminal adapting odour concentrations were inappropriate since the subject
had a standard "absence" of odour with which to compare the test stimulus whereas at supraliminal concentrations he did nat.
It was planned to extend the concentration range of adapting stimuli beyond the limits set by Cheesman and Mayne to incorporate concentrations up to forty times absolute threshold. This seemed desirable in view of the low upper limit of about ten to fifteen times threshold used by Cheeaman and Mayne (1953). The choice of test
and Lindvall, 1971). A concentration at or near threshold is used most often. It seemed that valuable information would be gained if the range of test stimuli were extended either side of threshold, rather than relying on an arbitrary test concentration which could yield unique results.
The experiments undertaken by Cheesman, Mayne and Townsend involved many subjects undergoing a limited number of tests on several odours. The proposed study was concerned with the intensive testing of a few subjects with one odour stimulus (isopropyl alcohol). It was anticipated that intra-subject variability of response might be blore readily examined by this means than by employing group measures of sensitivity. Furthermore, a comparison of psychophysical methods would be set within the same individual.
36
In studies of vision the use of more than one stimulus
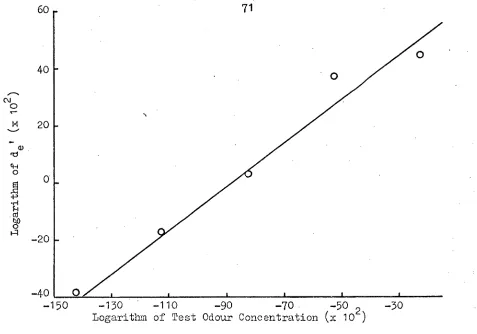
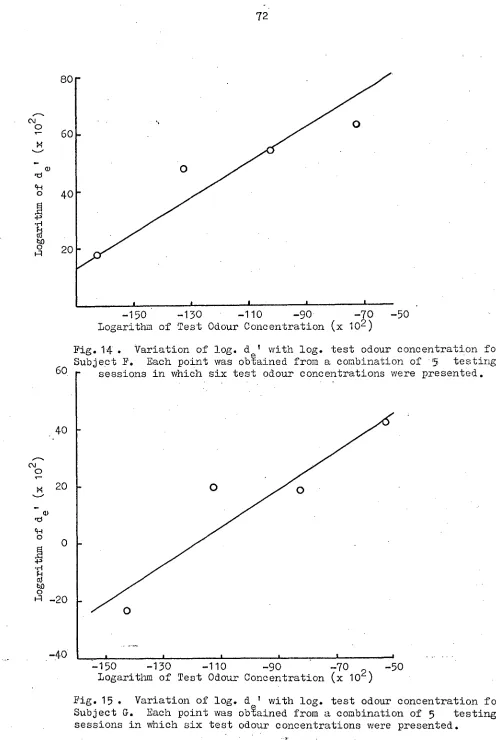
intensity within a single session has been Shown to be a valid procedure when results are analysed by signal detection methods (Ehmerich, 1968). Thus if multiple test stimulus concentrations were incorporated into olfactory sessions and several adapting stimulus concentrations were used over sessions it should be possible to (a) trace the variation of a sensitivity index with test stimulus concentration for a given adapting stimulus concentration, and (b) trace this relationship over several different adapting concentrations extracting some index of adaptability e.g. the index-test concentration relationship could be linear for a given adapting concentration as it is when adapting
concentration is zero (Semb, 1968). The gradient of the plot could be characteristic of the test stimulus compound and could be similar for all adapting concentrations or alternatively the plotting of the gradient against adapting concentration could give a measure of the degree of "communality" between test and adapting stimuli which would be independent of observer bias.
In summary, the aim of the present study was to Investigate changes in sensitivity using a small number of subjects in an intensive testing programme under conditions of co-adaptation and non-adaptation. A direct comparison was to be made between variants of standard signal detectability technique and threshold procedures.
OUTLINE OF PROGRAMHE
threshold over sessions was to serve as a guide to the
extent of chance fluctuations in threshold in Experiment IIIa.
Experiment II. Use of signal detectability rating techniques to investigate concentration/sensitivity relationships. The
rating technique was preferred to the yes-no technique in
view of the economy of time of the former method. The results
of using multiple test stimulus concentrations in sessions
were to be compared with results in single-test sessions.
Experiment III. The variation of (a) absolute threshold,. and (b) signal detectability sensitivity measures during olfactory
co-adaptation. The results of Experiment Illa were to be
compared with those obtained in group threshold experiments
conducted by Mayne (1953) and Cheesman (1972). The feasibility
of using a signal detectability index as a measure of the
extent of co-adaptation was to be considered in the light
of the results of Experiment IIIb.
Each experiment was to be performed using both the sniff-bottle
technique and the air-dilution technique of stimulus
presenta-tion.
METHOD
SUBJECTS
Two panels (X and Y) of paid subjects were used, panel X
. working with the sniff-bottle. technique and panel Y with the
air-dilution form of presentation. Panel X consisted of three males,
Subjects A, B and C aged 19, 20 and 21 years respectively; panel Y
Subjects E, F and G9 aged 24, 21 and 22 years respectively. All
were undergraduate students of the University of Tasmania. Subject
F was the only smoker, smoking about fifteen cigarettes per day.
Male subjects were preferred to female subjects because of
the variability of female responses to some odorous stimuli with the
menstrual cycle (Koster, 1965). Subjects were medically examined to
ensure freedom from nasal obstruction and allergies.
APPARATUS
The Sniff-Bottle
Twelve 125 ml. dark glass, wide-mouthed, glass stopnered
bottles were used to hold aqueous solutions of the stimulus. These
were mounted on a 101 cm. diameter rotatable table which was set up on
a bench adjacent to the wall dividing test room from laboratory. The
centre point of the table was located so that the table overlapped
through openings into the test room allowing smelling stations to be
'presented individually to S seated in the test room. The openings were
boxed in and a lift-up lid provided on the test room side so that the
smelling stations could be chosen by the experimenter (E) and presented
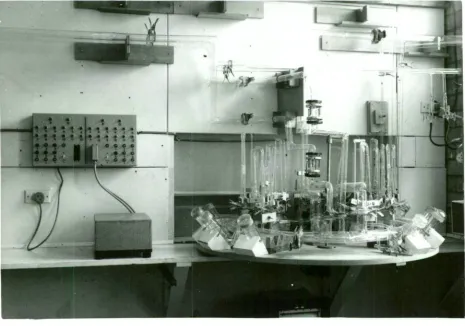
to S at the appropriate time. Fig.
4
shows the table mounted in thelaboratory. The bottle M containing the adapting odour was originally
attached to the bench in front of S but was later removed so that S
could pick up the bottle during testing, this being a less awkward
procedure.
The Air-Dilution Olfactometer-
The air-dilution olfactometer designed by Cheesman (Cheesman
and Kirkby,
1959;
Cheesman, 1972) was modified for testing ofindivid-ual subjects by incorporating a circular array of movable smelling
s tations use d in the sniff—bo ttle exp eriments. Ro tatable table
•
••:).
•
smelling points and their associated circular air, odour and exhaust
lines were mounted on the rotatable table described previously.
Rotation was achieved by spherical ground-glass joints as used in all
the apparatus with the added protection of minimum tension clamps
at the points of rotation.
The air purifier, saturator and •thermostat devices were those
used in the previous group threshold studies. Capillary tubes, although
compacted, followed the same dilution ratios as used by Cheesman
(Table 1) and were calibrated at a pressure difference of 5 cm. head of
water. A fixed adapting smelling point was positioned to one side of
the test point opening so that S could manipulate its cap with his
left hand and the test point cap with his right hand (Fig. 6).
Provision was made for twelve adapting smelling points of varying
concentrations to be used in conjunction with the twelve movable test
points.
A second table and signaling device was set up next to the
-first to enable two subjects to be tested at once. Subjects were
separated by a screen.
Adapting line . capillary tubes were identical to those used
in previous experiments (Cheesman, 1972). The dilution ratios used
appear in Table 2 and the arrangement of the capillaries is shown in
Fig. 7. Allowance had to be made for the reduced number of adapting
smelling points and a "bleed" at the exhaust end of the apparatus was
required to ensure standard flow rate of 1,000 ml./min. through these
points.
Communication between E and S was effected by a system of
buttons and coloured lamps in all experiments thus avoiding direct
SE interaction. S's display board consisted of an amber warning
42
TABLE 1.
Dilution ratios of capillary tubes used to supply test smelling points.
Designation Rate of flow in Dilution Ratio
'1./Min. at 5 cm. pressure difference
640 0.640
640A 0.360
320 0.320
320A 0.680
160 0.160
160A 0.840
80 0.080
80A 0.920
40 0.040
40A 0.960
20 0.020
20A 0.980
10 0.010
10A 0.990
5
0.0055A' 0.995
2.5 0.0025
205A 0.9975
1,000Q 10000
1,000R 10000
1,000S 1.000
1 : 1.60
1 : 3.10
1 : 6.25
1 : 12.5
1 •: 25.0
1 : 50.0
1 : 100
1 : 200
1 : 400
"blanks"
01.±AGIMil
Fig. 6. Subject apparatus: adapting smelling point (left) and test smelling point (right) with subject's signaling
Designation A = pure air FO = odour-laden
air
Rate of flow in 1./Min. at 5 cm. pressure difference
. .Theoretical dilution ratio
*FA 1200 12.00
FO ZERO 0.00 "blank"
FO 150 0.150 1 : 80
FO 240 0.240 1 : 50
FO 380 0.380 1 : 31.6
FO 545 0.545 1 : 22.0
FO 900 0.900 1 : 13.3
Actual dilution ratio
- "blank" 1 : 104.3 1 :75.0 1 : 42.1 1 : 25.0 1 : 16.7
44
TABLE 2.
Dilution ratios of capillary tubes used to supply adapting amelling points
46
of buttons labelled Y, N and U; and a second set of buttons labelled
1 through 6. E's display board contained buttons labelled 1 through 12
which were used to illuminate S's amber warning light; buttons R and G
which illuminated'Sls'red and green light respectively; a red light
a green light and an amber light which corresponded to S's buttons
N, Y and U and a set of six clear lights labelled 1 through 6
corresponded to S's set of buttons of the same nomenclature.
S indicated his responses to E by pressing either button
for a positive response, button N for a negative response or button
U for an uncertain response, which illuminated the green light, the
red light or the amber light respectively on E's display board.
E could inform S of the presence or absence of the stimulus
by pressing either button G for stimulus presence or button R for
stimulus absence, which illuminated the green light or the red light
respectively on S's display board. The six buttons numbered 1 to 6
and E's corresponding clear lights were used when rating techniques
were employed.
E's choice of smelling point and S's corresponding response
were recorded automatically by means of a moving roll of photographic
paper and a row of microlamps contained in a light-proof box used in
conjunction with the signaling system.
An air lock, to prevent stray odours reaching 52 was
pro-duced by building a wooden enclosure with a second door immediately
inside the test room entrance. Rubber seals were attached to the
bottom of eaCh door. Air was circulated in the test room by the use
.of •nlet-and exhaust fans.. Carewastakento.•ensure.that air pressure.:
in the test room always exceeded that of the laboratory and preparation
rooms so that the test room was as free as possible from foreign odours.
maintain an ambient temperature of 18 0 0.
THE STIMULUS
Isopropyl Alcohol, CH
3 CH(OH) CH3 was chosen as test stimulus for its hedonically neutral properties and low trigeminal
component. It has been described by Moncrieff (1944) as having a
slightly spiritous odour and a markedly lower olfactory threshold than
the trigeminal or irritant threshold. Thus there is little possiblity
of subjects being offended by the odour at the dilutions used for
testing purposes and there should be no confusion between olfactory and
trigeminal thresholds.
A fresh supply of isopropyl alcohol of sufficient quantity
for the entire programme, of Analytical Reagent standard of purity
(Appendix I), was obtained initially and stored in a set of dark glass
stoppered reagent bottles so that at no time was there an air space of
more than ten per cent of total volume above the liquid surface. In
this way reasonable standards of purity were maintained over the rather
protracted testing period.
PREPARATION OF THE STIMULUS Sniff-Bottle Technique
Since contamination is a very severe threat to quantitative .
work in olfaction, the cleaning of test bottles was giii . en careful
consideration. The following steps were taken:
(i) Washing with much cold tap water and brushing the necks . _
with a stiff, coarse-fibred bottle brush.
(ii) Immersion in a sulphuric acid-chromate bath for fifteen
48
(iii) Rinsing in much cold tap water.
(iv) Draining, rinsing and filling with distilled water and
replacing cap.
(v) Immersion in distilled water in a sterilizer. . Boiling for
five to six hours.
(vi) Drying for three hours at 110 ° 0. in a drying oven.
A fresh set of bottles was brought into operation after every
third testing session except where ageing effeCts of the stimulus
material were investigated.
A pipette technique was developed for solution preparation.
In Experiments I and III (a) a standard solution ;\ I of either 16.0 x .-
10-2M or 8.0 x 10 21v1 concentration was successively diluted with boiled
tap water to give a binary series of nine solution concentrations. In
addition three "blanks" consisting of boiled tap water only were added
to the series to give a ratio of 0.75 : 0.25 stimuli to "blanks". In
Experiments II and III (b) the ratio was 0.50 : 0.50, six smelling
"-points containing solutions of equal strength while the remainder
contained boiled tap water only. Boiled tap water was used as diluent
in preference to distilled water which has a "flat" smell. "Odourless"
organic compounds such as diethyl phthalate were considered unsuitable
since it is questionable whether they are truly.odourless. Tap water
was expected to resemble the chemical composition of the olfactory
membrane to an extent thus making it potentially less odouraus than
other diluents.
Air Dilution Technioue
450 ml0 of undiluted isopropyl alcohol was placed in the
.test and adapting line saturators and trial runs were undertaken to
.concentrations presented to subjects was within reasonable limits
of subject sensitivity i.e. subthreshold and very high concentrations
were avoided. This was not always possible when two subjects of
markedly different olfactory acuity were tested simultaneously.
However subjects of similar olfactory sensitivity were grouped together
for testing as often as time table arrangements would allow.
E monitored flow rates continuously by use of "rotamPter"
guages so that the standard flow rate (1,000M1./min.) was maintained
in all smelling points. A constant pressure difference of 5 cm. of
water in the air and odour lines was effected by E monitoring the
CHAPTER
7.
PROCEDURES AND RESULTS OF EXPERIMENTS
GENERAL PROCEDURES
Subjects employed the natural sniff in all experiments.
Experimental sessions were always of three hours duration and each
subject attended the Olfaction Unit twice weekly. Each subject
worked at the same time of day each week in order to offset any. .-
diurnal variation in olfactory sensitivity that might exist.
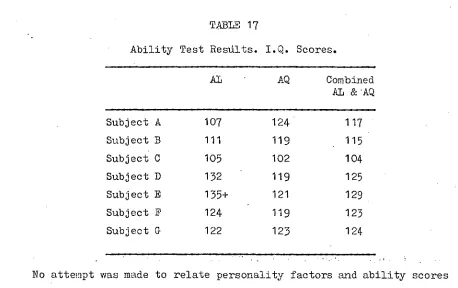
The A.C.E.R. Advanced General Ability Test forms AL and AQ,
and the 16-Personality Factor Test (Cattell, 1965) were administered
to each subject before being employed by the Olfaction Unit.
Three series of stimulus presentations were generated from
Rand's "1 Million Random Digits" (Rand Corporation, 1955). Each series
incorporated twenty-five presentations of each of twelve smelling
stations i.e. three hundred trials which were grouped in blocks of
'fifty. The only specifications, other than randomness, in designing
sequences of presentations were that each block of trials begin with a
test station containing odour and that no more than three consecutive
presentations of any one station should occur. The first forty-eight
presentations served to assist S to attain stability of response and
were not used in calculations thus leaving for analysis two hundred and
fifty-, two trials per three hour sessions. Each series was used in a
set order (non-random) to avoid combining results from sessions using
the same series which might tend to accentuate sequence effects
inherent in a series.
51
11recoveryII of the subject. A rest break of five minutes was given
after each block of fifty trials.
The first two sessions of individual experiments that Ss
attended was not iriOluded in the calculation of results. They were
considered to be training sessions during which E was available to
assist in any difficulties in procedure that Ss might be experiencing.
EXPERIMENT Is (Sniff-Bottle Technioue)
Procedure
Panel X Subjects A, B and C attended eight sessions spread over three weeks during which they undertook 2,400 trials each in order
-2 ,
that six thresholds could be calculated per subject. An 8.0 x: 10 -M
standard solution of isopropanol was used to prepare the binary series
of nine solution concentrations presented to S. This was renewed after
every second session.
Subjects were provided with the following type-written
instructions:
"There must be an interval of at least one hour between your
last meal and the commencement of testing. No perfumes or after-shave
lotions and the like to be worn on test days.
It is important that instructions be followed exactly as
outlined below so that standardized conditions can be attained.
Detailed Instructions
1. Just before the commencement Of testing you will be given a
bottle labelled "S" which will contain a sample of the chemical
• compound to be used as stimulus in the experimental session.
Remove the lid of bottle "S" and take one sniff to acquaint
yourself with the odour. Replace the lid and hand the bottle