TESTING
OF
PRINCESS RIVER BRIDGE
by
Rodney William McGee Bachelor of Engineering with Honours
Graduate Diploma of Business in Professional Management Associate Diploma in Emergency Management Bachelor of Social Science (Emergency Management)
Submitted in fulfilment of the requirements
for the degree of Master of Engineering
STATEMENTS
Declaration
This Thesis contains no material which has been accepted for a degree or diploma by the University of Tasmania or any other institution, and to the best of my knowledge and belief no material previously published or written by another person except where due acknowledgment is made in the text of the Thesis.
Authority of access
This Thesis may be made available for loan and limited copying in accordance with the Copyright Act 1968.
Acknowledgments
Assistance given by others in the test program is detailed in section 20 of the report.
AUTHOR
The author is Manager Asset Strategies with the Department of Transport, Tasmania.
He graduated from the University of Tasmania with the degree of Bachelor of Engineering with Honours in 1977 and commenced work with the then Public Works Department in road and bridge construction. This was followed by a period of more than 11 years designing a range of bridges and other civil engineering structures.
In February 1990, the author was appointed to the position of Asset Management Engineer Bridges with responsibility for more than 1200 bridges, major culverts, marine structures and other civil engineering structures managed by the Department. The position also included responsibility for emergency management. He is also convenor of the AUSTROADS concrete durability project.
He has authored or co-authored sixteen technical papers in subject areas including bridge management, bridge design, concrete durability, diagnostic and assessment procedures for bridges, lead paint management, conservation of historic bridges, alkali aggregate reactivity, differential temperature in bridges and critical incident stress management.
Roles in the Princess River Bridge testing included: • identification of the possibility of testing the bridge • concept development
• project management
• preliminary design in conjunction with others acknowledged in the report • site testing
Abstract
CONTENTS
1. Introduction 1
2. Notation 2
3. Bridge and Site 4
4. Objectives of Test Program 12
5. Literature Review 14
6. Climate and Hydrology 32
7. Instrumentation 41
8. Loading 45
9. Dimensional Survey 48
10. Cover Surveys 55
11. Pre-existing Cracking 61
12. Concrete Performance 66
13. Steel Performance 74
14. Individual Beam Testing 75
15. Dynamic Response 106
16. Load Distribution 120
17. Punching Shear 145
18. Ultimate Load 157
19. Summary and Conclusions 175
20. Acknowledgments 178
References 179
APPENDICES
ABSTRACT
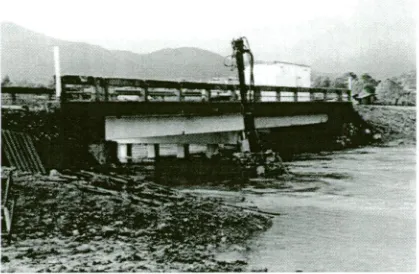
Princess River Bridge was a two span reinforced concrete T-beam bridge located on the Lyell Highway on Tasmania's west coast. It was inundated in 1991 by the King River Hydro Electric Power Development.
A program of testing was undertaken prior to inundation to assist with the understanding of bridge performance and the overall management of the State's bridge asset The range of testing included dimensional, cracking and cover surveys, concrete and steel testing, dynamic response, load distribution, deck punching shear behaviour and ultimate capacity. While bridge dimensions were generally within tolerance, 48% of measurements of cover to reinforcement were outside the range permitted in the current Australian Standard. The variability of cover is however consistent with that reported for bridges in the Sydney area and for other Tasmanian bridges.
Little flexural cracking was evident in the beams prior to testing. There was however a significant amount of random cracking in the deck soffit, which is likely to have been attributable to the permeability of the timber formwork and consequent implications for curing.
Concrete testing showed high strength due to relatively high cement contents. Concrete quality and the high relative humidities at the site would have contributed to the minimal carbonation. Steel tensile strength of 300 MPa was higher than the anticipated 230 to 250 MPa.
Measurements of dynamic response were able to discern the removal of sections of railing, but required substantial damage to beam reinforcement before observable changes in response occurred.
There was reasonable correlation between calculated and measured load distributions, although strains were underestimated.
1. INTRODUCTION 1.1 Introduction
The Princess River Bridge was located on Tasmania's west coast on the Lyell Highway, about 20 kilometres south of Queenstown. It was one of about sixty reinforced concrete 1- beam bridges managed by the then Department of Roads and Transport.
The King River hydro-electric power development resulted in the flooding of the section of highway containing the bridge, providing an opportunity for a range of full-scale testing of a bridge in generally good condition.
1.2 Objectives
A program of testing was developed with the following objectives: • To assist with rating of the State's bridges
• To assist with the calibration of bridge assessment software • To confirm the validity of bridge design methods
• To assist with the assessment of durability of existing structures. • To improve the Department's understanding of bridge behaviour. 1.3 Testing Program
The range of site testing was as follows: • dimensional, cracking and cover surveys • concrete and steel testing
• dynamic response • load distribution
• punching shear behaviour of deck • ultimate load capacity.
In addition, two beams which had been rejected during construction and left at the site were subsequently tested in flexure and shear.
1.4 Test Program
On-site testing was undertaken between 29 July and 22 August 1991. Ground anchors were installed and steelwork fabricated some time prior to the site testing. Field testing commenced prior to the closure of the section of highway which included the Princess River Bridge. The opening of the new section of highway and Bradshaw Bridge occurred on 7 August 1991.
Severe weather conditions were encountered during the test program, with closures of the Lyell Highway due to snow on at least 8, 9, 13 and 16 August, reducing the scope of the testing that could be conducted because of the inability of personnel to travel to the west coast.
The beams were tested at the Department of Construction's Lutana quarry on 2 and 3 June 1992.
1.5 Other Organisations
2. NOTATION The following symbols are used in this report:
A, Area of reinforcing steel
A„ Area of compressive reinforcing steel As, Area of tensile reinforcing steel
Ab Cross-sectional area of flexural tensile reinforcement A„ Total area of web reinforcement within a distance s
Width of reinforced concrete member Longer side of rectangular element be, Effective width of T-beam flange
Compressive force
Cy Catchment runoff coefficient for return period Y Shorter side of rectangular element
c' Factor for calculation of crack width
• Bridge constant for evaluation of load distribution
Distance from the point at which crack width is being considered to the extreme compressive fibre of the concrete
Depth of reinforced concrete member Depth to neutral axis
Young's modulus of material • Strain
Fb Allowable bending stress
F', Concrete characteristic compressive strength F„ Allowable shear stress
f, Compressive stress f, Steel stress
• Shear modulus of material Load distribution factor Moment of inertia of section Torsional moment of inertia
Ratio of lever arm of resisting couple to depth d for a flexural concrete member depth from extreme compressive fibre to neutral axis of flexural concrete member • Effective span of a flexural member
1 Length of anchorage for ground anchor Bending moment
M' Effective moment capacity of concrete member • Specified cover to reinforcement
• Modular ratio
• Point load applied to member Proportion of reinforcing steel
Percentage of reinforcement at midspan
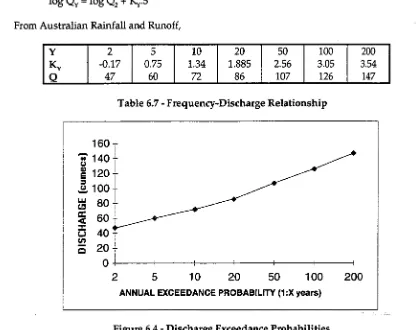
Qy Stream discharge for return period Y
Support reaction
• Radius of gyration of section in the direction of eccentricity or bending Centre to centre spacing of girders
Factor of safety for ground anchor • Spacing interval of web reinforcement so Cross sectional area of steel reinforcing bar • Tensile force
Capacity of prestressing anchorage
Mass per unit length of member or uniform load
✓ Shear force
37, Height to centroid of section
Section modulus
Factor for calculation of crack width 5 Deflection
c. Strain
Capacity reduction factor Material density
Poisson's ratio Shear stress Material density Reinforcement ratio a Bending stress
3. BRIDGE AND SITE
3.1 Description of the Bridge
Princess River Bridge was a reinforced concrete structure with two 10.5m spans and a width of 6.7m between kerbs. The superstructure comprised 6 precast beams of upright rectangular section in each span, with an insitu concrete deck to form a T-beam structure.
The pier and both abutments comprised driven square reinforced concrete piles with insitu crossheads.
Bearings were lead sheets.
The bridge was built in 1959 and 1960 under contract by Hillier and Regan. It is understood that piles and beams were precast in Launceston by the Port of Launceston Authority and that aggregates for the insitu concrete were transported from Launceston.
Design was undertaken by the then Department of Public Works, with the design loading being H20-S16 44 P60.
The bridge superstructure cross-section is shown in Figure 3.1.
Figure 3.1 - Bridge Cross-section
Condition prior to testing was generally good, with the exception of the reinforced concrete fence and railings where spalling had resulted from corrosion of the reinforcing steel due to low reinforcement cover.
3.2 Geology
The Mines Department geological map (1:250 000) of Queenstown (1974) shows the area of the bridge site to be underlain by alluvium, sand, gravel and talus, with a Lower Devonian-Silurian siltstone-shale sequence to the north west. No rock outcrops were observed at the bridge site.
A limited geotedmical survey was undertaken to assist with the design of the system for loading the structure.
The seismic survey showed a low velocity material (290 to 400m/s) to lm to 2.5m deep, followed by a material having an average seismic velocity of 1130 to 1420m/s to a depth varying between 6m and 12m, and thence a layer with an average seismic velocity of 4000 to 8000m/s.
Figure 3.2 - Drilling Rig used for Anchor Installation
3.3 Bridge Records
Department of Transport files include initial contract and tender information but minimal construction records. It is likely that site concrete was site batched and few if any concrete test cylinders taken. No records of compression tests have been identified.
The Port of Launceston Authority had no records for the precast elements.
Figure 3.3 - General Layout
.1
'7
1
.
4•Hti
H.
,
.r..›....w..47r
•
•
.f..2
0
.
..".
6
7.
•
4.•
,
'''''??
,417 •
4?
•
I
,
5
:
te:±
44 ""
k'
. fz
[image:12.562.102.781.61.488.2]i
Figure 3.4 - Abutments
8
sumaa
'new
pue
Jam
- 9-€
axam
1:4
1
—
t
i
I
•
•H
r.r% ri •
;
i:•:•,.,...=•••1 •
•
A
Figure 3.6 - Deck
01
4. OBJECTIVES OF TEST PROGRAM
4.1 Background
The Department of Transport and its predecessors, the Department of Transport and Works, Department of Roads and Transport, the Department of Main Roads and the Public Works Department, is and have been the Tasmanian State Government Department responsible for the management of the State's roads, bridges and a number of marine facilities. It formerly had management responsibility, but not ownership, of bridges on council roads but that responsibility now rests with councils themselves, with Departmental involvement limited to generalised advice on bridge issues.
A section of the former Lye11 Highway linking Hobart and Queenstown was flooded as part of the King River Power Development. The section of road contained two bridges:
• the King River Bridge, which had steel beams and timber deck supported on timber substructures
• the reinforced concrete Princess River Bridge.
The possibility of undertaking full scale testing of the Princess River Bridge was identified during a routine inspection of the bridge, and a test program developed.
There were five primary objectives of the testing program, which are described in more detail below. The objectives were:
• Rating of existing structures
• Calibration of bridge assessment software
• Confirmation of the validity of bridge design methods • Assessment of durability and reliability of existing structures • Improving the Department's understanding of bridge behaviour.
4.2 Rating of existing structures
There are about 60 reinforced concrete T-beam bridges on the classified road network with a replacement cost of the order of $30m. Years of completion range from 1926 to 1965, meaning that all were designed to loadings less than the current Austroads T44 design vehicle of 44t gross and current legal loading of 42.5t for a tria)de semi-trailer. Previous design loadings were H20-S16-44/MS18 with a 33t vehicle and the crusher train loading, which comprised a steam traction engine towing a mobile crushing plant.
A number of the bridges were assessed for structural adequacy as part of the introduction of RORVL A and C vehicle limits (41t and 42.5t gross legal mass for a tria)de semitrailer) into the State. The simplified methods used indicated stresses above those normally permissible in design codes, indicating a need for strengthening or replacement to maintain acceptable levels of risk for the travelling public.
Further, about three-quarters of the State's bridge stock is designed for the H20-516-44 loading or less. The average age of the stock is over 30 years, with deterioration exacerbating any deficiencies in load capacity.
The testing program was intended to assist with the rating of existing structures for acceptable routine and permit loadings by increasing confidence in analytical methods.
4.3 Calibration of bridge assessment software
At the time of testing, a generalised computer program for the assessment of existing bridges was being developed as Cambridge University as part of a research contract for the Transport and Road Research Laboratory.
4.4 Confirmation of the validity of bridge design methods
Few opportunities are available for the verification of the validity of the various methods and computer software used for the design of bridges. The testing provided the opportunity to validate the various methods used by the Department.
4.5 Assessment of durability of existing structures
Management of concrete bridges needs to consider rates of carbonation or chloride penetration or other deterioration processes such as sulphate attack or alkali aggregate reactivity, the quality of the concrete itself and the accuracy of construction. The test program was developed to provide data on a range of aspects of concrete durability for bridges in the Tasmanian west coast environment.
4.6 Improving the Department's understanding of bridge behaviour
Allied to the other objectives, the testing program was intended to provide an opportunity for design, construction and maintenance staff to observe all aspects of a bridge's behaviour.
4.7 Scope of Testing
To achieve the above objectives, the test program involved the following aspects: • Literature survey
• Collation of data on local climate and hydrology • Dimensional and cover surveys
• Measurements of pre-existing cracking • Evaluation of concrete and steel performance • Testing of individual beams
5. LITERATURE REVIEW
5.1 Introduction
An extensive literature review was undertaken as part of the Princess River Bridge test program and its reporting. Some of the relevant literature is described below.
5.2 Literature Review
5.2.1 Site Investigation of the Quality of Reinforcement Placement on Buildings and Bridges (Marrosszeky and Chew, 1989)
The paper reports the results of part of a research program undertaken at the Building Research Centre in New South Wales to investigate factors causing corrosion-induced durability faults in buildings.
The program studied the distribution and density of reinforcement corrosion induced faults on 95 buildings in the Sydney area from the coastline to 27Ian inland. A number of bridges were also studied.
The studies showed that the individual values and distribution of reinforcement covers varied greatly between projects. It was suggested that the actual cover that is achieved on site is influenced by such a complex combination of causes that no single factor could be identified as being more significant that any other. It was found that standards of reinforcement placement were higher for bridges than for buildings.
Results are shown diagrammatically in Figure 3.1, where N is the specified cover to reinforcement.
Figure 3.1 - Standards of Reinforcement Placement
5.2.2 Dimensional Variations in Reinforced-Concrete Members (Udoeyo and Ugbem, 1995)
The authors examined geometric variations in reinforced concrete members on three large project sites in Nigeria. All total of 3,380 measurements were taken, and analysed statistically. The study showed that increased levels of inspection reduced the variation in member sizes, and that normal distributions could be used for probability models of dimensional imperfections.
5.2.3 Effect of Core Diameter on Concrete Core Strengths (Bartlett and M'Gregor, 1994)
option where there are specific requirements, such as a length to diameter ratio of two with a thin section.
There has however been criticism that small diameter cores are unreliable. The paper reviews data from studies by others concerning the effect of specimen diameter on the magnitude and precision of the compressive strength of concrete cores.
Effects to be considered include size effects, core surface effects such as microcracking from drilling and cutting of aggregate particles, and inhomogeneity in concrete strength within a section.
The following conclusions were drawn:
1. The effect of damage to the surface layer in reducing the strength of small cores counteracts and overwhelms bias due to testing procedures or that might be explained by the weakest link theory.
2. The predicted average strength of a 2 inch diameter core is 94% of the predicted average strength of a 4 inch diameter core and 92% of the predicted average strength of a 6 inch diameter core.
3. Ratios of the average strength of 2 inch and 4 inch diameter cores have considerable scatter.
4. The core length-to-diameter ratio effect is greater for 2 inch diameter cores than it is for 4 inch diameter cores. If a correction factor of 0.88 is used to reduce the strength of a 4 inch diameter core with 1/d = 1 to the equivalent strength of a core with 1/d = 2, then a correction factor of about 0.80 should be used for 2 inch diameter cores.
5. The variability of measured strengths of small diameter cores is particularly sensitive to being inflated by the variability of insitu strength across the section being cored.
6. For cores with large diameters, the coefficient of variation of the core strength depends mostly on the variability of the undamaged interior region. For smaller diameter cores, the coefficient of variation depends mostly on the variance of the thickness of the damaged region.
5.2.4 A New Look at Shrinkage Cracking (Base and Murray, 1982)
Shrinkage cracks are induced in structures by shrinkage and thermal strains in the concrete. For the purposes of their paper, Base and Murray define shrinkage cracks as those that penetrate completely through the member. Detrimental consequences can include leakage, tiling damage in floors, and aesthetics. The paper discusses the difference between shrinkage and flexural cracking, and presents design formulae, graphs and procedures for limiting shrinkage cracking in structures.
5.2.5 Causes, Evaluation and Repair of Cracks in Concrete Structures (AC! Committee 224)
Cracks in concrete have many causes. They may affect appearance only, or they may indicate structural distress or a lack of durability. Their significance depends on the type of structure as well as the nature of the cracking. Successful repair depends on knowing the causes of the cracking and selecting the appropriate repair method. The report discusses causes and control of cracking in both plastic and hardened concrete, evaluation of cracking and methods of crack repair.
5.2.6 Lateral Distribution Factors for Highway Bridges (Bakht and Moses, 1988)
The American Association of State Highway and Transportation Officials (AASHTO) specifications for highway bridge design provide simplistic distribution factors, which lead to fairly conservative designs. The simplicity of the AASHTO method is predicated on three basic assumptions:
1. the transverse pattern of distribution of a load effect is independent of the longitudinal position of the loads and the reference sections
3. the bridge conforms to a basic form and it does not possess any complicating factors such as edge stiffening, skew, etc.
The paper discusses the limitations of the AASHTO method and presents the method incorporated in the Ontario Highway Bridge Design Code, which uses two characterising parameters, an additional dimensionless parameter and a series of charts. Different factors are used for bending and for shear. Different loading conditions are used for fatigue design.
The method was validated by comparing its results to those obtained by the rigorous finite element analysis of several actual bridges.
5.2.7 Wheel Load Distribution on Simply Supported Skew I-Beam Composite Bridges (Bishara, Liu and El-Ali, 1993)
The paper presents distribution factor expressions for wheel load distributions to the interior and exterior girders of multibeam composite steel girder bridges derived from finite element analyses of 36 bridges of varying spans, widths and skews and with differing cross-bracing configurations. The validity of the results was confirmed by testing of a 137' span four lane bridge.
The following conclusions were drawn:
• distribution factors for both interior and exterior girders were significantly lower than those determined from AASHTO methods
• bending moments in interior girders in skew bridges were significantly lower than those in right bridges, with reductions of around 5% for a skew angle of 30° to 28% for a skew angle of 600. The reductions are less in exterior girders in smaller skew, with a slight increase at the higher skew angles.
• the distribution factor for interior girders was practically insensitive to span length for the 75', 100' and 125' span lengths used.
• for the same size of cross-frames, a reduced spacing improves load distribution.
5.2.8 Distribution of Wheel Loads on Highway Bridges (National Co-operative
Highway Research Program, 1992)
The document is a digest of the findings from the final report of National Co-operative Highway Research Program Project 12-26, which was conducted in the mid-1980's in order to develop comprehensive specification provisions for the distribution of wheel loads in highway bridges. The project encompassed beam-and-slab, box girder, slab, multibox beam and spread box beam bridges and three levels of analysis, from detailed modelling of bridge decks, through graphical methods and simplified computer programs, to simple formulae.
At the time of the study, the American Association of State Highway and Transportation Officials bridge design specifications allowed for simplified analysis of bridge superstructures using the concept of a wheel load distribution factor for bending moments in the interior girders of most types of bridges. The distribution factor is given by:
g=S/D
where g = a factor used to multiply the total longitudinal response due to a single longitudinal line of wheel loads in order to determine the maximum response of a single girder; S = the centre-to-centre girder spacing; and D = a constant that varies with bridge type and geometry.
The study found that finite element analysis of bridge decks provided accurate results, provided that extreme care was taken in preparation of the model and that the computer program was capable of accurately modelling the responses being investigated. Where the program reports stresses and strains, care must be taken in calculating the associated moment and shear values. Grillage analysis presents a good alternative to other simplified bridge deck analysis methods, and will generally produce more accurate results. The digest presented simplified formulae for load distribution which, although more complex than the current specifications, provided more accurate results from a relatively simple calculation.
5.2.9 Distribution of Wheel Loads on Highway Bridges (Zokaie, Imbsen and Osterkamp, 1991)
The paper presents the findings of research on the distribution of wheel loads on highway bridges undertaken as part of the National Highway Co-operative Research Program. Bridge types investigated were beam and slab, box girder, slab, multi beam and spread box-beam bridges. Three levels of analysis were considered:
• detailed modelling of the bridge superstructure
• graphical methods, nomographs, influence surfaces and simplified computer programs used to apply such methods
• simple formulae to predict lateral load distribution.
Simplified procedures incorporated in AASHTO specifications in use for some 55 years were developed for non-skewed simply supported bridges. Contemporary practice however involves a large number of bridges to be built with skewed supports, on curved alignments and/or continuous over interior supports. The accuracy of the simplified formulae was assessed to range from highly unconservative (more than 40%) to highly conservative (more than 50%). The formulae developed as part of the research program gave results within 5% of the highest level (most-accurate) analysis. Grillage analysis was found to be a good alternative to the simplified graphical or computer methods. Recommendations of computer programs for the highest level analysis are made.
5.2.10 Nonlinear Finite Element Analysis of Deteriorated RC Slab Bridge (Shaltrooz, Ho, Aktan, de Borst, Blaauwendrad, van der Veen, !ding and Miller, 1994)
The paper focuses on the presentation of predictive analyses, using nonlinear finite element analysis software, of the responses of a decommissioned bridge with experimental results. The bridge was a 38 year old three-span reinforced concrete skewed slab bridge which had been decommissioned because of its deteriorated state. Causes of deterioration are not described, but may have been attributable to the use of deicing salts on the roadway. Standard tests on concrete cores indicated an average compressive strength of 52 MPa, tensile strength of 4.5 MPa and modulus of elasticity of 34,000 MPa. Reinforcing bar had yield and ultimate stresses of 345 MPa and 680 MPa respectively with a modulus of elasticity of 199,800 MPa and strain hardening modulus of approximately 3.5% of the elastic modulus. Using modal tests, approximate elastic stiffness characteristics of the abutments were identified. Three loaded trucks, each weighing 142 kN were placed on the bridge deck in six different configurations and vertical deflection profiles of the deck slab measured. Destructive tests were undertaken with four hydraulic servo-controlled actuators to simulate the footprint of a tandem semi-trailer. Failure occurred in a brittle manner at a total load of 3200 kN. First yield of reinforcing bars had occurred at a total load of 2893 IcN.
Prior to the testing, predictive analyses were carried out with a range of methods from simple yield line analysis to linear and nonlinear finite element analysis.
analysis demonstrated an important role of slab membrane force, which is directly affected by assumed horizontal support conditions.
5.2.11 Bearing Restraint in Slab-on-Girder Bridges (Baldit and Jaeger, 1988)
Tests on a large number of bridges in Ontario have shown that slab-on-girder bridges are usually significantly stiffer in flexure that is predicted by analysis. The tests have also shown that, in a single-span right bridge, the total longitudinal moment across a transverse section, as calculated by measured girder strains, is nearly always less than the total moment at the transverse section as calculated by treating the whole bridge as a simply supported beam. From a systematic study of the problem, it has been concluded that slab-on-girder bridges are stiffer mainly because of horizontal restraint provided by the girder bearings. The restraint can reduce live load moments in existing single-span slab-on-girder bridges by up to 20%.
It was suggested that bearings, of a type that permits horizontal support movement, were not needed in short-span bridges.
While the reduction in live load effects due to the restraint for new bridges was open to question, the beneficial effects could be used to advantage in the evaluation of existing structures.
5.2.12 Simulation of Dynamic Load for Bridges (Hwang and Nowak, 1991)
The objectives of the study were to develop a procedure for calculation of the dynamic load and to determine statistical parameters of the dynamic load to be used in the development of a reliability-based bridge design code (the Ontario Highway Bridge Design Code 1983). Models were developed for trucks, comprising body, tyres and suspension system, composite steel girder and prestressed concrete bridges with simply supported spans between 12m and 30m, and the road surface.
A large number of computer simulations were undertaken. The study concluded that:
• the dynamic load factor decreases as the gross vehicle mass increases
• the maximum midspan dynamic deflection is however almost constant regardless of the wieght of the truck, meaning that dynamic and static loads could be considered uncorrelated except 30m spans, for which a low degree of correlation was observed • the dynamic load factor was higher for 30m and 12m spans than for 24m and 18m spans • the coefficients of variation ranged from 40% to 70%, depending on the span length of
the bridge, indicating significant scatter in the dynamic effects
• the dynamic load factors for two side-by-side trucks were lower than for one truck • dynamic load factors varied from 0.09 to 0.21.
5.2.13 Modal Analysis for Damage Detection in Structures (Hearn and Testa, 1991)
Natural frequencies, mode shapes and modal damping coefficients in structures are affected
by changes in condition, providing opportunities for inspection and monitoring of structures. The nature of the effects is dependent upon the element affected and the nature of the deterioration.
Experiments were undertaken on a welded steel frame and a wire rope to validate dynamic monitoring as a method of structural inspection.
5.2.14 Bridge Assessment Using Forced-Vibration Testing (Salawu and Williams, 1995)
and to address changes in design requirements since the bridge was built in the 1960's. The bridge was excited using an hydraulic actuator, and the bridge response measured using accelerometers. As a result of the test program, it was concluded that:
• the natural frequencies of the bridge did not change significantly as a result of structural repairs
• comparison of the components of the normalised cumulative frequency-response function was able to give an indication of the changes to the bridge's condition
• changes in mode shapes were found to give a good indication of the presence and location of repairs
• a procedure to assess the condition of bridge structures was proposed, although it was recognised that there were limitations.
5.2.15 Dynamic Assessment of Bridge Load-Carrying Capacities I and II (Law, Ward, Shi, Chen, Waldron and Taylor)
A one-fifth model of a reinforced concrete T-beam bridge was tested to destruction, with the vibrational response to ambient excitation measured at different stages of cracking and spilling. Parametric studies were undertaken of the effects of different boundary conditions on the fundamental modal frequency.
Principles from the model testing were subsequently used for measuring responses of 13 full-scale bridge decks. It was concluded that it was feasible to use the method to assess the structural condition of bridge decks.
5.2.16 Membrane Action, and Design Against Punching Shear (Chana and Desai, 1992)
The paper discusses a test program to study and quantify the effect of membrane action on the punching shear resistance of slabs and to provide design recommendations.
Five reinforced concrete slabs 9m x 9m plan dimensions and 250mm thick, representing areas of slab surrounding internal columns of continuous flat slabs, were tested.
All specimens failed in a brittle manner in a punching shear mode. The extent of cracking on the tension face and the crack widths were reduced compared to conventional punching shear specimens.
It was concluded that there was a significant increase in shear capacity attributable to membrane action developed by the extent of slab outside the failure zone.
5.2.17 Punching Capacity of Deck Slabs in Girder-Slab Bridges (Azad, Baluch, Abbasi and Kareem, 1994)
Static tests were conducted on a series of simulated deck panels of girder-slab bridges to determine the punching resistance of the reinforced slabs, with the aim of generating reliable test data from representative large-scale models. Three sets of four identical panels, with varying amounts of reinforcement, were cast with testing involving loads applied over four different load areas. Sudden push-out type failure occurred in all cases, with the top surface of the displaced concrete cone equal to the load area and the bottom encompassing a larger area. Code provisions for punching shear failure are generally based on a slip plane at an angle of 45°. The experimental work described in the paper, and previous work, have indicated that the angle of the slip plane is expected to lie within the range of 200 to 350 to the horizontal, meaning that codes yield conservative results, particularly for small patch loads, and providing scope for refinement.
5.2.18 Strength Evaluation of M-beam Bridge Deck Slabs (Kirkpatrick, Rankin and Long, 1984)
Analysis using the equations of Westergaard had shown that an area of steel reinforcement of the order of 1.7% of the cross-sectional area of the deck was required. For test purposes, areas of 0.25%, 0.49%, 1.19% and 1.68% were provided.
While bridge deck slabs are commonly designed by flexural methods, all twenty test panels failed by punching shear.
It was concluded that the existing British bridge codes did not provide an accurate prediction of the ultimate load capacity of the M-beam deck slab, as no account was taken of the considerable enhancement in capacity from the in-plane restraint of the deck. A simplified design method was proposed. Observations from the model tests indicated that an isotropic mesh of 0.5% area of deformed bars would provide an adequate level of serviceability.
5.2.19 The Influence of Compressive Membrane Action on the Serviceability of Beam and Slab Bridge Decks (Kirkpatrick, Rankin and Long, 1986)
The paper discusses the testing of a full-scale bridge which was built with beam spacings up to twice normal to establish serviceability criteria and other performance characteristics that could not be properly assessed with the third scale model. It was found that contemporary methods of calculating crack widths based on flexural analysis were not applicable to bridge decks where the development of compressive membrane action resulted in improved serviceability characteristics. It also found that compressive membrane forces played an important part in the control of cracking in the slab even at relatively low levels of load, and that all test panels were uncracked at the service load.
5.2.20 Compressive membrane action strength enhancement in uniformly loaded, laterally restrained slabs (Rankin, Niblock, Skates and Long, 1991)
The paper follows the investigation of membrane action in M-beam bridge decks and examines the effect in uniformly loaded, laterally restrained rectangular reinforced concrete slabs.
Seven rigidly restrained and four unrestrained slab models, all 0.95m square and isotropically reinforced with 0% to 1.57% reinforcement were tested for the effects of compressive membrane action.
Compressive membrane action applies to transient or short-term loadings because creep of concrete will increase deflections and reduce the arching moment lever arm for long-term loadings.
The combined experimental and analytical study found that the ultimate capacities and post-cracking stiffnesses of uniformly loaded, laterally restrained slabs were considerably enhanced by the effects of compressive membrane action. A simple analytical method was developed to predict the strength of restrained slabs.
5.2.21 The Global and Local Behaviour of Bridge Deck Slabs (Jackson, 1990)
In bridge design, the global and local behaviours of bridge decks are generally considered separately. Research has however shown that bridge deck slabs are able to resist very much higher wheel loads than is implied by conventional design methods. As a result, empirical design methods for deck slab reinforcement have been incorporated in codes such as the Ontario Highway Bridge Design Code.
strength due to global transverse moments and the brittle nature of the failures, capacities of the deck slabs were nevertheless high and the empirical design rules considered to result in acceptable designs.
5.2.22 Punching Shear Behaviour of Restrained Reinforced Concrete Slabs (Kuang, 1991)
When a slab is restrained against lateral expansion, membrane compressive forces are developed. Membrane action is generally considered as a secondary effect which occurs after cracking of the concrete or yielding of the reinforcement, and has been found to result in substantial enhancements in the load carrying capacity of restrained concrete slabs. The report presents the results of a number of tests on concrete slabs. Conclusions include the failure of all the slabs in punching mode, the development of compressive membrane forces, greater restraint resulting in greater enhancement in load capacity, and the strength of the slabs being greater than that predicted by Johansen's yield-line theory and code provisions.
5.2.23 Behaviour of Isotropic R/C Bridge Decks on Steel Girders (Fang I K, Worley J, Burns N H and Klingner R E)
The paper describes an experimental and analytical investigation into the behaviour of reinforced concrete bridge decks designed to Ontario Code provisions, with about 60% of the reinforcement required by the AASHTO Code. It concludes that the bridge decks behave satisfactorily under design loadings, that behaviour of the slab was essentially linear under overload conditions, significant compressive forces were present in the deck after cracking, and that there was good correlation between analytical predictions and experimental observations using a smeared cracking model.
5.2.24 Cracking, Serviceability and Strength of Concrete Bridge Decks (Allen, 1991)
The paper discusses extensively a number of aspects of the behaviour of isotropic and orthotropic bridge decks, including shrinkage cracking, compression membrane action and live and fatigue load behaviour.
The following conclusions are drawn from the work:
• high collapse strength, or punch-out strength, of a bridge deck does not assure adequate serviceability
• isotropic decks which have transverse-through-shrinkage cracking exhibit serious serviceability problems
• vehicle loads are sufficient to cause flexural cracking in many isotropic or conventional bridge decks
• strength of isotropic bridge decks after cracking is not adequate
• the load regime under moving loads is more severe than fixed position loads
• flexural moments in the negative moment region over the interior girders are well below the flexural cracking strength of the concrete
• decks with full flexural positive moment reinforcing according to AASHTO provide satisfactory strength
• a bottom-layer only AASHTO deck will not suffer degradation from corrosion of top reinforcing bars and can be expected to have superior durability compared to two layers with either isotropic or AASHTO reinforcing
• the greatest efficiency and economy of reinforcement placement for a specified strength is achieved when reinforcing is confined to the bottom mat.
5.2.25 Assessment Implications from Tests on a Model Concrete Beam and Slab Bridge (Daly and Cullington, 1991)
A half-scale model prestressed concrete bridge deck was tested to collapse in the Transport and Road Research Laboratory Structures Laboratory. The deck was tested under dead load, superimposed dead load and live load, as specified in BS 5400: Part 2, with the HB component of live load increased until failure.
The study concluded that the design, which complied with BS 5400, was conservative but that the overall margin was not large. The model failed at 3.17 times the FIB load factored for the ultimate limit state. The unfactored code calculation indicated failure at 2.8 times the HB load.
In some areas there were reserves of strength which could possibly be used in the assessment of similar structures. Examples are flexure in the slab, torsion in the beams and end diaphragms, interfacial shear, web crushing, combined shear and torsion, and shear strength close to the support.
5.2.26 Tests on a Half-Scale Prestressed Beam and Slab Bridge Deck (Withey, 1989)
The report describes the testing of half-scale model bridges and section of bridges and comparisons with results from elastic and nonlinear models of analysis.
The model was loaded by means of single acting hydraulic jacks. Instrumentation comprised linear variable differential transformer transducers and electrical resistance strain gauges. Eventual failure of the model was shear dominated, but did not occur in a brittle manner because of yielding of elements and redistribution.
Elastic methods predicted behaviour well at lower loads, although there is difficulty in predicting the properties of materials. At higher loads, elastic methods were unsatisfactory. Mechanism methods were even less satisfactory because of inadequate modelling of the beam and slab configuration.
A finite element model with a fine mesh predicted behaviour well up to the point where bending was no longer the major mode of displacement.
The mode of failure emphasised that if arbitrarily large factors of safety are applied to the principal or desired mode of failure, then other modes of failure, such as shear, will become more likely. Similarly the effect of extra strengthening can change failure modes from ductile to brittle.
5.2.27 Strength of Concrete T-Beam Bridges (Beal, 1985)
A series of static load tests were performed on two concrete 1-beam bridges, both built in 1931, to evaluate the stresses induced in tensile reinforcement and transverse load distribution factors. While the two structures were similar in dimensions and reinforcing, they had markedly different qualities of concrete. The load tests showed no difference in bridge behaviour attributable to concrete condition.
To obtain data on failure capacity, testing was performed on two single and one double T segment taken from the deteriorated structure. The measured failure moments exceeded the nominal flexural strength as given by ordinary ultimate strength design methods.
5.2.28 Application of Field Testing to Bridge Evaluation (Moses, Lebet and Bez, 1994)
The paper explores bridge testing as a specific part of the evaluation and assessment of bridges, especially for cases in which a safe capacity evaluation or bridge capacity rating must be carried out.
The Swiss bridge test consists of about one day of placement of four to eight heavy dump-truck types vehicles in different positions on the bridge to simulate longitudinal centre moments, torsional effects and support negative moments. Each test vehicle has a gross mass of approximately 2501(N. The major concerns during the tests are as follows:
• obtain agreement for each load case between computed and measured displacements at a number of locations along the girders
• behaviour should be linear so that displacements return to zero when the load is removed
• crack opening during load application should be within acceptable limits.
In addition, dynamic responses are measured to provide a record of bridge displacements, impacts, frequencies and crack widths.
The author considers an extension of the Swiss technique to the evaluation of existing bridges. Such evaluations may be necessary for a number of reasons:
• calculations have shown that a structure is not capable of meeting present standards • inspections have revealed a loss of capacity such that the strength may have fallen below
the level needed for meeting the load criteria
• to measure directly the stress spectra to evaluate a possible fatigue prone detail.
It was concluded that field testing provides a number of benefits from a safety point of view. The use of load levels of about 0.85 times the design load includes both benefits of diagnostic testing and proof loading in bridge evaluation. The tests are relatively simple to perform and give information about serviceability performance for long term durability, behaviour data for the bridge to verify the prediction model, and a significant degree of strength uncertainty truncation.
For reliability analysis, bridge testing may result in higher safety indices because or reduced behaviour uncertainty and truncation of the lower section of the resistance curve.
5.2.29 The AASHO Road Test, Report 4, Bridge Research (Highway Research Board, 1962)
The AASHO Road Test was a study of the performance and capabilities of highway pavement and bridge structures under moving loads of known magnitude and frequency. Eighteen beam and slab bridges, comprising ten with steel beams, four with prestressed concrete beams and four reinforced concrete T-beams, were included in the program. The testing was undertaken in Ottawa, Illinois between 1958 and 1961, with construction of the bridges having commenced in 1956. The program involved trucks of known configurations travelling on specially built loops to test both pavement and structures. The bridges were instrumented for strain and deflection.
Five types of tests were conducted, with the principal tests being concerned with the behaviour and life of the bridges under repeated high overstress. Discussion in this report focuses on the reinforced concrete bridges.
the outer 4.5m of the beams and a considerable amount of irregular cracking occurred near the level of the reinforcement. Live load deflections increased with time because of lower stiffness. All four reinforced concrete bridges survived the 556,000 trips of regular test vehicles. Accelerated fatigue tests were conducted with three of the bridges, proceeding without change in the response or general behaviour of the bridges until bars fractured or the tests were discontinued. In the two bridges stressed to higher levels, two bars in the exterior beam fractured after approximately 730,000 cydes. In the lower stressed bridge, a total of 1,500,000 stress cycles was reached without failure. Two bridges were tested to failure, which occurred by yielding of the tension reinforcement followed by crushing of the slab.
For estimating the limit of elastic behaviour, the moment at first yielding of the reinforcement computed from the ordinary straightline cracked-section theory and from the yield point of the reinforcing bars was found satisfactory. The maximum static moment applied in the ultimate strength test exceeded the computed strength, calculated from commonly accepted formulae based on beam tests, by 4 percent. Comparisons between laboratory fatigue tests on beams and the life determined by Miner's hypothesis of cumulative damage for applied loads suggested that the test bridges were slightly weaker in fatigue than indicated by the lower limit of the laboratory data.
5.2.30 Strength Evaluation by Testing of an Old T-Beam Bridge (Mufti and Bakht, 1991)
The paper discusses the testing of a rigid frame reinforced concrete T-beam bridge which had deteriorated extensively and was posted for a load limit of 5 tonnes, with the two outer lanes blocked to traffic. It was likely that the bridge had been built in either 1912 or 1926, with testing undertaken in 1991. The clear span of the bridge was 9.8m and the overall width 20.1m.
Although drawings were not available, a pretest analysis was undertaken using the semicontinuum analysis computer program SECANI with assumptions that the span was 9.75m, all girders were of equal stiffness, the deck slab was 200mm thick and that each girder had a width of 460mm and depth of 690rrun below the deck slab. While the computer program can only analyse simply supported bridges, it has been shown by Jaeger and Bakht (1989) that the semicontinutun method of analysis can be applied to the positive moment region of rigid frame bridges by using a simply supported span length of L/1.5, where L is the span of the rigid frame bridge. The analysis found that distribution factors for deflections and moments were within 5% of each other.
Instrumentation was primarily with deflection transducers, although some strain gauges were fitted. The bridge was tested with two special vehicles, and loads increased by adding concrete blocks. The vehicles were placed at a number of longitudinal and transverse positions.
The allowable loading was calculated from the 1983 Ontario Highway Bridge Design Code, using appropriate capacity reduction, dynamic load and multiple lane loading factors. As a result of the testing it was recommended that the posting of 5 tonnes be upgraded to a single posting of 19 tonnes or triple posting of 19,26 and 35 tonnes.
5.2.31 Old Concrete Slab Bridges, Experimental Investigation and Analysis (Azizinamini A, Boothby T E and Shekar Y, 1994)
The experimental work showed tensile strains in the bottoms of slabs to be higher than compressive strains at the tops of the slabs, attributable to the opening of cracks which open as the structure is loaded. The bridges behaved in a linear elastic manner under truck loading, with principles of superposition applying. Kerbs were found to contribute significantly to load capacity. Dynamic tests found good correlation between impact factors derived from slab tensile strains and deflections. Impact factors derived from compressive strains at the top of the slab were consistently higher. The use of a board fixed to the ground at bridge abutments did not necessarily increase the impact factor. No apparent correlation was found between span length and impact factor.
A number of tests were conducted on the bridge tested to failure. Behaviour was found to be linear at lower loads, with no damage observed. At higher loads, permanent deformations occurred, but behaviour was linear elastic for subsequent loadings less than the previously applied load. Failure of the continuous span was ductile, with a maximum observed deflection in excess of 127mm. For the simple span, yielding of bars and a deflection of more than 25rrun occurred prior to failure, which resulted from punching shear failure over one of the loading rams. The testing showed the bridge capacity to be significantly higher than predicted by the current rating procedures.
Finite element and yield line analyses of the bridges were undertaken. Displacement results from the three-dimensional analyses were in good agreement with the test results. Analytical studies incorporating a moment-curvature analysis approach, together with actual material properties, found that the higher observed capacity of the bridges could be attributed to the actual rather than assumed material properties and the participation of kerbs in load carrying capacity. The studies also indicated that there were significant differences between the maximum bending moments obtained from two- and three-dimensional analyses because of the participation of non-structural elements, such as kerbs. It was concluded that old concrete slab bridges have significant reserves of capacity and that yield-line analysis and three-dimensional finite element analysis could be used to address the strength capacity and load effect aspects of bridge rating. Adequate strength reduction and load factors however need to be developed for the rating process.
5.2.32 Destructive Testing of Decommissioned Concrete Slab Bridge (Miller, Aktan and Shahrooz, 1994)
The paper describes the destructive testing of a 38-year old deteriorated concrete slab bridge, with the goal of observing the behaviour of the bridge at various load levels and using the information to verify analytical bridge evaluation techniques.
The loading system was designed to simulate the footprint of a HS20-44 truck, and used hydraulic cylinders and rock anchors to apply the load
Approximately 150 instruments were used to measure displacements, rotations, distortions and reinforcement strains.
Final failure was by punching shear of the slab.
Modelling of behaviour used an effective strip model, linear finite element analysis and nonlinear finite element analysis.
The following conclusions were drawn:
• the total failure load of 3200IN was equivalent to 22 HS20-44 trucks, indicating that decommissioning on the basis of inadequate load capacity was not warranted
• failure began in the deteriorated shoulder region over the piers, progressively shifting, with eventual failure by punching shear. The final failure load of 3200IN was 40% below the load value for punching predicted by the AASHTO Standard of 1989. The failure surface was not the usual one for punching shear, indicating that damage had affected the final failure.
• the effective-strip model was found to give an overly conservative estimate of bridge capacity. Linear finite element analysis was able to account for some of the mechanisms of load redistribution in the slab. Nonlinear analysis provided a further improvement, although failure occurred before many on the nonlinear mechanisms occurred.
• deterioration of the slab greatly reduced shear capacity, leading to an unexpected failure, and demonstrating the difficulty in understanding and incorporating the effects of local deterioration on structural response.
5.2.33 Ultimate Load Test of Slab-on-Girder Bridge (Balcht and Jaeger, 1992)
The paper reports on the ultimate load test of a skewless two-span, two-lane bridge having a clear span of 13.72m with six rolled steel girders and non-composite concrete deck in London, Ontario, Canada.
The bridge was instrumented with strain gauges on the bridge at midspan and loaded with concrete blocks.
Conclusions from the testing were as follows:
• girders continued to carry loads long after the formation of first yield and the bridge as a whole continued to carry loads long after the failure of the first girder reached its ultimate load
• bearing restraint forces reduced the applied moments by a minimum of about 11%. The effective coefficient of friction between the somewhat rusted bottom flanges of the girders and the concrete abutment was found to be nearly 1.0 at the ultimate limit state.
• for loads within the linear range of behaviour, the load distribution characteristics of the bridge appeared to deteriorate slightly with load.
• in the absence of mechanical shear connection between the deck slab and the girders, any composite action between these two components that may exist at service loads deteriorates rapidly as the load approaches the failure load for the girder.
5.2.34 Test Loading of a Full Scale Bridge (Gosbell and Stevens, 1968)
The construction of the Nillhacootie dam in Victoria led to the inundation of a section of highway, including a bridge over Sandy Creek. The bridge was built in 1961-62, and consisted of seven precast prestressed concrete beams spanning 58'10" with a 6" reinforced concrete deck slab.
Loads were applied with rock anchors grouted into the stream bed, and double I section beams used to form a grillage to apply the loads to the deck through hydraulic jacks.
Two independent scaffolding systems were built under the bridge; one for access and the second to provide a rigid datum for deflection measurements.
Deflections were measured with vernier scales, dial gauges and levels. Strains were measured with Demec mechanical gauges of 8" gauge length.
Average test results of concrete cores taken from the bridge were as follows:
Sample Position Equivalent Cylinder Strength Modulus of Elasticity Deck
There were a number of conclusions drawn from the extensive range of testing undertaken: • The condition of the bridge after 6 years of service was excellent, with no visible signs of
deterioration.
• Concrete strengths were well above design values.
• The longitudinal flexural rigidity of the deck varied significantly across the width. Integral action between the deck, the precast kerbing and the hand rails increased the edge beam rigidity considerably.
• The midspan diaphragm was ineffective in the transverse distribution of loads. Separation between the diaphragm and the beam webs occurred at very low loads. • The limited correlation between strains and deflections for single concentrated loads was
significantly improved with multiple loadings.
• The action of the bridge under simulated design loads was essentially linearly elastic. • The distributions predicted by the NAASRA Bridge Design Code were shown to be
conservative.
• Cracking of the longitudinal beams produced little change in the form of distribution coefficients at midspan.
• A load over three times that required to initiate cracking was applied without producing complete failure.
• The bridge showed excellent recovery after overloading, with most cracks closing almost completely.
• No signs of shear failure were detected in the deck slab or beams during the main flexure tests.
• Local flexural effects in the slab were adequately predicted by Westergaard's method, with the NAASRA recommendations being generally found conservative.
• The ultimate punching shear strength of the slab was adequately predicted by the methods available at the time of testing.
• The predicted and measured frequencies of vibration of the bridge were in good agreement, at about 7Hz with an average logarithmic decrement of about 0.07.
• At low speeds the bridge was forced into oscillations at the frequency of the vehicle, but at higher speeds the natural frequency of the bridge predominated.
• The impact factor was found to be dependent on the vehicle speed, with maximum values at about 10 mph and 25 mph.
• The NAASRA impact factor was found to be generally conservative for the bridge with no induced roughness.
• The introduction of induced roughness near midspan increased the impact factor to about three and a half times the maximum obtained without induced roughness.
5.2.35 Destructive Testing of Two 80-year-old Truss Bridges (Aktan, Lee, Naghavi and Hebbar)
Two decommissioned 80-year-old truss bridges were subjected to a series of nondestructive and destructive tests with the following objectives:
• to evaluate whether many bridges dating from the early 1900's having similar design and construction characteristics pose a safety hazard
• to explore cost-effective and unobtrusive methods of upgrading deteriorated steel truss bridges
and failure behaviour of steel truss bridges possessing built-up members rigidly connected by gusset plates are not adversely affected by local deterioration. The built-up members and the connections possessed adequate deformability permitting extensive redistribution. Connection retrofit by welding plates was feasible and successful.
5.2.36 Destructive Testing of Deteriorated Prestressed Box Bridge Beam (Miller and PareIch, 1994)
A prestressed concrete beam that had been located beneath the footway of a road bridge was removed because of severe corrosion of prestressing strand in one corner and subsequently tested to failure by loading with two point loads. The beam failed suddenly at a load 8% less than calculated capacity; with the likely mode of failure being lateral instability. By comparison, a new beam constructed for comparison purposes behaved in a ductile manner, and did not fail at an applied load 15% greater than the ultimate capacity predicted by the 1989 AASHTO Code.
5.2.37 Calibration of Bridge-Strength Evaluation Code (Verma and Moses, 1989)
The process of determining the live load capacity of existing bridges is distinct from the design procedure, which is necessarily generalised for applicability to a wide range of structures. Many of the bridges were designed for vehicles which do not represent current configurations and may have reduced load capacity due to deterioration.
The paper presents a comprehensive evaluation specification, with the following constraints: • it is limited to the evaluation of existing steel and prestressed concrete bridges
• the only limit state recognised is the ultimate limit state; serviceability limit states were not considered
• fatigue life of steel bridges was not discussed in the paper
• nominal live loads were chosen to match existing vehicle loads and configurations
• a load factor was prescribed to account for uncertainties in actual live loads and static and dynamic load effects.
A load factor method is used, with the load and resistance factors based on providing a uniform safety level for all structures, with the target safety level being that implicit in existing rating practices.
Statistical data is used to determine dead load, live load, headway, coincidence, load distribution, impact and resistance effects.
An analysis of safety indices for bridges using existing procedures showed significant variability with span length, traffic category and structure type. Target values of 2.3 for redundant members and 3.5 for non-redundant members were adopted.
Calibrated live load and capacity reduction factors are detailed below:
Category of traffic Live load factor
Enforced, light volume 1.30
Enforced, heavy volume 1.45
Unenforced, light volume 1.65
Bridge condition Capacity reduction factor
Slight corrosion 0.85
Severe corrosion 0.75
Prestressed concrete 0.95
Nonredundant elements 0.80
5.2.38 Reliability of Highway Girder Bridges (Tabsh and Nowak, 1991)
Load and resistance parameters for bridges are random variables and deterministic approaches thus do not usually reveal the actual safety reserve. Probabilistic methods have however been developed since the 1970's and can be used for reliability calculations for bridges.
The paper describes the analysis of available statistical data on bridge loads and resistances to calculate reliability indices for a range of span lengths of composite and non-composite steel girder, reinforced concrete T-beam and prestressed concrete girder bridges. Moment-curvature relationships are developed using incremental load techniques. Live load models are based on the maximum 75-year live load, with two trucks side by side.
Reliability calculations were undertaken for bridge girders and bridge systems, with system reliability higher because of redundancy. Sensitivity analyses indicated the importance of resistance parameters such as the yield stress of steel or the steel area.
5.2.39 Probabilistic Assessment of Prestressed Concrete Bridge (Sobrino and Casas, 1995)
The parameters used for the design of new bridges are not appropriate for the assessment of existing structures, because the uncertainties involved in load and resistance values are usually lower. Accurate estimations can be made using information from inspections, experimental tests, traffic measurements and other supplementary data. A full probabilistic analysis can then be performed to determine the reliability index for a particular structure. The paper describes a structural assessment procedure and illustrates it with a case study for a prestressed concrete voided slab bridge.
5.2.40 Calibration of LRFD Bridge Code (Nowak, 1995)
Bridge codes are now being written in terms of load and resistance factor design to provide a consistent safety margin for different types of bridges over a wide variety of spans. The paper discusses the development of the AASHTO LRFD bridge code, which involved the following steps:
• the selection of representative bridges
• the establishment of a statistical database for load and resistance parameters • the development of load and resistance models
• the development of a reliability analysis procedure • the selection of a target reliability index
• the calculation of load and resistance factors.
It is noted that contemporary codes (AASHTO, 1992) show a considerable variation in the value of the reliability index, (3. Recommended values for a uniform safety level are presented.
5.2.41 Risk-Based Proof-Load Requirements for Bridge Evaluation (Fu and Tang, 1995)
reliability theory and makes recommendations for proposed factors in proof-load requirements.
5.3 Discussion
The Princess River Bridge testing included the review of a range of literature relating to the program.
While dimensional tolerances are routinely included in specifications for structures, compliance with those tolerances has been shown to depend on a number of factors. Marrosszeky and Chew (1989) found that no single factor could be identified as dominant in the accuracy of reinforcement placement, although the accuracy was better in bridges than buildings. This is likely to be consistent with the conclusion of Udoeyo and Ugbem (1995) that variation in member sizes was reduced by increased levels of inspection.
The assessment of load distribution is an important element of bridge design and a number of techniques are available, ranging from simplified distribution formulae, through grillage and yield line analysis, to non-linear finite element analysis. Simplified distribution formulae were developed some 60 years ago, prior to the advent of electronic calculation tools, for non-skewed simply supported bridges. Contemporary practice however means that a large proportion of bridges are curved, skewed and/or continuous. While increased sophistication leads to improved accuracy, it is at the expense of calculation time and computing power. Accurate results from finite element analysis require care to be taken with the preparation of the model and the selection of the software. Bridge designers and assessors require an appropriate balance, and the National Co-operative Research Program (1992) showed that grillage analysis and enhanced distribution formulae can provide acceptable results and reasonable amounts of calculation.
Bridge dynamics are of relevance for both assessing the effective increase in static load effects of vehicles and as a means to assess damage to and deterioration of structures. Simulations by Hwang and Nowak (1991) show no or low correlation between static and dynamic vehicle loads and a high variability in dynamic load effects. A number of investigators have found that dynamic techniques have the potential to monitor damage and deterioration, but that there are limitations.
Researchers, including Chana and Desai (1992), Azad et al (1994), Kirkpatrick et al (1984, 1986), Rankin et al (1991) and Jackson (1990), have found high load capacities in reinforced concrete bridge decks. Bridge decks are conventionally designed by flexural methods, although failure is typically by punching shear at loads substantially higher that those predicted by design. The increased capacity is generally attributed to the lateral restraint provided by supporting beams and the membrane action which occurs with transient loads. Recognition of those effects has led to the incorporation of empirical design methods for bridge deck slabs in the Ontario Highway Bridge Design Code (Jackson, 1990).
Testing of model and full-size bridges has been reported on a number of occasions in the literature. The testing has covered a range of aspects of bridge behaviour at both working and ultimate loads. Extensive testing programs have occurred in Switzerland, where all bridges are tested before entering service, and Ontario as part of a program of verifying capacities of older bridges (Moses et al, 1994). The AASHO Road Test involved the testing of eighteen bridges (Highway Research Board, 1962). Other testing has generally involved individual bridges. A number of principles emerge consistently from the test programs: • elastic prediction of bridge behaviour is good at lower loads, but unsatisfactory at higher
loads
• design methods are generally conservative, with high reserves of strength in tested bridges
• large factors of safety for desired ductile modes can lead to other modes of failure, including shear, becoming more likely
• the reduced uncertainty about bridge behaviour resulting from bridge testing can lead to higher safety indices in assessment.