QLK5-2002-02400
Deliverable D3 (WP4):
Report on proposals for the development,
harmonisation and quality assurance of organic
data collection and processing systems (DCPS)
Guido Recke
1, Ulrich Hamm
1,
Nicolas Lampkin
2, Raffaele Zanoli
3,
Susanna Vitulano
3and Santiago Olmos
21 University of Kassel, Witzenhausen 2 University of Wales, Aberystwyth 3 Università Politecnica delle Marche, Ancona
August 2004
Responsible for D3:
“Report on proposals for the development, harmonisation and quality assurance of organic data collection and processing systems (DCPS)”
Prof. Dr. Ulrich Hamm
Agricultural and Food Marketing
Faculty of Organic Agricultural Sciences University of Kassel
Steinstrasse 19 37213 Witzenhausen Germany
Fone: +49-(0)5542-98-1284
E-mail: [email protected]
Authors of the chapters:
Table of Contents
1 Introduction ...1
1.1 Objectives of workpackage 4...2
1.2 Approach and methods...3
2 Quality assurance, harmonisation and proposals for development of organic DCPS...4
2.1 Quality assurance ...4
2.1.1 Data quality...4
2.1.2 Quality assurance concepts ...8
2.1.3 Harmonisation ...8
2.1.4 Practical experiences of Statistics Denmark...9
2.2 Results of WP2, WP3 and the European seminar in Berlin ...10
2.2.1 Introduction...10
2.2.2 Supply of and demand for organic sector data ...11
2.2.3 Data quality at specific actor levels ...13
2.3 Strengths and weaknesses of organic DCPSs in Europe ...17
2.3.1 Introduction...17
2.3.2 Farm level ...18
2.3.3 Supply chain (wholesaler/processor and import/export level) ...20
2.3.4 Consumer and retailer level ...21
2.3.5 Supply balance sheet ...22
2.3.6 Summary for all levels ...22
2.4 Proposals for the different actor levels ...23
2.4.1 Farm and processor level...23
2.4.2 Supply chain (wholesaler and import/export level) ...23
2.4.3 Consumer/retailer level ...24
2.4.4 Supply balance sheets ...25
3 Barriers to the implementation of improved organic statistical data collection and processing systems ...26
3.1 Approach...26
3.2 Results ...26
4 Summary, conclusions and recommendations...42
5 References...46
List of Tables
Table 2-1: Quality dimensions and selected indicators ...7
Table 2-2: Advantages and disadvantages of harmonised data ...9
Table 2-3: Type of organisations at different actor levels ...12
Table 3-1: Results of the interviews...26
List of Figures
Figure 2-1: Quality dimensions ...7List of Abbreviations
1 Introduction
European markets for organic products are developing fast. In Europe, as other parts of the world, more and more farmland is being converted to organic production. In order to adjust production and consumption levels, detailed market information is needed, especially where decisions with a long-term impact need to be taken, e.g. on converting specific land or livestock enterprises requiring high levels of
investment in glasshouses, housing, processing facilities, etc. Since public subsidies (regional / national / European) are heavily involved in these investments, valid, accurate and up-to-date information is essential not only for farmers and growers, but also for policy makers, consultants, processors, etc.
EU-research projects such as OFCAP (Organic Farming and the Common
Agricultural Policy, FAIR3-CT96-1794) and OMIaRD (Organic Marketing Initiatives and Rural Development, QLK5-2000-01124) have shown that regional or national data gathering takes place in many countries, but often only very basic data, such as certified organic holdings, land areas and livestock numbers, are reported. Important market data, e.g. the amount of production, consumption, international trade or producer and consumer prices, do not exist in most European countries. In some European countries there are only rough estimates of the levels of production and consumption. There is no standardisation and data are seldom comparable. Furthermore, detailed information on specific commodities is missing. Another problem related to the analysis of European Organic Data Collection and Processing Systems is the difficulty of data comparison due to the lack of harmonisation,
although significant steps are being taken to include organic farming data in existing international systems, key examples being the Farm Accountancy Data Network (FADN/RICA) and the Farm Structure Survey (FSS).
Hence, investment decisions are taken under conditions of great uncertainty. Likewise, if policy makers want to support organic agriculture, they do not know whether it would be better to support production or consumption or to address problems in the marketing channel. Therefore, information is a crucial issue for both the organic supply-chain and policy makers. Producers, processors and traders require information in order to plan their marketing strategies. Therefore, market transparency is an important precondition to be able to act and react adequately to changes in the market. At present, no official statistics are available on the sales of organic products and trade data are not available, given that no differentiation is made between organic and non-organic products by customs authorities. The European Action Plan for Organic Food and Farming highlights a lack of available statistical information about organic markets and organic farming. As this information is crucial for the decisions of policy makers and market actors, action point 3 expresses that the collection of statistical data on both production and market of organic products should be improved (CEC, 2004). It has been mentioned further that in addition to intensify the collection of the relevant information and economic data with the existing tools, it is necessary to prepare harmonised methods for collecting additional official statistics on organic farming, organic food and its markets (CEC, 2004).
Nowadays, the information is a matter of primary importance and it is necessary to warrant its independence, correctness and transparency, in brief, its quality. The EU concerted action EISfOM (European Information System for Organic Markets, QLK5-2002-02400) is attempting to take the first steps in solving these problems. The aim of this concerted action is to build up a framework for reporting valid and reliable data for relevant production and market sectors of the European organic sector in order to meet the needs of policy makers, farmers, processors, wholesalers and other actors involved in organic markets.
In this first phase of the project, the aim has been to assess current data collection practices and the potential for integration and further development. This was carried out as part of workpackages 2 and 3 of the project, which focused on relevant data collection and processing systems (DCPS) for general agriculture and for organic farming respectively. The aim was to define a reference model for the development of organic DCPS based on the general systems, and to identify the potential for the integration of both types of systems. The analysis was conducted in 32 European countries and country reports summarising the current situation have been produced for each of them. The results have been summarised in an overview report
(Deliverable D2).
In workpackage 4, the results from the earlier work packages, previous research projects such as OFCAP and OMIaRD, and contributions from stakeholders and experts were reviewed at the first EISfOM European seminar in Berlin (Recke et al., 2004). Issues relating to improving the scope and quality of data collected,
harmonisation of systems and the potential for integration with existing systems for general agriculture were debated and ideas for future development were proposed. This report represents the conclusion of workpackage 4 as well as the first phase of the project. In the first chapter the objectives and general approach of this
workpackage will be described. Chapter 2 focuses on quality assurance, the main results of WP2 and WP3 and the European Seminar in Berlin. Furthermore, the strengths and weaknesses of organic DCPS are analysed and the chapter closes with proposals for the development of organic DCPSs. Chapter 3 focuses on results of expert interviews on the main barriers for the implementation of improved organic statistical data collection and processing systems. Chapter 4 gives a summary and some general conclusions are drawn. This report provides perspectives on how the above mentioned issues of the European Action Plan might be implemented.
1.1 Objectives of workpackage 4
The specific objectives of WP4 are:
• to further develop the proposals for harmonising data collection and processing systems for organic and conventional markets by means of a European seminar for national and international experts and stakeholders
• to develop proposals for ensuring the quality of collected data.
1.2 Approach and methods
1. A European seminar was organised in Berlin by P5 (ZMP) (supported by a sub-contractor), P1 (University of Wales, Aberystwyth) and P10 (University of Kassel) involving governmental and non-governmental experts and
stakeholders from the 32 countries covered by the concerted action. Working papers, invited and offered papers from participants and first results of WP2 and WP3 were presented. Working groups debated issues relating to the development, harmonisation and quality assurance of organic DCPS. P2 (FIBL) produced the proceedings (Recke et al., 2004) as part of WP7. 2. Based on experiences from former and ongoing research studies on the
European market for organic products (among others, the EU-funded projects OFCAP (FAIR3-1996-1794) and OMIaRD (QLK5-2000-01124), there is a need for the development of a mechanism by which national bodies can ensure the quality of collected data. To achieve this:
o P10 (University of Kassel prepared a working paper for presentation to
the first European seminar on quality assurance issues in DCPS for agricultural commodities, based on an analysis of theoretical and analytical tools and methods used in the assessment of data quality.
o P6 (University of Ancona) prepared a working paper containing an
analysis of current data collection practices based on the results of WP2, WP3 and the European seminar.
o P10 (University of Kassel) prepared a working paper evaluating the
proposals for development and harmonisation of organic DCPS resulting from WP2 and WP3 and the European seminar with respect to ensuring data quality, and developed specific proposals for quality assurance of organic DCPS.
o P1 (University of Wales, Aberystwyth) prepared a working paper
identifying the main bottlenecks for the introduction of the proposed organic DCPS at international and national level, based on interviews with experts and stakeholders participating in the European seminar.
2 Quality assurance, harmonisation and proposals for
development of organic DCPS
In the first section of this chapter a definition of quality, the dimensions of quality, the process of harmonisation and quality assurance approaches are introduced.
Practical experiences of Statistic Denmark are also described. It can be shown that quality assurance approaches play a central role in data management systems of most of the national and international institutions collecting and processing
agricultural data. In the second section, results of WP2 and WP3 and of the
European seminar with regard to quality and harmonisation are presented. In secton three we point out strengths and weaknesses of organic DCPS at the different actor levels. In the last section proposals for the different actor levels are made.
Each part of the analysis has been conducted at the following actor levels: • Production (Farm) level
Structural data about agriculture; price data on farm level; farm
accountancy data; production volume and value data when gathered on farm level.
• Intermediate supply-chain level
o Wholesaler / Processor level
Production volume and value, price data, turnover, etc.
o Import / Export level
Import and export volumes • Retailer/ consumer level
Data about sales volumes and values on retailer level
Data about food consumption, household expenditures and consumer prices for food
• Supply Balance Sheets
Data on volumes and prices, of both overall supply and demand components.
2.1 Quality assurance
2.1.1 Data quality
The quality of statistical information is the primary aim for national statistical agencies as for all other kind of data collectors. Nowadays, the information is a matter of primary importance and it is necessary to warrant its independence, correctness and transparency, in brief, its quality.
In the last 20 years, the interest towards the quality of data has been growing continuously in all sectors and, at the same time, we have seen many attempts to define the quality and to find ways to improve it. Lyberg et al. (1998) described this wide tendency as a “revolution”.
useful in this part of this working paper to remember the most important aspects that showed the problem of data quality (Filippucci et al., 2000):
1. The growing complexity of general events is emphasising the need for information inside society. The national institutional organisations and the private actors need reliable statistical data and indicators to orientate their actions correctly.
2. Users are always more careful, well prepared and demanding because they have to face up to even more complicated situations and they need refined and reliable information that can help them to decide.
3. The production of data is not a monopoly and, on the contrary, thanks to new technologies, we have good competition in estimating different events (market surveys, life conditions’ surveys, price surveys). This competition would extend to most parts of the current production of statistical data.
4. Many aspects of lifestyle and of the operating way of firms are changing, making the design of surveys more difficult in general.
Because of many changes, the respect of the principle of accuracy of data only is not sufficient anymore. We need a more complete and wider concept of quality. The attention towards the quality of statistical information requires a new and more intense effort to transfer this concept of quality from collecting data to the entire measurement system. The concept of quality is vague and it assumes different connotation in different contexts. For a long time, quality has only been considered as a problem of reducing the sampling error and other measurement errors. In the past ten years, the situation has rather changed and the concept of data quality has become progressively broader and differentiated. Recently, quality in statistics has been interpreted as a continuous improvement of the data production process introducing the concept of Current Best Method (Filippucci et al., 2000). However, there are three common aspects that unify different approaches and give a common basis to quality analysis:
• data quality is determined by the capacity to satisfy a cognitive need; • the idea that a statistical measure and the process of measurement are
intimately bound;
• the evaluation of quality is generated by the twofold need to know the basic characteristics of a product and to improve it.
The quality control is placed in a dynamic context, the aim of which is the adaptation to the changes and to the emerging necessities. From the quality point of view, the statistical information can be considered, as any other goods and services, to apply any developed quality concepts.
In such a context, the Leadership Group on Quality has adopted the definition of quality proposed in the norms ISO 8402-1986 of goods or services: "The totality of features of characteristics of a product or service that bear on its ability to satisfy stated or implied needs of customers". The analytic identification of quality
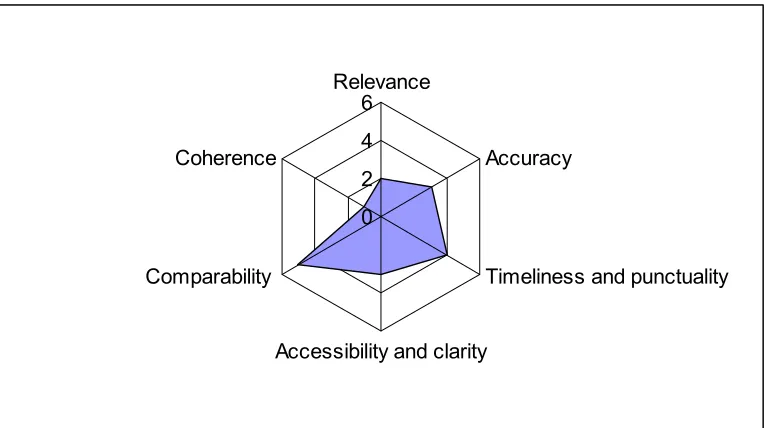
dimensions helps to define the reference context to control and evaluate the quality of a statistical system and of a source. These have been defined as (Eurostat, 2003):
• Relevance: A statistical product is relevant if it meets users’ needs. The
identification of users and their expectation is therefore necessary. It refers to whether all statistics needed are produced and the extent to which concepts are used (definitions, classifications etc.) which reflect user needs.
• Accuracy: Accuracy which includes completeness is defined as the closeness
between the estimated value and the (unknown) true population value (Mariott, 1990).
• Timeliness and punctuality: This dimension refers to a frequent and a
pre-established date upgrading. Timeliness of information reflects the length of time between its availability and the event or phenomenon it describes. Punctuality refers to the time lag between the release date of data and the target date when it should have been delivered.
• Accessibility and clarity: Accessibility refers to the physical conditions in which
users can obtain data: where to order, delivery time, etc. Clarity refers to the environment of statistics information: appropriate metadata provided with the statistics; graphs, maps and other illustrations; availability of information on the statistics and their quality and the assistance offered to users by the National Statistical Institutes (NSIs). Statistical data have most value when they are easily accessible by users, are available in a format users desire and are adequately documented. Assistance in using and interpreting the statistics should also be made available by the providers.
• Comparability: Statistics for a given characteristic are most useful when they
enable reliable comparisons of values taken by the characteristic across space and over time. The comparability component stresses the comparison of similar statistics between countries in order to evaluate the meaning of aggregated statistics at the European level.
• Coherence: When originating from a single source, statistics are coherent in
those elementary concepts and can be combined reliably in more complex ways. When originating from different sources, and in particular from
statistical surveys of different frequencies, statistics are coherent insofar as they are based on common definitions, classifications and methodological standards. The coherence between statistics is orientated towards the comparison of different statistics, which are generally produced in different ways and for different primary uses.
Table 2-1: Quality dimensions and selected indicators
Quality dimension Indicator selected
Relevance User satisfaction index
Accuracy Coefficient of variations for key statistics Unit response rate
Item response rate Editing rates and ratio Imputation rates and ratio Frame error rate
Revision rate
Timeliness and punctuality Punctuality of time schedule of effective publication
Average time between the end of reference period and the date of the first results
Average time between the end of reference period and the date of the final results
Accessibility and clarity Number and types of means used for disseminating statistics Comparability Number and proportion of the statistical products that have
indicated differences in concepts or/and measurement from the European norm
Length of comparable time series
Coherence Differences between annual and short-term statistics Source: Eurostat (2003), Handbook “How to make a quality report”
In Table 2-1, indicators are given for every quality dimension. To get an easy-to-handle index of quality, these quality dimensions (Figure 2-1) have to be weighted to get an overall quality index. A big problem of such a quality index is that not all indicators can be measured and reduced to numbers because they are qualitative. Proxy quantitative measures have to be incorporated but as a result the definition of the measures has an impact on the quality index. The use of such a quality index should therefore be limited for internal use in the statistical institutions.
0 2 4 6 Relevance
Accuracy
Timeliness and punctuality
Accessibility and clarity Comparability
[image:13.612.98.484.451.665.2]Coherence
2.1.2 Quality assurance concepts
In management literature, a whole range of quality management concepts is described. These are concepts that are adapted to the needs of the national statistics institutions. Most of the national statistics institutions take the total quality management (TQM) system as an approach to improve the quality of their statistics. TQM is an approach that can be taken in several organisations to continuously improve the quality of all processes, products and services. The strength of TQM lies in the overall contemplation of processes aiming at adding value to the customer through continuous improvement, in which all members of an organisation have to be involved. However, quite different ways are possible to apply this approach in practice. TQM offers no guidance on its practical implementation. Furthermore, this concept has to be adapted to a situation of a statistics chain from the countries to international institutions like Eurostat. This weakness leads to other models. The European Foundation for Quality Management (EFQM) developed a TQM-based quality model. This is an applied quality model with 9 criteria and 32 sub-criteria covering all aspects of TQM.
Other approaches are the Balanced Score Card (BSC), a tool to measure the quality of an organisation, DIN ISO systems with a focus on documenting, certifying and checking, Business Process Redesign (BPR), an approach used for fundamental changes in organisation, and Six Sigma, an approach on continuous improvement to shorten cycle times and increase yields. All these approaches can be used as basis for the development of a quality assurance concept for data on organic agricultural markets.
On the basis of a discussion about standardisation of methods used to satisfy the quality of statistics, a choice should be made between four concepts:
• Current best methods pointing out the best way for a certain process. • Minimum standards that are quality guidelines providing guidance on what is
important and what is not.
• Quality guidelines aiming to provide general good quality principles. • Recommended practices which are a collection of proven good methods.
2.1.3 Harmonisation
Harmonisation comprises comparability of statistical data and results and therefore is a very important part of every quality management concept of national and
international statistics institutions engaged in data collection, processing and dissemination, like Eurostat. The aim of harmonisation is to get data and statistical results that are comparable with regard to time, space and facts. Harmonisation is forced by the statistical institutions in the countries of the European Union to provide policy makers with comparable European wide data and results. For an international institution like Eurostat, harmonisation is a key issue of a quality management system.
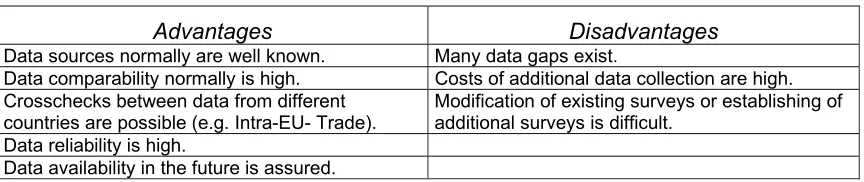
Table 2-2: Advantages and disadvantages of harmonised data
Advantages Disadvantages
Data sources normally are well known. Many data gaps exist.
Data comparability normally is high. Costs of additional data collection are high. Crosschecks between data from different
countries are possible (e.g. Intra-EU- Trade). Modification of existing surveys or establishing of additional surveys is difficult. Data reliability is high.
Data availability in the future is assured.
Source: http://esl.jrc.it/envind/sip/ag/Sip_ag05.htm
To get harmonised data the process should start at the phase of planning of data collection. One general problem with harmonisation is that the structures can vary from country to country due to historical developments, law and other issues like political aspects. The process of harmonisation must start with an analysis on what has to be measured and if this can be integrated in an international framework so that a universal reference concept can be developed. National institutions can use this and adapt it to their national system in an efficient way (Ehling et al., 2004). To proceed in the harmonisation process different harmonisation methods exist. From a methodical point of view harmonisation of input, also known as
harmonisation of methods, is the best strategy. In an ideal case, all countries and every involved institution use the same approaches for data collection and
processing. In contrast to the harmonisation of input, the harmonisation of output focuses mainly on the data and not on the approach for data collection. The way the data is collected can differ from country to country and is usually under the
responsibility of the institutions in the various countries. In statistics there are two approaches of harmonisation of output: the ex-ante harmonisation and the ex-post harmonisation. In the ex-ante strategy, the harmonisation process is part of the planning of data collection, so that at an early stage similar structures can be built up in different countries. Only very limited conversion between the processed data of the countries is necessary. In contrast, ex-post harmonisation is a conversion of existing statistics to get comparable statistics on an international level. The processed data can be the result of different methods of data collection and processing and has to be converted so that it is comparable between countries (Ehling et al., 2004).
From a methodical point of view harmonisation of input should be preferred because it will give the most comparable and coherent statistics. The advantage of the output harmonisation is that this strategy is more flexible and less expensive.
For example, on the European level a research project financed by the European Commission CHINTEX (The Change from Input Harmonisation to Ex-post
Harmonisation in National Samples of the European Community Household Panel – Implications on Data Quality) is trying to develop new concepts and approaches for harmonisation and statistical methods to improve results of ex-post harmonisation.
2.1.4 Practical experiences of Statistics Denmark
On the micro level, Statistics Denmark has reports from 10 respondents of which 7 are from supermarket chains and 3 are wholesalers. When they record volume and value for specific products, price per volume is calculated. Average prices for all respondents per product are then calculated. Subsequently, for each respondent the statistical office checks the deviance from the average price per product. If the deviance is too big, they contact the respondent. Furthermore, as a rule, wholesaler prices must be lower compared with supermarket prices.
Prices and assortment are checked against the supermarket’s weekly advertising. If there is a discrepancy, the respondent is contacted. Up to now, all respondents have been very positive when they were asked for further information. Hereafter,
wholesalers’ information is transformed into volume and value on retail level. On the macro level, Statistics Denmark checks its information with various sources:
• Information from various stakeholders,
• The new Statistics on Foreign Trade of Organic Products from Statistics Denmark,
• National Account from Statistics Denmark,
• Household Budget Survey from Statistics Denmark,
• Statistical information from other sources: The Danish Dairy Board, The Danish Veterinary and Food Administration, OMIaRD report (Hamm et al., 2002), etc.
In most cases the data from the above mentioned sources cannot be used directly for validation purposes, but after calculation assessment, it will give an impression about the quality of the data and, if necessary, then how to impute data from some of the above mentioned sources.
As this small example shows, in organic agriculture Statistics Denmark faces the problem that only very little information is available and often there is a lack of resources to do a good analysis.
2.2 Results of WP2, WP3 and the European seminar in Berlin
2.2.1 Introduction
This section analyses the current data collection practices in the organic sector, with specific focus on data quality and quality assurance in organic DCPSs. The analysis is based on information collected from the results of Workpackages 2 and 3 (Wolfert et al., 2004)), and during the first EISfOM European Seminar held in Berlin on April 2004 (Recke et al., 2004)).
The multiplicity of farm level DCPSs, and the importance that those data assume in the organic market and between users, makes it possible to acquire a more detailed analysis compared to the other levels. Although we are conscious of the importance that the data at this level assume in definition of both policies and firm market
strategies, the supply balance sheets level is the one on which we have faced major problems because of the limited information available, especially regarding the quality dimensions of the data.
2.2.2 Supply of and demand for organic sector data
Statistical information can be provided both as a public or a private good (Eurostat, 2002). When statistics are public goods they are characterised by non-excludability and non-rivalry in consumption. The market fails in providing sufficient levels of statistical data when they are characterised as public goods. Statistical information is a private good when it can be traded on the free market and can be provided on demand for a given price, like tailor-made surveys. In a similar way, we can define two categories of statistics users:
• public users – e.g. state/government agencies and the general public; • private users – e.g., companies, organisations and individuals who can
bargain the conditions of use, the timing of delivery and the quality/quantity of results.
As a consequence, “public” producers of statistical information are – usually – the only ones offering public goods, while statistical information as a private good can be supplied by all producers, irrespectively of their being public or private bodies. Users and producers put on a complex interaction aimed to find best solutions to satisfy user needs and to make optimal use of producers’ capabilities. In this “user-producer dialogue” we can define four steps. In the first one, the negotiation between user and producer defines the working system, with respect to quality characteristics of data and the framework of the DCPS, including the organisation and the applied methods of data collection and processing as well. In the second step, the producer, based on decisions taken at the first step, aims at obtaining the statistical information in accordance with the agreement negotiated with the user, and tries to produce its output in the most transparent way as possible, using documentation of quality standards, audits, peer reviews and internal quality checks. Once the statistical information has been produced, the dialogue starts again. In the third step, the raw material (data and figures) are turned into statistical information, i.e. a ready-to-use product which is interpreted and assessed by the user. Eventually, the producer goes back to step 2 until the information reaches the user requirements. In the fourth step, the statistical information is applied by the user in order to satisfy his/her own needs.
In the negotiation process between user and producer, an agreement is reached regarding the “quality” of the statistical product. Quality of statistical information can be considered a complex item that must be understood as the result of an
optimisation process in which both the user needs and the current external conditions of the data production process are addressed (Eurostat, 2002).
systems at different actors’ level, using results of EISfOM’s deliverable of working packages 2 and 3 and of the first European Seminar in Berlin.
As shown in Table 2-3 and Figure 2-2 most of data producers are concentrated at farm level, due to the actual amount of information in production sector and the stakeholders involved with; more than 60% are public organisations collecting most of all structural and economic farming data. At supply chain level, wholesaler and processing data are mostly (76%) collected by public DCPS. Almost all National Statistical Institutes (NSIs) collect data on trade but only few of them focus on organic products, too.
Only few DCPSs of governmental institutions collect data on retailer and consumer level. Most DCPSs at this level are run by private companies. At public level, the Household Budget Survey of Eurostat does not provide data on organic consumption in most countries, if we exclude Switzerland and Bulgaria where organic
consumption is covered as well.
Table 2-3: Type of organisations at different actor levels
Organisations
Actor level Private Public
Farm 33,8 66,2
Supply chain 23,5 76,5 Consumer/retailer 48,7 51,3 Supply balance - 100,0
Statistic data producers
Wholesaler/processor 14% Trade
28% Consumer
7%
farm level 37% Suppy balance
2% Retailer
[image:18.612.160.415.432.587.2]12%
Figure 2-2: Producers of statistics in the organic market
organisations such as organic farming associations and certification/inspection bodies.
Other private institutions focus mainly on data on the organic market: organic consumption, sales volumes and values, prices. These kind of data producers are mainly commercial market research companies, and the data collected is treated as a private good and is sold for an often (very high) price. In some countries public institutions or farm associations buy data from commercial providers and make them accessible for the general public. In other countries, these data only are bought by private companies (e.g. retailers, processors or wholesalers) and are not available for a broad audience.
The information available from the earlier EISfOM project deliverables (D2 and country reports) does not allow a deep analysis of users, but it is nevertheless possible to discuss here briefly their aims and general characteristics. At farm level, all private and public research institutions show deep interest in understanding the developing path of organic farming. Policy makers are probably – among all users – those most interested in having a broad overview of the sector, possibly allowing some dynamics and trend analyses. Farm level data are therefore crucial for these users, generally involved in regulating supply via agricultural policies, although there is an increasing interest for market and consumption data, given the recent revival of demand-side policy especially in the European organic sector1.
Other levels are characterised by little demand due to the weight that organic
products have in the total agrifood system. Apart from institutional researchers, main users are those involved in market research or business opportunities, focusing their attention on other aspects of public demand. Due to the high costs of data collection systems, usually users of consumer and retailer (panel) data are paying clients.
2.2.3 Data quality at specific actor levels
Farm levelRelevance: Data regarding organic farm structures are generally highly demanded by stakeholders, policy makers and researchers, which means that the relevance is quite high. As has been seen in the first chapter of this paper, users of farm-level data are characterised by different types of organisations and public and private users.
Accuracy: At this level data are collected on a representative basis. So it means that the estimated parameters are close to the true population parameters. This is, however, not true for all European countries. By analysing the country reports of WP2 and WP3 and using information available from another EU-funded RTD project (EU-CEE-OFP – Further development of European organic farming policy - QLK5-2002-00917), it is quite evident that a lot of problems exist regarding the accuracy of data, especially for the years before 2000. Only in a few countries – namely
Switzerland, Denmark, Austria and Norway – has the availability of accurate data has been in place since 1995. The lack of data accuracy is partially due to the
1
Demand-side policy has been almost neglected by European policy makers in the food and
difficulties of data collection, given the existence of multiple data owners such as inspection bodies, and to the variability of data types available in the various databases. Data are not complete because many DCPSs contain essentially only structural data (often only farm numbers and utilisable agricultural area (UAA), while the crop and livestock structure is not always available). Production data, both in volume and value, and prices are seldom available. The breakdown of data is often insufficient both in terms of product categories and of territorial units considered (NUTS2 and NUTS3 regional data are available only in a few countries).
Timeliness and punctuality: Due to the often sparse sources of information, the process of collecting and processing data is quite cumbersome and leads to delays in data availability and dissemination. In any case, farm-level DCPSs are more developed compared to other levels since most organisations collect data at least once a year. At the time of writing, the data available for most of the EU countries are nearly two years old.
Accessibility and clarity: Data are not available in all countries at the same depth and detail. In some countries only national data are available while in other countries regional breakdown is also accessible. Besides, the level of detail varies: in some countries only aggregate data are available for UAA at crop category (e.g. cereals) while in other countries a higher level of detail is available (e.g. winter wheat, durum wheat, oats, barley, etc.). When data are easily available and clear enough,
language problems and other semantic issues (e.g. differences in definitions) limit the data accessibility by a wide public at the EU level.
Comparability: At this level, the comparison of similar statistics between countries across space is relatively easy, while comparability across time is more difficult due to different availability of statistics in the last few years. At country level it often creates a lot of problems to compare similar statistics because of different
methodologies used by different organisations. The lack of harmonisation does not allow comparability among different DCPSs even at national level, where the large number of data owners (often inspection bodies) have different means of data storeage (in some cases data are still only stored on paper). In countries like Denmark or Finland, where a unique public inspection system that collect all data exists, the issue of national comparability is not relevant, but still there is the problem of comparing data across countries.
Coherence: DCPSs cannot be considered coherent because they are not based on common definitions, classifications and standard methodologies. There is a great coherence problem between different DCPSs, both at national and European level. One important example is the lack of coherence between data collected according to EU Reg. 2092/91 and those collected in the FSS. The results of the Berlin seminar demonstrated the need to find a solution to these problems with common criteria of collecting and processing data. The data collected by the FSS relate only to farms above a minimum farm size and minimum livestock units, which renders the data incomparable to those collected according to EU Reg. 2092/91.
Supply chain (wholesaler / processor level and import / export level)
Relevance: This level is characterised by a limited demand due to the weight that organic products have in a total agri-food system.
Accuracy: With respect to wholesaler / processor level, many of the DCPSs are representative because they are based on the whole population or a representative sample. Types of data collected at this level are not the same in every DCPSs; they are not able to give complete information on the supply chain level. If we consider levels of data collection on wholesaler / processor level (large wholesaler market, small / medium sized wholesaler market, processing industry, farmers and
certification bodies), our survey shows that certification bodies are rarely involved in data collection at this level. In general, large wholesale markets, small / medium sized wholesale markets, the processing industry and farmers are the most important levels for collecting wholesale and processing data both for total and organic products. Referring to data provided for product groups, organic data is most often provided for fruit and vegetables. For meat, milk and dry goods there is only one organic DCPS for each instance in the whole of Europe. At import / export level, as the organic sector in Italy, Turkey and Hungary is export-oriented, only data on organic exports are registered there. In UK and Switzerland it is the other way round. These are organic import countries and the organisations mostly collect data on organic imports. SGS in Bulgaria, CBS in the Netherlands, TIKE in Finland and Debio in Norway collect both data on organic imports and exports. All export-oriented DCPSs segment the data referring to product or product group and country of
destination. The import-oriented countries segment data both on product or product group and country of origin. The DCPSs which collect both data on import and export carry information on both the country of origin and destination and only these DCPSs allow a direct comparison between organic and conventional product trade data. Data are generally collected at harbours and other custom-relevant borders. Timelines and punctuality: Both data regarding wholesaler/processor and trade are collected periodically; in general, at an aggregate level (organic and conventional), they are available on an annual basis, often more frequently, too (weekly or
monthly). Organic data, when available separately, are often estimated annually or even less frequently.
Accessibility and clarity: Data are disseminated mostly on website and in reports: often the information is confidential. In most cases, organic data are not
distinguishable from total data in official DCPSs. Our survey has shown that on 40 known DCPSs on wholesaler / processor level, only 17 are separate DCPSs for organic data. At 12 DCPSs organic data are integrated in a total DCPS, but only with four of these are organic data distinguishable from a total one. Most often the
institutions answered that there was little or no demand from users for separate organic data. Methodological and financial aspects are mentioned as main barriers for the distinction/collection of separate organic data.
Comparability: The lack of harmonisation does not allow comparability in space and time among different DCPSs, both at national and European level. Most of the DCPSs are on a national basis. Only three of the German DCPSs are international. Almost all DCPSs on wholesaler/ processor level are not harmonised to a European system. Only one DCPS is harmonised. In general, there is a need for further development of the DCPSs in terms of harmonisation and comparability. The DCPS by Statistics Netherlands (CBS) could be an interesting case study and good
DCPS on trade covers both the total and organic sector. It is harmonised to Eurostat External Trade Statistics Database Comext.
Coherence: The issue of coherence could be easily resolved if a common
nomenclature could be used to distinguish organic data. At the moment, the data collected are not coherent since the method of estimation of the organic component varies from source to source.
Consumer/retailer level
Relevance: Available data are usually collected by private market research companies by means of surveys of single product or category. Large market research companies such as Databank, ACNielsen, GFK, etc. run these surveys since the information is sought after. Relevance is therefore assured. ACNielsen is planning to extend his survey to more products. BioVista started a specialised
retailer panel for organic food shops in Germany in 2003. Data is collected on a wide range of products. In Germany, the ZMP-Handelspanel exists which covers retail prices for organic and conventional products on a representative basis. Most surveys refer to single national markets and there is no European-wide public or private sector DCPS reporting on organic markets. The number of countries with a national organic DCPS on retailer level is limited. Only Switzerland, Germany, the Czech Republic, Italy and Denmark report DCPSs on that level. Concerning the consumer level, we can distinguish between public and private DCPSs. The Household Budget Survey (HBS) is a sample survey of private households carried out regularly under the responsibility of the National Statistical Offices (NSIs) in each of the 25 Member States of the EU belonging to the European Statistical System. The HBS has not had a legal basis and therefore it was run as a “gentleman’s agreement” among the Member States, some EFTA countries and Eurostat. So far, the HBS does not provide separate data on organic markets, with the exception of Switzerland and Bulgaria. Private market research companies such as GfK, ACNielsen and TNS operate household panels in many European countries. In some of the countries, organic products are surveyed separately. For some of the countries, detailed information on organic market data is available.
Accuracy: Usually the data cover representative samples of population but the data are not complete because they often do not cover out-of-home consumption
(restaurant, canteens, etc.) and small purchases. With respect to the retail level, we can notice the limited representation of point of purchase (store types) other than supermarkets, e.g. specialised organic shops, butchers, bakeries and discounters. If we exclude the last category, the reason given for the scarce representativity of many marketing channels is the lack of scanner till systems in small shops. In some countries, like Germany or Italy, where the market share of e.g. specialised organic shops is still quite high, this lack of representativity of the samples can lead to sever biases in data collection.
Timeliness and punctuality: In most countries, data are customised to special purposes and therefore do not exist as time series.
Comparability: As data on consumer and retailer panel are mostly gathered by private companies, there is no interest in harmonising them with those of other (competitor) companies. Given the data are often tailor-made to the research question to be answered, no comparison across space and over time is generally feasible.
Coherence: These DCPSs cannot be considered coherent since, in most cases, they are not based on common definitions, classifications and standard methodologies. It will be difficult to reach a harmonisation on consumer level since this sector is pre-dominated by private companies competing on the same markets. Nevertheless, the dominating companies should be encouraged to exchange experience and develop a standard for comparing results at an international level, at least within each of the companies. In the long run, they should be encouraged to develop a common standard.
Supply balance sheet level
Relevance: In nearly all European countries, supply balance sheets for the total supply exist, but there are no complete supply balance sheets for organic products. The lack of separate foreign trade data for organic products is the main reason for it: The relevance of supply balance sheets for organic products for policy makers is unquestionable, giving the opportunity to get specific information about the domestic production and market development as well as the import and export activities and the degree of self-sufficiency of organic products.
Accuracy: Currently, there is not enough organic data available to draw up organic supply balance sheets in any European country. Existing data are based upon estimates. Data available are not complete: data of production, processing and stocks do not exist in most countries; for external trade, there are no specific nomenclature codes for organic products.
Timeliness and punctuality: Supply balance sheets for organic products do not exist. Accessibility and clarity: See above.
Comparability: See above.
Coherence: At this level, there are a lot of problems of coherence because existing statistical systems are not based on common definitions, classifications and
methodological standards.
2.3
Strengths and weaknesses of organic DCPSs in Europe
2.3.1 Introduction
In order to improve the performance of a statistical system, it is customary to define its strengths and weaknesses. According to the model of the European Statistical System (ESS) (Eurostat, 2002) we can consider three different types of strengths:
• External, due to
o regulation, i.e. the capability of proposing legislation for the improvement of statistics to the relevant authorities;
• Internal, due to
o commitment to evolve and improve the system performances through a culture of partnership with other organisations and the willingness to learn from others;
o development and implementation of a harmonised methodology; o production of comparable statistics across each country and the EU; o continual training of statisticians.
• Others, due to
o best understanding of the importance of statistical information as tools for policy makers, especially with respect to EU policies;
o interest in Research and Development (RandD) statistics and help in the exploitation of expert knowledge in statistics.
The weaknesses considered are also divided into • External, when they depend on
o different ways of producing data;
o excess bureaucracy and lack of resources for obtaining/processing data
• Internal, when they depend on
o organisational view point, e.g. lack of communication user/producer; lack of funding, etc.;
o production, e.g. lack of harmonised data and analysis, need for better marketing, etc.;
o human resources, e.g. difficulties in people’s turnover, no further methodological training, etc.
• Others, e.g. cultural differences.
By analysing the responses to the EISfOM surveys as reported in D2 and country reports, we can summarise the strengths and weaknesses of statistical information systems on organic agriculture at different actors’ levels.
2.3.2 Farm level
StrengthsExternal
• legal acts concerning collection of administrative data exist
• FADN has a more consolidated legal basis, and is recently being extended to organic data.
Internal
• farm level DCPSs that contain organic data seem to be more developed in comparison to other actor levels;
• in many DCPS it is possible to make clear distinctions between converted and in conversion farms;
• several DCPSs, especially FADN, are harmonised to an international DCPS;
• in most FADN systems, organic data are distinguishable from total data; Other
• some countries (e.g. France and Finland) developed good practice in DCPS management that may be a useful example for other countries.
Weaknesses External
• the European Action Plan for Organic Food and Farming explicitly mentions the weakness in production data collection that has to be improved;
• data are not always made publicly available or are not reported at all;
• most national and regional governments report the data on a voluntary basis rather than a compulsory basis. This also poses problems of coherence and consistency of the data collection systems (e.g. data are not available at the same depth all years, etc.);
• different formats (e.g. produced animals/stock of animalss) and often several collectors of data from organic farms in one country;
• in many countries at farm level, no distinction is made between in conversion and fully converted organic farms, or the definitions of converted, (fully or partly) and in conversion farms (1st year, 2nd year, partly or fully in conversion) and farm products are not clear;
• certification bodies disseminate the data freely on a voluntary base only in a few countries at present
• even when certification bodies would be able to provide the most precise figures about the national organic farm structure, the certification bodies are not obliged to report the data of certified organic farms;
• the disclosure of data available at certification bodies is often limited by their close partnerships to organic farm associations which try to keep data of their associated farms confidential.
Internal
• lack of harmonisation to a European system;
• in some cases, no consistent definition of organic farming is used by different data sources (e.g. farm structure survey vs. administrative data);
• in several systems small farms (usually < 2 ha) are not taken into account, which sometimes means that a substantial part of organic farming activity is left out;
• some systems do not distinguish many product groups, which makes them less valuable;
• the representativeness is often a problem, even in harmonised Eurostat systems like FADN: theoretically they should be representative, but in reality this is sometimes hard to accomplish;
• data quality is also a recurring problem: many systems are only visually checked by experts, but this is not very good;
• many DCPSs are still stored in “primitive” electronic formats, like Excel sheets;
• only FADN seems to have – in most cases - a quality management system in place;
• the information on organic farming is still rather incomplete: in most countries time series are hardly available before 2000, regional breakdown is quite poor, and even the production structure is rather basic, allowing to distinguish only among very aggregate crops (e.g. cereals, pastures, etc.);
• different software is used and many ‘databases’ will lack an appropriate data definition;
• lack of communication between different data collection systems
• different DCPSs are not harmonised or even simply “communicating” between each other (e.g. FSS and EC2092/91);
• extra-collection of data when administrative data are not available is often claimed to be too expensive;
• there are only a few systems for production and price statistics in which organic data is distinguishable;
• data quality of the national organic farm structure based on information using the FSS is hard to interpret;
• published organic food and farming data are often not very up-to-date: data are often released with a delay of 2 to 3 years.
2.3.3 Supply chain (wholesaler/processor and import/export level)
StrengthsInternal
• in countries where they exist (only very few), most DCPSs on wholesaler and processor level are representative because the whole population or a
representative sample is the basis for data collection;
• data are collected quite frequently (e.g. often on a weekly or monthly basis), especially at wholesaler / processor level;
• most of the data collected are checked by a quality management system (wholesaler /processor level);
Weaknesses External
• traceability and control of sales of organic as organic by inspection bodies is still not uniform throughout Europe: the need of new (electronic?) systems to improve integrity and traceability of organic systems (which should come into force in the coming year) is a useful opportunity to comply with statistical needs as well.
Internal
• there are only few DCPSs present at this level, mainly at wholesaler / processor level;
• DCPSs at the wholesaler /processor level are not harmonised to a European system;
• in most of the DCPSs at this level, organic data are not distinguishable from total data;
• only few DCPSs exist which collect data both on organic and total foreign trade;
• most of the organic market data are unreliable and inaccurate and are based on expert estimates rather than collected by proper statistical surveys on representative samples;
• most of the data are not available for public use;
• most of the data are stored in a often poorly structured electronic format.
2.3.4 Consumer and retailer level
StrengthsExternal
• some legal acts exist concerning the collection of consumer data (e.g. Household Budget Survey - HBS).
Internal
• organic products are included in DCPSs covering the total markets. Therefore, organic data is usually comparable with total data;
• figures provided by consumer and retailer panel usually have a high validity. Weaknesses
External
• the European Action Plan for Organic Food and Farming explicitly mentions market data collection to be improved;
Internal
• systems are not harmonised to an international level: besides, as data on consumer and retailer panels are mostly gathered by private companies, there is no real interest in harmonisation;
• often consumer panels do not collect data on all product groups when surveying organic expenditures;
• therefore, there is a limited representation of different store types, e.g. panels do not cover specialised organic shops;
• data collection and processing at retailer and consumer level are very expensive, and the sector and the market size for organic products are still small;
• the demand for organic product data by paying users is limited; • most data are stored in an often poorly structured electronic format.
2.3.5 Supply balance sheet
StrengthsExternal
• legal acts exists concerning data collection of supply balances in national and international economic accounts.
Weaknesses External
• no official data collection for organic products. Internal
• no complete supply balance sheets for organic products in any European country;
• deficiency in the DCPSs of production data is also hampering the availability of supply balance sheets;
• external trade: no specific nomenclature codes for organic products exist, which renders difficult data collection on organic trade;
• no organic data are available for input-output flows in processing and stocks; • quality management done only by visual check by experts.
2.3.6 Summary for all levels
Strengths and weaknesses of organic DCPSs at all levels can be summarised as follows: Organic DCPSs are mostly developed at farm level due to a more
At supply chain level, the main weakness is the impossibility of distinguishing organic data from the total. In general, at this level there is more a need to develop DCPSs than to harmonise existing data sets. Consumer and retailer data have often high quality but are not easily available for public users. Most data are collected by different private companies, so there is little harmonisation.
At supply balance sheet level, the problem is that there are no data in any country. In general, the major cause for the weaknesses identified is the low overall importance (in terms of contribution to Gross National Product (GNP)) that the organic sector has. However, GNP is not a very good measure of socio-economic welfare, and it is well demonstrated that organic farming and its related supply chain provide public goods which are not valued in GNP calculations (Dabbert et al., 2004). Therefore, the relevance of the organic sector is much beyond its actual size and weight in the European economy.
2.4 Proposals for the different actor levels
In this section, proposals for the different actor levels are formulated and, in the last part, key conclusions of the European seminar are formulated.
2.4.1 Farm and processor level
There is a need for the reporting of organic production and processing data under EC Regulation 2092/91 to be mandatory, with the methodology and definition of categories fully harmonised, and the process to be supported by public authorities. In addition, there should be improved collaboration between the ministries responsible for the Farm Structure Survey and responsible authorities and certifiers (according to EC Regulation 2092/91), with the setting up of a common system to avoid overlap and harmonise definitions and methodology. This registration could form the basis of a data collection on organic markets. In this system, the problems of on-farm use and sales of organic products as organic or conventional have to be solved. Furthermore, FADN data is not enough and should be extended. Currently, the organic sample in FADN is not representative, so an increasing number of organic farms and the integration of additional variables on organic issues in the current FADN could be a basis for an improved system. The integration of organic data collected by other organisations into an existing data collecting system should be considered, but harmonisation requires a common approach with a lot of flexibility. The example of Denmark shows that an organic sub-sample with a high number of organic farms (sample rate) might be a solution. However, up to now there is no harmonised system existing how the data are to be processed. To improve the situation in accordance to the quality dimensions, a coordination of different systems is necessary. The process should be facilitated by the development of electronic data collection tools, for quality assurance and reduced workload of data collectors and operators as well as for the development of a harmonised system for
dissemination of (electronic) reports. The experience of Finland and Denmark shows that a single identification number system (one farm has one number) can help to simplify administrative problems. If only few processors exist, the secrecy of their data has to be guaranteed.
2.4.2 Supply chain (wholesaler and import/export level)
system should be developed to process and to improve the quality of the data. Electronic data collection and processing tools should be an integral part of a quality management system and may lead to a reduced workload of data collectors and operators as well as for the development of a harmonised system for dissemination of (electronic) reports. Privacy issues need to be tackled in order to be sure that data is really available to users (user rights). As some stakeholders do not cooperate with each other, an authority will introduce a new DCPS more easily. Official initiatives, however, are not welcomed everywhere, which can affect the feasibility of data collection. Experiences of different countries show that the feasibility of mandatory data collection varies from country to country.
If the existing data collection on the Intra- and Extra-EU-Trade level is extended to a differentiation between organic and conventional data, most of the organic market data needed by market actors and policy makers can be provided. In the existing system where data is collected in the countries and sent to Eurostat, an additional digit (organic/non-organic) needs to be included to the records. This will allow distinguishing between conventional and organic products. In addition certification bodies should be obliged to deliver their information about trade to the national statistical institutions, so that the data of the above proposed extended system could be checked.
Recovery of trade data can be approached at relatively low cost without the need of new activity / product classification by matching existing information, as done in Denmark. The Danish example provides an alternative low cost strategy for the recovery of trade / supply-chain data, facilitated by a single identification number for each operator used by every organisation dealing with them. The more widespread adoption of this approach would simplify data harmonisation and quality assurance. Raw data collected by stakeholders often have to be processed for the supply chain members so that the relevance of data can be improved. For the supply chain, scanner data are of very high quality (accurate, timely, relevant, etc.). If they can be combined and harmonised with other databases, the information would be very relevant.
2.4.3 Consumer/retailer level
In Europe, no harmonised system exists for collecting and processing data on the retailer level for organic products. As the introduction of a new representative system on this level in a time of limited resources will cost a great deal, it will be almost impossible to convince policy makers and the responsible statisticians in Europe to introduce such a system. In Denmark in 2004, it has been planned to survey
turnover data of organic products of retailers. As the Danish system to collect data is based on an identification system, every retailer can be identified which makes it easier to bring the information on different levels together for further calculation. In addition, private companies engaged in data collection and processing might be asked to work together to develop a harmonised European wide system. At the European Seminar the supply-chain group recommended that further intensive expert information exchange is required, which could be facilitated by the
At the consumer level, the only harmonised system available is the Household Budget Survey. As the example of Switzerland shows, this system can be extended to a system where organic products can be distinguished. Due to the high costs to implement a representative system, it will be very difficult to convince policy-makers and leading statisticians in every country to introduce such a system. Therefore, the possibility of creating ad-hoc surveys analysing the consumption of organic products should be considered seriously, rather than trying to adapt the existing HBS.
In addition, the leading private companies engaged in panel surveys at this level can be asked to work together to build up a harmonised system. As these companies however, compete on the market, experts presume without financial support they will not work together to develop a harmonised system.
2.4.4 Supply balance sheets
On the supply balance sheet level additional data collection and harmonisation are needed. Production data for organic crops can be supplied by a test farm survey implemented similarly to the conventional data. This system will be very costly. Discussion at the European seminar showed that much data could be available from the certification bodies. However, up to now, certification bodies are not obliged to provide statistical institutions with data. For the production level, it was proposed that data should be collected by certification bodies and should be delivered to national statistical institutions. On the trade and the consumption level, data collection can be carried out similarly to the total statistics by adding a digit (organic/non organic) in the report forms. On the consumption level, the problem of organic products sold as conventional was discussed and several options to solve this problem were
mentioned (extra survey or additional column in existing forms).
3 Barriers to the implementation of improved organic
statistical data collection and processing systems
The aim of this section is to identify the main bottlenecks or barriers for the
introduction of the proposed improved organic DCPS at international and national level, based on interviews with experts and stakeholders who participated in the Berlin seminar.
3.1 Approach
P1 (University of Wales, Aberystwyth), P6 (University of Ancona) and P10
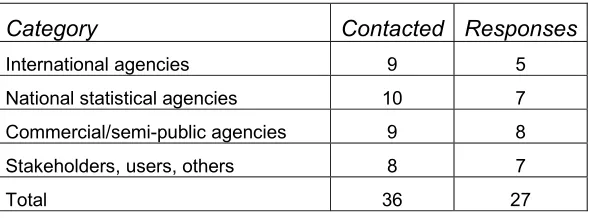
(University of Kassel) prepared a draft list of recommendations emerging from the results of WPs 2 and 3 as well as the Berlin seminar (WP4.1). This list was circulated (by e-mail) to 27 participants of the Berlin seminar, as well as to nine others who were aware of the seminar but had not been able to participate, with a request for them to agree to a telephone interview to discuss the recommendations, potential barriers or bottlenecks and possible solutions.
The recipients were selected to represent a range of national and international statistical agencies as well as stakeholders, data users and commercial market research firms. In order to maximise willingness to be open, comments were
[image:32.612.91.387.399.508.2]obtained on a non-attributable and informal basis, so that it is not possible to identify the individuals contacted, but the breakdown by number in each category is given in the table below. The results are based on 27 interviews and e-mail responses. Table 3-1: Results of the interviews
Category Contacted Responses
International agencies 9 5 National statistical agencies 10 7 Commercial/semi-public agencies 9 8 Stakeholders, users, others 8 7
Total 36 27
3.2 Results
After each recommendation, reference is made to the relevant level(s), which relate to the different levels of activity discussed earlier in this report. These are:
1. Production structure and output; 2. Farm incomes and prices; 3. Supply chain;