This is a repository copy of
Mapping across feature spaces in forensic voice comparison:
the contribution of auditory-based voice quality to (semi-)automatic system testing
.
White Rose Research Online URL for this paper:
http://eprints.whiterose.ac.uk/117386/
Proceedings Paper:
Hughes, Vincent orcid.org/0000-0002-4660-979X, Harrison, Philip Thomas
orcid.org/0000-0003-2419-2388, Foulkes, Paul orcid.org/0000-0001-9481-1004 et al. (3
more authors) (Accepted: 2017) Mapping across feature spaces in forensic voice
comparison: the contribution of auditory-based voice quality to (semi-)automatic system
testing. In: Proceedings of Interspeech 2017. , Stockholm, Sweden . (In Press)
[email protected]
https://eprints.whiterose.ac.uk/
Reuse
Items deposited in White Rose Research Online are protected by copyright, with all rights reserved unless
indicated otherwise. They may be downloaded and/or printed for private study, or other acts as permitted by
national copyright laws. The publisher or other rights holders may allow further reproduction and re-use of
the full text version. This is indicated by the licence information on the White Rose Research Online record
for the item.
Takedown
If you consider content in White Rose Research Online to be in breach of UK law, please notify us by
Mapping across feature spaces in forensic voice comparison: the contribution of
auditory-based voice quality to (semi-)automatic system testing
Vincent Hughes
1, Philip Harrison
1,2, Paul Foulkes
1, Peter French
1,2,
Colleen Kavanagh
1, Eugenia San Segundo
11
Department of Language and Linguistic Science, University of York, UK
2J P French Associates, York, UK
{vincent.hughes|philip.harrison|paul.foulkes|peter.french| colleen.kavanagh|eugenia.sansegundo}@york.ac.uk
Abstract
In forensic voice comparison, there is increasing focus on the integration of automatic and phonetic methods to improve the validity and reliability of voice evidence to the courts. In line with this, we present a comparison of long-term measures of the speech signal to assess the extent to which they capture complementary speaker-specific information. Likelihood ratio-based testing was conducted using MFCCs and (linear and Mel-weighted) long-term formant distributions (LTFDs). Fusing automatic and semi-automatic systems yielded limited improvement in performance over the baseline MFCC system, indicating that these measures capture essentially the same speaker-specific information. The output from the best performing system was used to evaluate the contribution of auditory-based analysis of supralaryngeal (filter) and laryngeal (source) voice quality in system testing. Results suggest that the problematic speakers for the (semi-)automatic system are, to some extent, predictable from their supralaryngeal voice quality profiles, with the least distinctive speakers producing the weakest evidence and most misclassifications. However, the misclassified pairs were still easily differentiated via auditory analysis. Laryngeal voice quality may thus be useful in resolving problematic pairs for (semi-)automatic systems, potentially improving their overall performance.
Index Terms: forensic voice comparison, MFCCs, LTFDs,
auditory analysis, voice quality, system validity
1.
!
Introduction
1.1.!Forensic voice comparison
Forensic voice comparison (FVC) involves the analysis of the speech patterns of an unknown offender (e.g. covert recordings of drugs deals) and those of a known suspect (e.g. a police interview). The expertÕs role is to evaluate the strength of the voice evidence under the competing propositions of the prosecution (Ôthe suspect and offender are the same personÕ) and the defence (Ôthe suspect and offender are different peopleÕ). The decision on guilt lies with the trier of fact.
Different approaches to FVC are used by experts, which can broadly be divided into automatic, semi-automatic, and phonetic methods. Automatic and phonetic approaches have largely developed in isolation from each other [1,2,3]. They differ primarily in terms of the features analysed and their conceptual treatment of the speech signal. Automatic methods typically treat the signal holistically, extracting and modelling spectral features to generate a probabilistic outcome, based on
long-term resonance properties of the vocal tract. Phonetic analysis is grounded in a componential approach which decomposes the signal into linguistically relevant units, such as vowel and consonant phonemes, and applies standard acoustic and auditory methods to capture their properties. These analyses are combined to generate an overall conclusion. Semi-automatic methods represent a hybrid of these approaches.
1.2.!Current practice
Around the world, FVC casework is predominantly conducted using only phonetic analysis [4,5], for various reasons. First, while the performance of automatic speaker recognition (ASR) systems has improved considerably (with error rates for state-of-the-art systems less than 1% under certain conditions), much of the research in ASR has not considered the complexities of FVC casework [6]. Secondly, there is a longer history of courts admitting phonetic evidence. In England and Wales and in Northern Ireland this is enshrined in legal precedent (R v Robb 1991; R v OÕDocherty 2002; R v Flynn & St John 2008).
There are also more fundamental issues with the use and acceptance of ASR systems in FVC casework. ASR systems are often perceived as being Ôblack boxesÕ (i.e. the internal mechanisms and algorithms are opaque, either due to lack of accessibility and/or lack of understanding) both by experts outside of speech technology and particularly by lawyers and the courts. This is primarily because the short-window spectral features extracted by ASR systems are Òdifficult to directly relate (to) the physiological traits of an individualÓ [7]. This makes the findings difficult to explain, in contrast to phonetic features which can be described to the court in non-technical terms, and demonstrated by the expert or by playing samples. The uncertainty about ASR systems is reflected in the Court of Appeal ruling in R v Slade & Ors [2015] which essentially rejected ASR-based evidence. There were various issues with the ASR evidence, including whether it constituted new evidence over and above that provided by the phonetic analysis at the original trial. The court also displayed fundamental misunderstandings about how ASR systems work, further propagating the Ôblack boxÕ myth. The ruling is binding on lower courts and will set back the use of ASR systems in casework by some years in the UK.
1.3.!Integration of phonetic and automatic methods
increasing focus on the integration of the best elements of the different methods to improve FVC evidence [8,9]. Fundamental to this development is an understanding of the methodsÕ strengths and weaknesses. This involves examining how different methods capture speaker-specific information, the relationships between methods, the underlying source of any difference in the speaker-specific information captured, and the extent to which the combination of approaches might improve the overall performance of FVC systems.
However, few studies have attempted to address such issues ([10,11] are exceptions). Notably, [12] evaluated the falsely accepted pairs (different-speaker classified as the same speaker) by an i-vector ASR system using auditory and acoustic phonetic analyses. Although the differences between pairs resulted from a range of features, voice quality (VQ) was considered of Òfundamental importanceÓ for distinguishing voices. However, while the phonetic analysis highlighted the Ôback-endÕ value of VQ in separating speakers, it did not address how this information might be useful for front-end prediction of problematic speakers for the automatic system [11].
1.4.!This study
This study evaluates the complementarity of the speaker-specific information captured by long-term automatic (MFCCs), semi-automatic (LTFDs), and phonetic measures (VQ). These features were selected because they are commonly used in each of the three main approaches, encode considerable speaker-specific information, and model long-term vocal output. In this sense, the analyses are directly comparable.
1.4.1.! Features
Mel frequency cepstral coefficients (MFCCs; automatic) are used extensively in automatic systems. They are a rich representation of the Mel-weighted power spectrum capturing information about the supralaryngeal vocal tract by, in principle, decoupling it from laryngeal information. MFCC-based systems are often used as a baseline against which to assess the potential value of additional features [10,11].
Long term formant distributions (LTFDs; semi-automatic features) model vowel formant values extracted across an entire speech sample. The analysis requires information about vowel boundaries, but is not segmental in that all vowels are modelled together. LTFDs capture information about the maximal extents of the acoustic vowel space and, by inference, the geometry of the supralaryngeal vocal tract. The use of vowel formants is ubiquitous in FVC casework [1,13]. LTFDs have also received some attention in FVC [14,15] and have been shown to provide useful speaker-specific information. However, only a limited amount of previous work has examined the complementarity of LTFDs and MFCCs using empirical system testing [16]. We also examined Mel-weighted LTFDs ((M)LTFDs), as they are predicted to be more closely correlated with MFCCs.
Voice quality (VQ; phonetic features) refers to long term, quasi-permanent vocal ÔsettingsÕ [17], also referred to as ÔtimbreÕ. VQ is defined separately in terms of supralaryngeal settings (e.g. nasality, back/front tongue orientation) and laryngeal settings (e.g. creaky phonation). Most experts examine VQ regularly in casework [4] with some using a recognised framework such as the Vocal Profile Analysis (VPA) scheme [18]. Those surveyed in [4] also considered VQ the most useful phonetic speaker discriminant in FVC cases (more than segmental features; e.g. vowel formants). For the present study, we analysed VQ using a version of the VPA
modified for FVC [19] with 25 supralaryngeal and 7 laryngeal dimensions. For each feature, there are four possible scalar points, with 0 representing ÔneutralÕ and 1-3 representing increasing degrees of Ônon-neutralÕ features (labelled ÔslightÕ, ÔmarkedÕ, or ÔextremeÕ).
1.4.2.! Analysis and hypotheses
Likelihood ratio-based (LR) system testing was conducted using the automatic and semi-automatic features. These features were also combined (using score-level fusion) to assess the potential improvement in automatic system performance with the addition of semi-automatic features. Following [12], the best performing system was used to identify falsely classified pairs which were then analysed systematically in terms of VQ. The typicality of features was assessed relative to a larger set of VQ profiles for a representative population sample. As measures of long-term vocal tract (filter) output, the MFCCs, LTFDs, and supralaryngeal VQ features should, in principle, capture similar speaker-specific information. However, the link between the acoustic features and the VQ features is likely to be weakened by the fact that VQ is processed via the human auditory system. Given the fundamental principles of source-filter theory, the laryngeal VQ features are predicted to encode complementary speaker-specific information to the vocal tract output measures.
2.
!
Method
2.1.!Materials
Recordings were taken from the DyViS corpus (100 men, aged 18-25, Standard Southern British English) [20]. It was collected for forensic phonetic research and contains multiple tasks relating to a mock crime. We used high-quality recordings from Tasks 1 and 2 (44.1 kHz, 16-bit, 9-30 min. duration). Task 1 was a mock police interview. Task 2 was a spontaneous near-end, telephone conversation about the crime between the participant and an ÔaccompliceÕ. Samples were recorded on the same day, but with some time separation between sessions.
2.2.!Pre-processing
The audio files were edited to remove overlapping speech, background noise, and long silences. The edited intervals were concatenated, the audio resampled at 10 kHz, and time stamps for utterance boundaries extracted. A Praat script automatically identified sections containing signal overload (ÔclippingÕ). Voice activity detection was performed in MATLAB using the
vadsohn function from the VOICEBOX toolbox [21]. Silence was defined as a series of adjacent non-speech frames over 100ms [22]. The output of the VAD analysis was also checked manually for a subset of the recordings to confirm that the default threshold was able to categorise voice and non-voice. Finally, the edited audio was segmented into consonants (C) and vowels (V) using StkCV [23], and time stamps for the onset and offset of strings of V intervals were extracted.
2.3.!MFCC and LTFD extraction
(ΔΔ) coefficients. Cepstral analysis was performed using the rastamat toolbox [24] in MATLAB. The LTFD feature vector consisted of F1 to F4 frequencies, bandwidths (BWs), and Δs extracted using the Snack Sound toolkit [25]. LTFD frequencies and BWs were Mel-weighted to generate the (M)LTFD feature vector, to which Δs were appended.
2.4.!Voice quality analysis
The edited recordings for Task 2 were analysed by authors PFo, PFr, and ESS independently the version of the VPA described in [19]. A cross-coder calibration process produced agreed profiles for each speaker. A subset of profiles, identified as those speakers falsely classified by the best performing automatic system (see 3.4), was then analysed by ESS for Task 1. Data for all 100 speakers were used to assess the typicality of VPA features.
2.5.!Post-processing
Feature vectors within three frames of utterance boundaries were removed, as well as frames with clipping or silence [26]. From the remaining frames, those within sections defined as vowels by the StkCV script were extracted for analysis. Samples were then reduced to 60 secs of net speech (6000 frames). Speakers with fewer than 60 secs were removed, leaving 94 speakers.
2.6.!System testing and evaluation
The speaker-discriminatory value of MFCCs, LTFDs, and (M)LTFDs was examined using likelihood ratio (LR)-based testing [27,28]. The 94 speakers were randomly divided in sets of training (31 speakers), test (31), and reference data (32). Although the number of speakers is relatively small compared to large-scale testing of automatic systems, such samples are common in FVC research [29]. Same- (SS) and different-speaker (DS) scores were computed for the training and test data using the GMM-UBM approach [30] implemented using the MSR toolbox [31]. The reference data were used to create a UBM against which to assess typicality. Suspect GMMs were created using maximum a posteriori (MAP) adaptation in which the means, variances, and weights of the UBM were adapted towards the suspect data. Separate sets of scores were computed for each form of input data. Based on pre-testing, GMMs for the LTFDs and (M)LTFDs used 32 Gaussians, while the MFCC GMMs used 1024 Gaussians.
The scores for the training data were used to train logistic regression models [32], and the coefficients applied to the scores for the test data to generate calibrated log10 LRs (LLRs)
for each system. The same approach was used to fuse each of the LTFD and (M)LTFD systems with each of the MFCC systems, but with coefficients derived from multivariate logistic regression models (i.e. score-level fusion). In total, parallel sets of 31 SS and 465 independent DS LLRs were produced for 11 individual systems (4 LTFD, 4 (M)LTFD, and 3 MFCC) and 24 fused systems (4 LTFD x 3 MFCC, and 4 (M)LTFD x 3 MFCC). System performance (validity) was evaluated using equal error rate (EER) and the log LR cost function (Cllr) [33].
3.
!
Results
3.1.!MFCC systems
The worst performing automatic system used only MFCCs as input (6.45% EER, 0.267 Cllr). Consistent with [34], the
addition of derivatives produced a marked improvement. The best performing MFCC system used both Δs and ΔΔs, producing an EER of 3.23% and a Cllr of 0.146.
3.2.!LTFD and (M)LTFD systems
The best performing LTFD system (shaded in Table 1) included BWs but not Δs (6.45% EER, 0.255 Cllr), although the
[image:4.595.321.527.248.346.2]improvement over the LTFD-only system was marginal. The (M)LTFD systems all performed considerably worse than the LTFD systems. The addition of BWs and Δs worsened performance, with the (M)LTFD-only system producing the best validity (shaded). All LTFD and (M)LTFD systems performed worse than the best performing MFCC system.
Table 1: Validity (EER and Cllr) of each of the LTFD
and (M)LTFD systems, best systems shaded.
System EER (%) Cllr
LTFDs 6.67 0.284
LTFDs+BWs 6.45 0.255
LTFDs+ Δs 6.99 0.311 LTFDs+BWs+Δs 6.67 0.259
(M)LTFDs 8.29 0.290
(M)LTFDs+BWs 9.68 0.462 (M)LTFDs+Δs 9.57 0.325 (M)LTFDs+BWs+Δs 9.68 0.507
3.3.!Fused systems
The fused systems were evaluated in terms of raw and percentage improvements in EER and Cllr over the associated
baseline MFCC system (Figure 1).
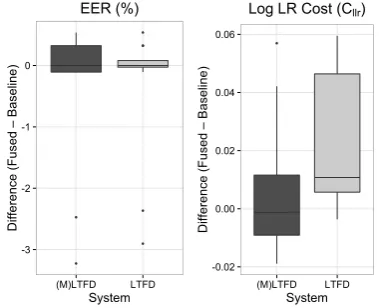
Figure 1: Distributions of raw EER (L) and Cllr (R)
differences between the fused systems using (M)LTFDs and LTFDs and baseline MFCC system.
Across all fused systems, the addition of LTFD and (M)LTFD information had relatively little effect on EER. For eight systems, the addition of formant information reduced EER by maximally 0.53% in terms of the raw value. For nine systems, the fused EER was identical to the MFCC system, while for seven systems the addition of formant information produced higher EERs. Fusion also had relatively little effect on Cllr. On
average the difference between the fused and baseline systems was 0.02, equivalent to an 8.8% improvement in Cllr. For just
four of the 24 fused systems the decrease in Cllr was more than
0.01. For two systems, the addition of LTFDs worsened Cllr. For
the (M)LTFD-fused systems, the average difference from the
-3 -2
-1
0
(M)LTFD LTFD
System
D
if
fe
re
n
ce
(F
u
se
d
Ð
Ba
se
lin
e
)
EER (%)
-0.02 0.00
0.02
0.04 0.06
(M)LTFD LTFD
System
D
if
fe
re
n
ce
(F
u
se
d
Ð
Ba
se
lin
e
)
[image:4.595.331.521.409.563.2]baseline was just 0.006, equivalent to 2.4% improvement over the baseline, while half of the fused (M)LTFD systems produced higher Cllr than the baseline. Despite the limited effect
of formant information, the best system overall was a fused system using MFCCs+Δs+ΔΔs and LTFDs.
3.4.!Voice quality
In this section, we evaluate the output of the best performing fused system in terms of speakersÕ VQ profiles. The contrary-to-fact LRs produced by this system (3.3) were analysed to evaluate the potential complementarity of VQ and (semi-)automatic analyses. These errors consisted of one false rejection (SS comparison producing DS evidence) and 13 false acceptances (DS comparison producing SS evidence) Ð this is equivalent to the numbers of trials in [9] and [12]. In this study, supralaryngeal and laryngeal VQ features were evaluated separately, due to the underlying differences in what information they capture, in principle (see 1.4.2.).
3.4.1.! Supralaryngeal features
Of the 13 falsely accepted DS pairs, nine involved speakers #067 and #072. Both had unremarkable supralaryngeal VQ profiles relative to the group of 100 DyViS speakers and were non-neutral only for very common features: slight advanced tongue tip/blade (shared by 32% of speakers), slight fronted tongue body (67%), and slight nasality (63%). These features are so common as to be considered accent features for this population [18]. This indicates that speakers with highly typical supralaryngeal VQ profiles may be those that the automatic system has difficulty separating from other speakers. To test this more robustly, a Euclidean distance was calculated between each test speakerÕs VQ profile and the average (mode) VQ profile for all speakers in the corpus. These distances were correlated with the mean LLRs across all DS comparisons involving each test speaker produced by the best fused system.
A weak negative correlation (PearonÕs R = -0.283) was found between mean DS LLRs for each speaker and the typicality of their supralaryngeal VQ profile. That is, speakers with typical (common) supralaryngeal VPA profiles were, to a limited extent, more likely to produce weak LLRs or system errors. However, of the falsely accepted pairs there were also some which were very different, and thus easily separable, in terms of their supralaryngeal profiles. Speaker #066 was non-neutral for lip spreading and close jaw, while speaker #037 was neutral for these features. These differences are marked given that these features were shared by just 5% and 1%, respectively, of the speakers in this data set.
3.4.2.! Laryngeal features
The misclassifications were easily resolved using laryngeal VQ information. In eight of the 13 false acceptances, differences of between two and three scalar degrees occurred for at least one laryngeal setting. Interestingly, in these cases one speaker was typically neutral and the other was non-neutral (i.e. the setting was absent vs. present). The falsely classified pairs were also given to two practicing forensic voice experts for blind analysis. Both experts correctly separated all of the misclassified pairs and commented that phonation was the primary feature that underpinned their judgements.
4.
!
Discussion
The results of LR-based testing revealed a number of important
patterns for automatic and semi-automatic FVC. Firstly, linear LTFDs consistently outperformed Mel-weighted LTFDs. This may be due to the Mel scaleÕs lower resolution representation of higher frequencies compared with linear Hz values. Thus, the Mel weighting may fail to capture the considerable speaker-specific information encoded in higher frequency formants. Secondly, when fused with MFCCs, the formant information provided little or no improvement over the baseline systems. This suggests that LTFDs do not provide independent speaker-discriminatory information to MFCCs.
Supralaryngeal VQ features appear to capture at least some of the information encoded by the MFCCs and LTFDs. The results in 3.4.1 provide some evidence that speakers with inherently unremarkable supralaryngeal VQ profiles are more likely to be the ones that produce weak LRs and errors. This relationship may be useful in making front-end predictions about which speakers will be problematic for automatic systems. This is also consistent with the predicted underlying relationship between supralaryngeal VQ features and MFCCs/ LTFDs (1.4.2). However, within the errors produced by the best performing automatic system, there were still pairs of speakers who were separable based on their supralaryngeal VPA profiles. The issue may then be one of resolution. That is, VPA may be a lower resolution representation of supralaryngeal vocal tract output than LTFDs or MFCCs. However, given the inherent differences in methodology for the extraction of the phonetic measures, it may be that the issue is one of weighting rather than resolution. It is likely that there are properties of the voice that are perceptually salient and in isolation may suffice for speaker separation, but which are not captured by holistic acoustic measures. Similarly, there may be features weighted very strongly for the acoustic measures that are less marked to the human auditory system.
The laryngeal VQ profiles and blind auditory analysis revealed that, on this limited set of comparison, it is possible to resolve pairs misclassified by the automatic system using phonation features (as in [12]). This indicates that important, and indeed complementary, speaker-specific information is encoded in laryngeal features relative to both auditory and acoustic supralaryngeal vocal tract output. Thus, it may be possible to improve the performance of automatic systems by incorporating laryngeal information [35].
5.
!
Conclusions
We investigated the complementarity of automatic, semi-automatic, and phonetic measures of vocal output for FVC. Results showed strong relationships between MFCCs, LTFDs and (M)LTFDs in terms of the speaker-specific information they encode. Importantly, there appears to be some relationship between these measures and supralaryngeal VQ. This may allow us to better explain to the courts what information automatic systems capture and to identify potentially problematic cases. The apparent independence of laryngeal features suggests that this information might help improve automatic systems.
6.
!
Acknowledgements
7.
!
References
[1]! P. Foulkes and J. P. French, ÒForensic speaker comparison: a linguistic-acoustic perspective,Ó in P. Tiersma and L. Solan (Eds.), Oxford Handbook of Language and the Law. Oxford: OUP, pp. 557Ð572, 2012.
[2]! A. Eriksson, ÒForensic phonetics,Ó in Tutorial Session on Forensic Speech Science, INTERSPEECH 2005 Ð 6th Annual Conference of the International Speech Communication Association, September 4Ð8, Lisbon, Portugal, Proceedings, 2005, pp. 100Ð104.
[3]! M. Jessen, ÒForensic phonetics,Ó Language and Linguistics Compass, vol. 2, pp. 671Ð711, 2008.
[4]! E. Gold and J. P. French, ÒInternational practices in forensic speaker comparison,Ó International Journal of Speech, Language and the Law vol. 18, pp. 293Ð307, 2011.
[5]! G. S. Morrison et al., ÒINTERPOL survey of the use of speaker identification by law enforcement agencies,Ó Forensic Science International vol. 263, pp. 92Ð100, 2016.
[6]! M. Ajili, J-F. Bonastre, B. Kheder Waad, R. Solange, and J. Kahn, ÒPhonetic content impact on forensic voice comparison,Ó in IEEE Spoken Language Technology Workshop (SLT), December 13-16, San Diego, USA, Proceedings, 2016, pp. 210Ð217.
[7]! J. Franco-Pedroso and J. Gonz‡lez-Rodriguez, ÒLinguistically-constrained formant-based i-vectors for automatic speaker recognition,Ó Speech Communication vol. 76, pp. 61Ð81, 2016. [8]! C. Greenberg, A. Martin, L. Brandschain, J. Campbell, C. Cieri,
G. Doddington, and J. Godfrey, ÒHuman assisted speaker recognition in NIST SRE2010,Ó in Odyssey 2010: The Language and Speaker Recognition Workshop, June 28Ð1 July, Brno, Czech Republic, Proceedings, 2010, pp. 180Ð185.
[9]! R. Schwartz, J. Campbell, W. Shen, D. E. Sturim, W. M. Campbell, F. S. Richardson, R. B. Dunn, and R. Granville, ÒUSSS-MITLL 2010 human assisted speaker recognition,Ó in
ICASSP 2011 Ð IEEE International Conference on Acoustics, Speech and Signal Processing, May 22Ð27, Prague, Czech Republic, Proceedings, 2011, pp. 5904Ð5907.
[10]!C. Zhang, G. S. Morrison, and T. Thiruvaran, ÒForensic voice comparison using Chinese /iau/,Ó in ICPhS 2017 Ð 17th International Congress of Phonetic Sciences, August 17Ð21, Hong Kong, Proceedings, 2011, pp. 2280Ð2283.
[11]!E. San Segundo, A. Tsanas, and P. Gomez, ÒEuclidean distances as measures of speaker similarity including identical twin pairs: a forensic investigation using source and filter voice characteristics,Ó Forensic Science International vol. 270, pp. 25Ð 38, 2017.
[12]!J. Gonz‡lez-Rodriguez, J. Gil, R. Perez, and J. Franco-Pedroso, ÒWhat are we missing with vectors? A perceptual analysis of i-vector-based falsely accepted trialsÓ, in Odyssey 2014: The Language and Speaker Recognition Workshop, June 16Ð19,
Joensuu, Finland, Proceedings, 2014, pp. 33Ð40.
[13]!F. Nolan and C. Grigoras, ÒA case for formant analysis in forensic speaker identification,Ó International Journal of Speech, Language and the Law vol. 12, pp. 143Ð173, 2005.
[14]!M. Jessen and T. Becker, ÒLong-term formant distribution as a forensic-phonetic feature,Ó in Special Session on Forensic Voice Comparison and Forensic Acoustics, 160th Meeting of the Acoustical Society of America (ASA), November 15Ð19, Cancun, Mexico, Proceedings, 2010.
[15]!E. Gold, Calculating likelihood ratios for forensic speaker comparisons using phonetic and linguistic parameters, Unpublished PhD Thesis, University of York, UK, 2014. [16]!T. Becker, Automatischer forensischer Stimmenvergleich.
Norderstedt: Books on Demand, 2012.
[17]!J. Laver, The Phonetic Description of Voice Quality. Cambridge: CUP, 1980.
[18]!J. Laver, S. L. Wirz, K. Mackenzie, and S. Miller, ÒA perceptual protocol for the analysis of vocal profiles,Ó Edinburgh University Department of Linguistics Work in Progress vol. 14, pp. 139Ð155, 1981.
[19]!E. San Segundo, P. Foulkes, J. P. French, P. Harrison, and V. Hughes, ÒVoice quality analysis in forensic voice comparison: developing the vocal profile analysis scheme,Ó in IAFPA 2016 Ð Annual Conference of the International Association of Forensic Phonetics and Acoustics, July 24Ð27, York, UK, 2016.
[20]!F. Nolan, K. McDougall, G. de Jong, and T. Hudson, ÒThe DyViS database: style-controlled recordings of 100 homogeneous speakers for forensic phonetic research,Ó International Journal of Speech, Language and the Law vol. 16, pp. 31Ð57, 2009. [21]!VOICEBOX: Speech Processing Toolbox for MATLAB.
http://www.ee.ic.ac.uk/hp/staff/dmb/voicebox/voicebox.html
[22]!H. J. KŸnzel, ÒSome general phonetic and forensic aspects of speaking tempoÓ, Forensic Linguistics vol. 4, pp. 48Ð83, 1997. [23]!R. Andre-Obrecht, ÒA new statistical approach for automatic
speech segmentationÓ, IEEE Transactions on ASSP vol. 36, pp. 29Ð40, 1988.
[24]!Rastamat Toolbox for MATLAB.
http://labrosa.ee.columbia.edu/matlab/rastamat/ [25]!K. Sjšlander, Snack Sound Toolkit.
http://www.speech.kth.se/snack/
[26]!E. Enzinger, G. S. Morrison, and F. Ochoa, ÒA demonstration of the application of the new paradigm for the evaluation of forensic evidence under conditions reflecting those of a real forensic-voice-comparison case,Ó Science and Justice vol. 56, pp. 42Ð57, 2016.
[27]!C. G. G. Aitken, and F. Taroni, Statistics and the Evaluation of Evidence for Forensic Scientists, Chichester: Wiley, 2004. [28]!G. S. Morrison, ÒForensic Voice Comparison and the Paradigm
ShiftÓ, Science and Justice vol. 49, pp. 298Ð308, 2009. [29]!G. S. Morrison, ÒA comparison of procedures for the calculation
of forensic likelihood ratios from acoustic-phonetic data: multivariate kernel density (MVKD) versus Gaussian mixture model Ð universal background model (GMMÐUBM),Ó Speech Communication vol. 53, pp. 242Ð256, 2011.
[30]!D. A. Reynolds, T. F. Quatieri, and R. B. Dunn, ÒSpeaker Verification using Adapted Gaussian Mixture Models,Ó Digital Signal Processing vol. 10, pp. 19Ð41, 2000.
[31]!S. O. Sadjadi, M. Slaney, and L. Heck, ÒMSR Identity Toolbox v1.0: A MATLAB Toolbox for Speaker Recognition Research,Ó
IEEE Speech and Language Processing Technical Committee Newsletter, 2013.
[32]!N. BrŸmmer et al., ÒFusion of Heterogeneous Speaker Recognition Systems in the STBU Submission for the NIST SRE 2006,Ó IEEE Transactions on Audio Speech and Language Processing vol. 15, pp. 2072Ð2084, 2007.
[33]!N. BrŸmmer, and J. du Preez, ÒApplication-Independent Evaluation of Speaker Detection,Ó Computer Speech and Language vol. 20, pp. 230Ð275, 2006.
[34]!J. P. Campbell, ÒSpeaker Recognition: A TutorialÓ, in ICASSP 1997 Ð IEEE International Conference on Acoustics, Speech and Signal Processing, April 21Ð24, Munich, Germany, Proceedings,
1997, pp. 1437Ð1462.