ostat
EXTERNAL TRADE
AND BALANCE OF PAYMENTS
Monthly statistics
D 1993
Part 1 : Commentaries
Part 2: External trade
eurostat
OFICINA ESTADÍSTICA DE LAS COMUNIDADES EUROPEAS
DE EUROPÆISKE FÆLLESSKABERS STATISTISKE KONTOR
STATISTISCHES AMT DER EUROPÄISCHEN GEMEINSCHAFTEN
ΣΤΑΤΙΣΤΙΚΗ ΥΠΗΡΕΣΙΑ ΤΩΝ ΕΥΡΩΠΑΪΚΩΝ ΚΟΙΝΟΤΗΤΩΝ
STATISTICAL OFFICE OF THE EUROPEAN COMMUNITIES
OFFICE STATISTIQUE DES COMMUNAUTÉS EUROPÉENNES
ISTITUTO STATISTICO DELLE COMUNITÀ EUROPEE
BUREAU VOOR DE STATISTIEK DER EUROPESE GEMEENSCHAPPEN
SERVIÇO DE ESTATÍSTICA DAS COMUNIDADES EUROPEIAS
L2920 Luxembourg Tél. 43 011 Télex COMEUR LU 3423
B1049 Bruxelles, rue de la Loi 200 Tél. 299 11 11
Las publicaciones de Eurostat están clasificadas por temas y por series. La clasificación se encuentra al final de
la obra. Para mayor información sobre las publicaciones, rogamos se pongan en contacto con Eurostat.
Para los pedidos, diríjanse a las oficinas de venta cuyas direcciones figuran en la página interior de la
contracubierta.
Eurostats publikationer er klassificeret efter emne og serie. En oversigt herover findes bag i hæftet. Yderligere
oplysninger om publikationerne kan fås ved henvendelse til Eurostat.
Bestilling kan afgives til de salgssteder, der er anført på omslagets side 3.
Die Veröffentlichungen von Eurostat sind nach Themenkreisen und Reihen gegliedert. Die Gliederung ¡st hinten in
jedem Band aufgeführt. Genauere Auskünfte über die Veröffentlichungen erteilt Eurostat.
Ihre Bestellungen richten Sie bitte an die Verkaufsbüros, deren Anschriften jeweils auf der dritten Umschlagseite
der Veröffentlichungen zu finden sind.
Οι εκδόσεις της Eurostat ταξινομούνται κατά θέμα και κατά σειρά. Η ακριβής ταξινόμηση αναφέρεται στο
τέλος κάθε έκδοσης. Για λεπτομερέστερες πληροφορίες σχετικά με τις εκδόσεις, μπορείτε να
απευθύ-νεσθε στην Eurostat.
Για τις παραγγελίες μπορείτε να απευθύνεσθε στα γραφεία πώλησης, των οποίων οι διευθύνσεις
αναγράφονται στη σελίδα 3 του εξωφύλλου.
Eurostat's publications are classified according to themes and series. This classification is indicated at the end of
the publication. For more detailed information on publications, contact Eurostat.
Orders are obtainable from the sales offices mentioned on the inside back cover.
Les publications d'Eurostat sont
classées par thème et par série. Cette classification est précisée à la fin
de l'ouvrage. Pour des informations plus détaillées sur les publications, contactez Eurostat.
Pour les commandes, adressez-vous aux bureaux de vente dont les adresses sont indiquées à la page 3
de la couverture.
Le pubblicazioni dell'Eurostat sono classificate per tema e per serie. Tale classificazione è precisata alla fine
dell'opera. Per informazioni più dettagliate sulle pubblicazioni rivolgersi all'Eurostat.
Per eventuali ordinazioni rivolgersi a uno degli uffici di vendita i cui indirizzi figurano nella 3a pagina della
copertina.
De publikaties van Eurostat zijn ingedeeld naar onderwerp en serie. Deze indeling is achter in het boek
opgenomen. Voor nadere informatie over de publikaties kunt u sich wenden tot Eurostat.
Gelieve bestellingen op te geven bij de verkoopbureaus, waarvan de adressen op bladzijde 3 van de omslag zijn
vermeld.
As publicações do Eurostat estão classificadas por tema e por série. Esta classificação está indicada no firn da
obra. Para mais informações sobre as publicações é favor contactar Eurostat.
EXTERNAL TRADE
AND BALANCE OF PAYMENTS
Monthly statistics
Part 1 : Commentaries
Part 2: External trade
Luxembourg: Office for Officiai Publications of the European Communities, 1993
© ECSC-EEC-EAEC, Brussels · Luxembourg, 1993
Reproduction is authorized, except for commercial purposes, provided that the source is acknowledged.
NOTE
This edition combines external trade and balance of payments statistics for the Community,
the aim being to provide the reader with all statistical information relating to the Community's
external transactions.
Owing to different periodicities of data collection (monthly for external trade, quarterly for
balance of payments), figures for the balance of payments will appear four times a year in this
publication.
The statistical tables will be preceeded by a concise analysis which will comment upon the
main economic trends. To this end, certain Community aggregates will be estimated if the
necessary data is available for most member states.
Foreword
Two important changes have taken place in 1988 with regard
to the collection of external trade statistics:
(i) The introduction of the Single Administrative Document,
which not only covers trade in Community goods
between Member States but is also intended to be used
for the corresponding formalities in trade with
non-member countries. This simplification of declaration pro
cedures in the exchange of goods marks an important
step towards completion of the internal market.
(ii) The simultaneous entry into force of a new goods classi
fication known as the Combined Nomenclature (CN),
which is intended to meet Common Customs Tariff and
statistical requirements alike. This nomenclature is
based on the Harmonized Commodity Description and
Coding System (HS), whose aim is to enhance the world
wide comparability of external trade statistics.
As a result of both these changes, customs and statistical
departments were faced with a considerable amount of work
until the procedures had been properly introduced and
tested and formed part of normal working practice.
This meant that there were delays in the forwarding of data
in all the Member States. In addition, there was bound to be
a higher quota of errors and corrections, so that the first
month's data are not directly comparable with those of the
preceding year and therefore need to be interpreted with
caution.
In particular, it should be noted that considerable diver
gences have arisen at subheading level between the Combi
ned Nomenclature and the formerly used Nimexe, leading to
a break in the goods-related time series between 1987 and
1988. Up to December 1987 this Bulletin used the SITC Rev.
2, which was worked out using the 6-digit Nimexe, while
from January 1988 it uses the SITC Rev. 3, which has been
drawn up using the 8-digit subheadings of the Combined
Nomenclature.
As an aid to interpretation of the statistics, Eurostat has
published in Theme 6 'Foreign Trade, Series E: Methods'
brochures entitled 'Nomenclature of goods, CN-Nimexe cor
relation tables'. These provide a comparison between the old
and new nomenclatures as well as showing the links bet
ween the Combined Nomenclature (CN) and its offshoots.
Eurostat will be glad to provide users of European statistics
with any further information or explanations they may require
with regard to these new developments.
Important note
As from October 1990 the foreign trade figures of the Federal Republic of Germany, the other Member States and of EUR 12
concern the Federal Republic of Germany as constituted from 3 October 1990.
Table of contents
Commentary
Charts
General summary of trade by country:
Tab. 1: Yearly and quarterly data .
Tab. 2: Monthly data
General summary of trade by commodities:
Tab. 3: Yearly and quarterly data
Tab. 4: Monthly data
Trends in trade by country:
Tab. 5: World, intra- and extra-EC . . .
Tab. 6: Intra-EC by member countries
Tab. 7: Major areas
Trends in trade by commodities:
Tab. 8: SITC sections
Trade by partner countries:
Tab. 9: All commodities (monthly cumulative data)
Tab. 10: SITC sections and main partner countries (quarterly cumulative data)
Indices:
Tab. 11: Volume and unit value indices
Trade of main non-Community countries:
Tab. 12: Trends in total trade and with the EC (EUR 12)
Conversion rates:
Tab. 13: Member countries, United States of America, Japan and Switzerland
EC trade in agricultural products:
Tab. 14: Main product groups ,
Tab. 15: Products subject to common agricultural policy regulations
EC trade in petroleum products:
Tab. 16: Petroleum and petroleum products
EC and world trade:
Tab. A: World, Community and main non-Community countries
Trade of the FR of Germany, including West Berlin, as constituted prior to 3 October 1990:
Tab. B: Trade by countries
Tab. C: Trade by products
Catalogue of regular publications of external trade
VII
XXIII
8
11
16
24
30
52
92
100
140
142
146
148
152
164
168
169
172
175
Symbols and abbreviations used
EUR 12:
UEBL:
DK:
D:
GR:
E:
F:
IRL:
I:
NL:
P:
UK:
USA:
Total of the EC member countries
Belgo-Luxembourg Economic Union
Denmark
Federal Republic of Germany
Greece
Spain
France
Ireland
Italy
Netherlands
Portugal
United Kingdom
United States of America
0: Data less than half the unit used
Mio: Million
Mrd: 1 000 million
ECU: European currency unit
Eurostat: Statistical Office of the European Communities
SITC: Standard International Trade Classification
Commentary and graphs
(The commentary refers to the state of the CRONOS database on 27. 4. 1993,
TREND database on 27. 4. 1993)
Available data in this issue:
December 1992
(The tables refer to the state of the
Methodological notes:
EUR 12
X
UEBL
X
DK
X
D
X
GR
Χ
E
Χ
F
Χ
IRL
Χ
I
Χ
NL
Χ
CRONOS database on 4. 5.1993)
See Glossarium 1992
As from the beginning of January 1988: SITC, Revision 3
Ρ
Χ
UK
Seasonal Adjustment: Results
Seasonally adjusted European Community
ex-ports to the rest of the world (extra-EC) began
picking up in mid-1991, following a downward
trend at the end of 1990. Since then, they have
fluctuated around the high level first recorded at
the beginning of 1990. As economic growth in the
Community ' s main trading partners picks up
hesi-tantly, the trade figures again show a slight upward
movement. In December 1992, seasonally
ad-justed extra-EC exports rose by 2.5% compared to
November 1992.
Seasonally adjusted European Community
im-ports from the rest of the world (extra-EC)
in-creased strongly during December 1992 (+4.6%
compared to November 1992) following a steady
decrease since the beginning of 1992. This
in-crease probably reflects an improving economic
situation in certain EC Member States.
The European Community's seasonally adjusted
trade balance, which had started to improve during
the second half of 1991, worsened during the last
two months of 1992 to reach a deficit of 4.7 billion
ECU in December. The trade deficit is now back
to its January 1992 level.
Trade between EC Member States (intra-EQ has
stabilised at a high level, following the upward
trend observed since the beginning of 1991. In
December 1992, seasonally adjusted trade
be-tween European Community Member States rose
by 1.7% compared to November 1992.
EUR 12 Exports Extra-EC
Bk>. ECU
1984 1985 1986 1987 1988 1989 1990 1991 1992
EUR 12 Imports Extra-EC
Bio. ECU
— Unadjusted
— Seasonally Adjusted
1984 1985 1986 1987 1988 1989 1990 1991 1992
— Unadjusted — Seasonally Adjusted
70 ,·
6 S |
60 r
55!·
50^
45 r
40 |
35
ï
30
I-25
'-EUR 12 Imports Intra-EC
EUR 12 Trade Balance Extra-EC
1984 1985 1986 1987 1988 1989 1990 1991 1992
Unadjusted Seasonally Adjusted
Bio. ECU
Seasonally Adjusted Series(2) Mrd. ECU
Period
Exports ExIraEC
Not Adjusted
Seasonally
Adjusted
Importe ExtraEC
Not Adjusted
Seasonally
Adjusted
Imports IntraEC
Not Adjusted
Seasonally
Adjusted
Trade Balance ExtraEC
Not Adjusted
Seasonally
Adjusted
Jan89
Feb89
Mar89
Apr89
May89
Jun89
Jul89
Aug89
Sep89
Oct89
Nov89
Dec89
Jan90
Feb90
Mar90
Apr90
May90
Jun90
Jul90
Aug90
Sep90
Oct90
Nov90
Dec90
Jan91
Feb91
Mar91
Apr91
May91
Jun91
Jul91
Aug91
Sep91
Oct91
Nov91
Dec91
Jan92
Feb92
Mar92
Apr92
May92
Jun92
Jul92
Aug92
Sep92
Oct92
Nov92
Deo92
30,3
30,9
34,8
33,7
33,4
37,4
34,0
31,3
34,4
37,6
37,1
37,4
34,1
33,6
37,7
33,3
35,6
35,1
35,5
31,4
31,2
38,8
36,9
35,4
32,6
31,7
34,4
34,5
34,4
34,6
38,6
32,1
34,3
40,0
37,5
38,4
32,7
34,2
38,3
37,1
34,0
35,9
39,4
30,1
35,7
39,8
36,6
40,8
33,4
33,0
34,0
33,6
34,0
35,9
33,9
34,3
35,9
34,6
35,2
34,9
37,2
36,0
35,5
35,0
35,6
35,0
34,0
34,6
32,9
35,2
34,9
33,9
34,8
33,9
34,0
34,3
34,6
35,1
36,4
36,5
35,8
35,4
36,6
35,5
35,2
36,2
36,1
37,4
36,0
35,3
36,5
35,5
35,9
36,4
35,7
36,6
35,4
34,3
38,0
37,6
39,1
40,1
35,3
34,4
37,7
40,6
39,1
34,8
39,6
35,6
40,2
87,1
39,4
37,8
36,8
35,2
36,6
43,9
41,9
36,0
43,0
37,3
39,2
43,3
42,3
40,4
43,9
37,0
'41,6
44,5
42,2
38,3
41,4
.
39,8
44,0
42,5
40,0
40,6
42,0
33,3
39,8
41,4
39,4
40,5
35,4
36,0
36,9
37,0
38,1
39,0
37,0
37,2
38,1
37,9
37,8
37,3
38,7
37,6
37,9
37,6
37,7
37,7
36,7
38,7
38,0
40,4
40,4
39,0
41,6
39,5
38,8
40,8
40,9
41,3
42,8
41,7
42,6
40,6
41,8
40,2
40,6
41,4
41,1
41,1
40,6
39,3
40,9
39,0
38,9
39,3
395
41,3
47,7
49,1
54,1
52,0
52,5
57,3
50,4
42,5
50,8
58,1
56,4
51,5
53,9
52,3
60,6
54,4
56,6
54,7
54,8
44,5
53,3
62,3
61,1
52,6
59,3
56,0
59,6
60,0
59,1
59,0
61,9
45,6
57,3
64,9
60,6
57,0
58,1
60,0
66,2
62,9
58,4
60,9
62,3
44,4
59,3
63,0
59,4
59,0
49,8
49,8
50,4
505
51,6
54,1
52,2
52,0
52,8
53,2
53,7
53,9
55,8
53,2
54,7
54,4
54,3
53,9
54,0
55,7
55,7
57,2
56,4
54,0
59,7
56,9
56,7
56,9
57,6
58,7
60,3
58,1
58,8
58,4
59,8
58,5
59,4
60,2
59,3
60,7
59,5
58,0
60,1
58,6
59,1
58,8
58,2
59,2
5,1
3,4
3,2
3,9
5,7
2,7
1,3
3,0
3,3
3,0
2,0
2,5
5,5
2,0
2,5
3,7
3,8
2,7
1,3
3,8
5,3
5,2
5,0
0,6
10,5
5,7
4,9
8,8
7,9
5,7
5,3
4,9
7,3
■4,4
4,7
0,1
«,6
5,6
5,7
5,4
6,0
4,7
2,6
3,1
4,1
1,6
2,9
0,4
2,0
3,0
2,8
3.3
4.2
3,1
3,1
2,9
2,2
3,3
2,7
2,4
1,5
1,6
2,3
2.5
2,1
2,8
2,7
4,1
5,1
5,2
5,4
5,1
6,8
5,6
4,8
6,4
6,3
6,2
6,4
5,1
6,8
5,2
5,1
4,7
5,4
5,2
5,1
3,7
4,6
^ , 1
Λ 4
3,5
3,0
2,9
3,8
4,7
(1) As from October 1990, the territory of the Federal Republic of Germany includes the territory of the former German Democratic Republic, including East Beriin.
Community results are drawn up accordingly.
[image:11.595.47.564.15.773.2]GLOBAL TRENDS:
Results for December 1992.
The Community registered an external trade surplus of ECU 0.4 billion. Japan
one of ECU 7.71>illion and the United States a deficit of ECU 7.5 billion.
Community s external tra
52.1 billion, compared 1
gap between the rates
trade de
, compared to ECU 7
frates ofchange ir
6 DOints ιη 199T to
deficit for 1992 was
-J70.5.billionin1991.
change in exports and
_ η 199T to more than +4
-Community exports were almost
.. in 1992 than in the previous year, with imports
down "by 1.3% as a result of a drop of 5% per barrel in
dollar terms and 9% in ecu terms in the cost of crude oil
supplies to the Community during the year.
ΜοΉ*
In December 1992 the Community
external trade surplus of ECU 0.4 bill
- in December 1991. Ex
, up by 6.4%. slightly outstripp
+5.6%). The cost of the Community's crude
.5% per barrel ι
:xtra- ommupity ex-
ing imports
crude oil supplies
igi._
C
orts were up by 6.4%. slightly outst
f5.6%). The cost of the Community's cr
iroppea by 2.5% per barrel in dollar terms, out an
increase of 2.4% in ecu terms contributed to the growth
in imports.
|D 1992 the .United States, reg
¡stored a trade deficit of
ECU 81 billion - ECU 12 biiffon worse than in 1991.
Imports were 4.4% up on their 1991 level in ecu terms
E
nd oyer 9% up in dollar terms. US exports increased
y 1.7% in ecu terms and by 6% m dollars.
The USA's trade deficit m December 1992 was ECU 7.5
billion, compared to ECU 5.7 billion in December 1991.
Imports were substantially higher than in 1991: 18.2%
up in ecus and 13% up in dollar terms. Exports grew at
the slightly slower rates of 15.4% in ecu terms and 10%
in dollars.
Japan's 1992 surplus
of ECU 82.2 billion was almost
ECU 20 billion more tpan in 1991. Japanese exports
were 3.4% up on 1991 in ecu terms and 8% up in dollars,
but remained more or less stable n yen terms (+1%).
Japan s imports were appreciably down ]n ecus (-5.6%)
and yen (-8%) but scarcely changed in dollar terms
Japan's trade.surplus irj December 1992 was ECU 7.7
billiop as against 6.1 billion in the same month of the
- year. Exports were up by 10.7% in ecg terms
r% in dollars while remaining stable in yen.
previous vear. Exports were up by 10.7% in ecg terms
and by 5% in dollars while remaining stable in yen.
Imports were 4,5% up in ecus, remained stable in dollars
and fell by 8% in
yen.
GR.II- IMPORTS AND EXPORTS (CIF, FOB)
(annual % change in value)
s-ii/
EUR12
USA
Imports
JAPAN
U Exports
COUNTRIES
EUR-12(2)
United States"
Japan
BLEU
Denmark
Germany
Greece
Spain
France
Ireland
Italy
Netherlands
Portugal
United Kingdom
EUR-12(2)
United States"
Japan
BLEU
Denmark
Germany
Greece
Spain
France
Ireland
Italy
Netherlands
Portugal
United Kingdom
EUR-12(2)
United States"
Japan
BLEU
Denmark
Germany
Greece
Spain
France
Ireland
Italy
Netherlands
Portugal
United Kingdom
Memorandum Item
1 USD = ...ECU
1YEN = ..ECU
1989
-33,7
-116,1
58,4
-2,2
1,2
64,0
-7,8
-19,3
-14,9
3,1
-11,2
3,5
-6,6
-41,1
15,2
14,6
20,6
15,2
10,5
15,4
40,0
27,3
16,6
19,8
18,7
14,2
13,4
7,8
13,8
21,3
11,3
16,7
11,3
13,1
48,6
16,0
16,2
18,6
17,6
16,7
23,5
11,7
7,3
-0,3
1990
-42,9
-95,2
41,2
-5,6
2,4
47,4
-3,2
-20,1
-17,3
2,3
-3,3
0,3
-6,7
-31,9
1991
1992
1992
III
1992
IV
TRADE BALANCE (Bio ECU)
-70,5
-68,9
62,8
-7,2
2,6
9,2
-10,4
-21,3
-15,4
2,7
-10,4
-2,7
-7,9
-22,3
-52,1
-80,9
82,2
-63
4,3
15,3
-10,6
-21,8
-7,0
5,0
-8,2
-5,4
-9,0
-26,9
-9,2
-25,2
18,9
-1,6
1,1
6,0
-2,3
-«,7
-2,1
1,1
0,5
-0,7
-2,2
-7,9
IMPORTS
-6,7
-24,6
22,7
-0,9
1,4
3,6
-2,9
-3,8
-13
1,4
0,0
-3,6
-2,6
-43
1991
12
0,1
-5,7
6,1
-03
0,3
2,4
-1,1
-13
-1,3
0,3
1,2
-0,4
-0,7
0,5
% change o n the corresponding period of the previous year
3,6
-9,3
-3,9
6,0
2,9
10,3
6,0
7,7
4,9
3,8
2,9
5,3
14,0
-1,6
6,8
1,1
3,8
4,0
4,8
16,6
11,8
9,6
4,3
3,3
2,9
3,7
7,9
-3,6
-1,3
4,4
-Í.6
-0,6
0,3
0,3
3,1
3,0
-0,4
-0,2
-1,0
23
7,8
1,2
-6,6
-5,9
-11,8
-4,3
-2,4
-3,4
6,7
2,0
-2,1
-1,1
-3,5
-3,4
14,0
-1,0
EXPORTS
-0,8
83
-5,5
-2,1
-2,1
3,4
-8,8
-€,9
-3,4
03
-93
13,9
6,6
-3,2
6,5
9,6
-123
8,4
6,7
3,9
47,3
14,0
93
9,7
5,1
10,5
9,9
4,9
% change o n the corresponding period of the previous year
1,6
-6,2
-93
2,3
7,3
2,8
-7,8
9,3
3,9
-0,6
4,7
2,0
11,7
4,6
0,9
9,9
12,7
2,6
5,2
2,1
10,5
11,2
5,9
4,8
2,2
1,0
2,4
2,2
2,9
1,7
3,4
0,1
6,0
2,2
4,6
3,3
4,1
11,7
0,6
0,4
4,3
-13
0,3
-93
-6,0
-0,5
3,1
1,6
-5,8
4,5
1,6
7,4
3,2
-1,3
14,9
-4,9
1,5
4,8
3,5
0,3
6,5
1,5
11,2
-1,3
0,2
8,8
-6,4
0,9
-5,0
-7,0
8,5
11,9
11,4
7,3
3,2
6,6
16,2
6,7
12,7
4,7
4,2
3,4
2,7
12,3
% change o n the corresponding period of the previous year
-13,5
-17,3
2,8
10,4
-4,6
1,4
-15,1
-7,2
-0,9
4,3
5,1
9,6
1992
12
0,4
-7,5
7,7
-0,9
0,3
0,1
-1,5
-1,3
-0,1
0,5
1,1
-0,6
-0,9
-0,6
1
5,6
18,2
4,5
6,3
4,5
12,8
26,3
4,7
0,2
5,1
-10,9
6,4
10,8
3,0
6,4
15,4
10,7
5,2
3,2
3,2
10,4
5,4
8,2
13,6
-11,2
4,1
-6,8
-5,4
5,0
8,5
(1) External Trade Statistics (Imports CIF, Exports FOB).
(2) EUR-12 includes only extra flows. Figures for Member States include world flows.
* Estimate.
EXTRACOMMUNITY TRADE BY PARTNER COUNTRY: Results for December 1992.
A Community trade deficit of ECU 0.2 billion with the United States: 0.9 billion less
than in December 1991.
In 19
48
bifhonwith Industrialised <
992 the Community register
nt of ECU 3.1 b Won over 1
istered a trade defiqt of ECU
countries
an improve
^ 1991. Its deficit with
nd ECU 13 billi
4 billion in 1992, compared to 2 billion in 1991.
from industrialised
rts from the USÆ
ìctor beino the
1.991
i
199¿
Imports from industri
bele
ow their 1991 level. Imports from the
the dollar against t
nity ffnj
countries
,_ jrts from the .
tjy 5.6%, one contributory factor being the 4.6% fall of
e almost 2%
were down
Communi.,
countries (+0
Exports to Ini
ecu between .
an i0,.6%) and the
orts trom
Jap-...
Vo)
showed little chai
Wb
Exports to ing_usfria,liseg countries fell by 1%_in 1992,
with those to EFTAin slight decline (1.1%). Exports to
the USA expanded by 3.8% while those to Japan shrank
by J · '
Ιη December 1992 the Community deficit with the indus
trialised countries was ECU 2.3 billion an improvement
over December 1991, The trade balance
trialised countries
\
of 0.7 billion over _
with the USA improved by 0.9 billion, while the deficit
with the EFTA countries worsened by half a billion ecus.
The Community trade balance with Japan remained
close to its December 1991 level.
Imports from industrialised countries were roughly the
same in December 1992 as they had been a year earlier
(+0.5%). Imports from the EFTA countries were almost
5% up, while those from Japan were up by 2%. Imports
from the USA were 2 . 1 % down on their December 1991
fevel.
Exports to the industrialised countries were 4 % up ¡n
December 1992, boosted by the 12.5% increase in
exports to the USA. Exports to the EFTA countries
remained stable, while those to Japan fell by 4.5%.
The Community registered a trade surplus of ECU 7.1
" e l o p i n g countries Γη 1992 a
.7 BIJIIOTL Half of this improvei
/ith the OPEC countries, which was
11992 at ECU0.7 bi"
billion with the
develo
around of ECU 14.7
was due to trade with ..
almost in balance in 1$92 at
1992 a turn
this improvement
ntries, which was
billion. The deficit
nAsia dwindled
ï. Trade with the
~ surplus of ECU 4.2
billion over 1991. Trade
.jred a deficit of almost a
better than in 1991.
to the Community (9.1% per barrel in ecu terms). T h e
falloff in imports from the ACP (6.2%) and Mediterra
nean (54%) countries was more marked than that in
the level of imports from the newlyindustrialising coun
ties in Asia (2.7%).
<pprts to the developing countries were well up in 1992
i\T7.1 %). Exports t d t h f ACP and OPEC countries and
o the newlyindustrialising countries in Asia increased
7%, 6.9% and 7.5% respectively. Community ex
ports ~tb the Mediterranean countries showed a slight
falloff (1 %) from their 1991 level.
aCommunity trade with the developing countries .showed
a surplus of ECU 2.5 billion
billion mqre than in Decern
in December 1992 0.2
91. The trade sur
pluses with the OPEC andNledíterranean countries
(ECU Q.6 billion and 1.3 billion respectively) were each
0.2 billion up on December 1991. Trade with the new
lyindustriallsing countries in Asia and the ACP countries
remained in virtual balance, as in December 1991.
Imports from the developing countries in December
1992 were 8.4% up on their December 1991. level,
following in the wake of imports from the newlyindus
trialising countries in Asia (+13,3%), Imports from the
OPEC countries remained stable, while those from the
Mediterranean countries feirby 1.2% and those from the
ACP countries showed a 1.7% increase.
Exports to the developing countries were 5.2% up in
December 199,2,. a trend .reflßcted in a[l zones: the
coun
In 1992 the Community trade deficit with the countries
of central a n d eastern Europe was ECU 1.4 billion
half its 1991 level. Imports from the countries of central
and eastern Europe rose by 5.7%, while Community
exports to these countries grew at the faster rate of
1074%.
The Community balance of trade with the countries of
central and eastern Europe ¡n December 1992 was ECU
0.6 billion the same as it had been a year earlier.
Imports from these countries were 25% up on their
December 1991 level and exports to them 20% up.
10
s
0
■5 +
•to
•15··
■20
-25
<J0
J5
-(0
GR.III
EXTRA T R A D E B A L A N C E (MAIN P A R T N E R S )
(BN ECU)
DC
EFTA
91
JAPAN
92
•2
EFTA
91
JAPAN
92
E X T R A - E C whose
INDUSTRIALIZED THIRD
COUNTRIES
- United States
-Japan
-EFTA
DEVELOPING COUNTRIES
-Asian NICe (2)
-OPEC
- Mediterranean Basin
-ACP
COUNTRIES IN MIDDLE
AND EASTERN EUROPE
EXTRA-EC whose
INDUSTRIALIZED THIRD
COUNTRIES
- United States
-Japan
-EFTA
DEVELOPING COUNTRIES
-Asian NICe (2)
-OPEC
- Mediterranean Basin
-ACP
COUNTRIES IN MIDDLE
AND EASTERN EUROPE
INTRA-EC
EXTRA-EC whose
INDUSTRIALIZED THIRD
COUNTRIES
- United States
-Japan
-EFTA
DEVELOPING COUNTRIES
-Asian NICe (2)
-OPEC
- Mediterranean Basin
-ACP
COUNTRIES IN MIDDLE
AND EASTERN EUROPE
1991
STRUC-TURE
%
-100,0
59,7
18,4
10,0
23,5
31,1
5,7
9,7
9,1
4,3
6,5
-100,0
59,8
18,2
5,4
26,5
32,0
5,5
8,4
10,9
4,0
6,5
1989
-33,7
-22,2
-5,6
-25,2
5 4
-5,9
-3,7
-5,8
3,5
-3,0
-5,1
152
13,4
22,4
11,3
13,2
17,6
8,3
28,2
23,1
11,7
16,4
155
13,8
12,0
8,7
24,1
12,0
155
16,4
12,3
14,9
6,9
24,3
1990
^ 2 , 9
- 2 5 5
-8,6
-23,5
2,8
-9,5
-3,1
-3,5
3,3
-3,5
-«,9
1991
1992
1992
III
1992
IV
TRADE BALANCE (Bk) ECU)
-70,5
-51,1
-20,7
-29,7
-1,9
-7,6
-4,8
-7,5
2,4
-3,2
-5,7
-52,1
-48,0
-12,9
-31,0
-3,9
7,1
-«,1
-0,7
4,2
-0,9
-1,4
-9,2
-7,5
-0,2
-7,0
-0,5
13
-0,5
-0,4
0,4
0,3
- 0 3
IMPORTS
-6,7
-8,7
-1,0
-7,6
-0,8
4,0
-0,5
0,5
2,1
0,3
0,0
1991
12
0,1
-3,0
-1,1
-2,1
-0,1
2,7
0,0
0,4
1,1
-0,1
0,6
% change on the corresponding period of the previous year
3,6
2,0
1,8
-0,2
5 9
5 0
-1,3
10,1
13,8
2,7
10,1
6,3
6,8
6,2
7,9
12,1
2,0
4,4
159
4,2
2,8
-4,9
151
5 9
-1,3
-1,9
- 5 6
-0,6
0,8
-3,1
-2,7
-8,8
- 5 4
-6,2
5 7
1,9
-6,6
- 7 3
-17,5
-6,7
0,1
-6,7
-10,3
-14,0
-6,4
-12,4
8,9
1,1
EXPORTS
-3,8
-3,1
-7,3
-3,9
1.1
-1.3
1,4
-10,2
-5,7
-10,0
13,5
-1,1
6,5
10,2
18,7
153
03
0,1
20,7
-12,3
-8,8
-15,2
12,8
8,3
% change on the corresponding period of the previous year
1,6
0,9
-1,9
7,5
3,2
2,5
1,5
1,2
12,1
0,1
12,6
0,9
-3,4
-7,0
-2,5
-2,2
6,1
10,3
10,9
0,5
-4,3
17,2
2,9
-1,0
3,8
-7,4
-1,1
7,1
7,5
6,9
-1,0
7,0
10,4
0,3
-3,1
-1,9
-8,7
-0,9
3,1
4,1
-3,6
-5,0
10,9
12,1
1,5
-0,8
4,4
-8,5
-3,5
1,8
10,1
13
-1,8
7,1
10,7
8,5
2,2
5 4
4,1
2,2
23,9
213
38,7
5 6
3,5
56,2
1992
12
0,4
- 2 3
- 0 , 2
-2,2
-0,6
2,5
-3,1
0,6
1,3
0,0
0,6
5 6
0,5
-2,1
2,1
43
8,4
13,3
0,0
-1,2
1,7
25,6
3,6
6,4
4,1
12,5
- 4 , 5
-0,3
5 2
8,4
3,6
5 4
6,5
19,5
(1) External Trade Statistics (Imports CIF, Exports FOB).
EXTRACOMMUNITY TRADE IN VOLUME TERMS BY PARTNER COUNTRY:
Results for the fourth quarter of 1992.
ExtraCommunity imports in volume terms wereyirtually
the same in 1992 as m 1991 : volumes imported from thé
industrialised countries were 3% dowri. wpile those from
the developing countries showed a slight increase
12%).
The volumes imported from the UnitecrStates and Japan
were each almost 7% below their 1991 levels. Imports
~ the EFTA countries were nearly 2% up irt volume
~ the newlyindustrialising coun
from the EFTA countries were nearly 2% ur.
terms, while those from the newlyirfdustriai...
tries in Asia were 3% down. Imports by volume from the
OPEC, Mediterranean and ACP
close to their 1991 levels.
countries remained
Ì showed a slight
,_me were almost
?% Lip,
4
sustained by a 6% growth in exports to the
Developing countries Dut restrained by a drop in exports
to the industrialised countries.
-1%.
Exports in volgme terms to the newlyIndustrialising
countries in Asia showed a substantial increase of 7%
in 1992; exports to the OPEC and ACP countries were
up by nearly 4%. Volumes exported, to the Mediterra
nearf countries remained dose to their 1991 level·
egistere
th^9
_
indgstríalisèd.cò"gn.t?el (8%) faf'more than
nean countries remained clo
ExtraCommunity imports r«
volume terms in the last quai
registered a drop of 3% ir
' 992, which affected
developin
Imports, b'
volume from the USA and Japan were sub
countries (1%).
level in the last quarter of 1991
lewlyindustna
juntrjes in Asia and the Mediterranean countries
r only Slightly down, unlike those from the OPEC
r0
)
and ACP countries (14%).
Exports by volume in the last quarter of 1992 were only
slightly below those recorded in the last quarter of 1991 :
those to the industrialised countries fell by 3% while
those to the deyeloping countries remained stable, vo
lumes exported to the "USA were 3% up. while those to
Jaoan fell bv 9% and those to the EFTA countries by
newlvindustrialisinq countries in
3%. Exports to the ..
Asia showed an appreciable increase (6%) in volume
terms. Exports to the OPEC and Mediterranean coun
tries remained close to the volumes registered in the last
quarter of 1991. Exports to the ACP countries declined
by 6% in volume terms between the last quarters of 1991
ahd1992.
^
GR.IV EXTRACOMMUNITY TRADE IN VOLUME BY MEMBER STATES
(% change on the corresponding period of the previous year)
E X T R A E E C
ΤΖΖΓ
τ=τ
I m p o r t s
E x p o r t s
INDUSTRIALIZED COUNTRIES
DEVELOPING COUNTRIES
EXTRA-EC whose
INDUSTRIALIZED THIRD
COUNTRIES
- United States
-Japan
-EFTA
DEVELOPING COUNTRIES
-Asian NICe (2)
-OPEC
- Mediterranean Basin
-ACP
MTRA-EC
1991
STRUC-TURE
%
100,0
59,4
173
10,5
23,4
31,9
6,0
-10,0
4,8
-1990
57
4,1
8,7
7,3
4.8
8,6
-56
50
9,6
56
1991
1992
1991
IV
1992
I
1992
II
IMPORTS
1992
III
%
change on the corresponding period of the previous year
6,9 0,6 ' 7,6 2,7 -1,7
4,6 -5,9
*
4,9 0,8
-6,2
5 1
-6,5
* 5 8 2,5 -11,5
6,2 -7,0 ' 2,0
-1,4
-6,3
2,4 2,4
' 0,9
4,3
1 3
7,1 1,6 * 9,4 3 5 0,1
10,5 -3,3 ' - -3,8
-6,1
4,1
1,6 * 2,9
4,2
1,6
11,2 -0,3 ' 257
6,4
1,9
-4,8
0,0 * -5,2 -3,0
-4,5
4,1 1,6 ' 2,9
4,2
1,6
EXPORTS
-1,6
-7,1
-10,1
-10,8
2,1
0,7
-2,2
1,0
-4,7
-93
1,0
1992
IV
-2.5 *
-7,5 *
-10,7 *
-10,8 '
-0,8 *
-0,7 *
-03 '
-0,9 *
-5,4 *
-13,5 *
-0,9 *
EXTRA-EC whose
INDUSTRIALIZED THIRD
COUNTRIES
- United States
-Japan
-EFTA
DEVELOPING COUNTRIES
-AsianNICs(2)
-OPEC
-Mediterranean Basin
-ACP
100,0
62,0
18,8
5,7
27,8
31,0
5,6
8,2
10,5
4,5
-0,3
-0,6
-1,6
9,8
2,0
3,2
-3,4
14,5
-0,1
% change on the corresponding period of the previous year
-0,1
-6,7
-12,7
-7,3
-4,0
4,6
7.6
10,0
-2,6
-13,2
1,5 '
-2,1 '
2,0 '
-9,5 *
-2,0 '
55 *
6,5 *
4,2 '
-0,4 *
4,4 *
7,9
-1,5
-3,7
-7,3
-2,6
152
-28,7
0,3
1,8
2,5
-2,0
4,0
-9,8
-0,8
93
10,8
17,0
4,5
-5,1
0,2
-5,2
-0,5
-11,7
-3,0
6,3
4,4
3,4
-3,4
-8,1
0,2
-3,6
03
-6,8
-1,4
23
53
-2,5
-3,7
0,3
-1,0 '
-3,4 '
3,4 *
-8,9 *
-3,1 *
-0,1 *
6,1 *
-0,6 '
-1,0 *
-6,1 '
(1) Data Source: TREND. Products of SITC 9 are excluded.
Volume indices of aggregated partner groups may fluctuate because of the instability of the partner breakdown of trade.
(2) Asian NICs include the following countries: Singapore, South Korea, Taiwan and Hong Kong.
' Estimate.
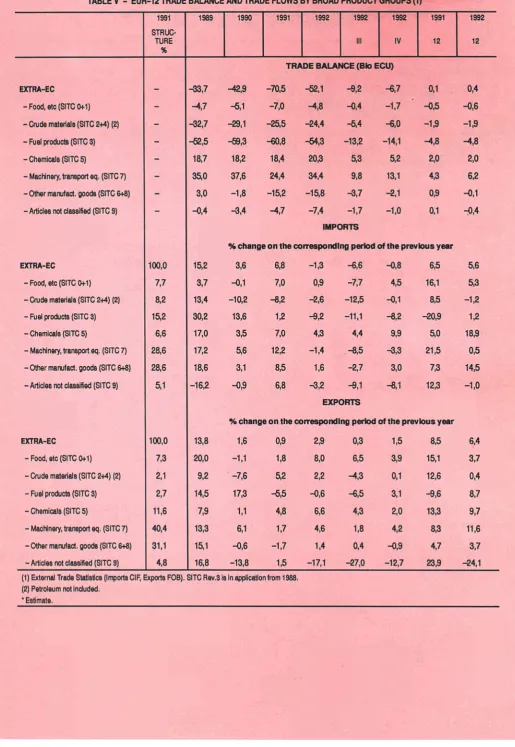
EXTRACOMMUNITY TRADE BY PRODUCT: Results for December 1992.
A surplus of ECU 6.2 billion on machinery and transport equipment (SITC 7)
nearly ECU 2 billion more than in December 1991.
The Community s external trade deficit shrapk by more
than ECU., 18 pillion in 1992, owing to the increase of
ECU TO billion in tae surplus on
machinery and trans
:CU 34.4 billion) and a reduction pf
ι the
fuel bill
(SITC 3), Trade in
vLregistered.a surplus of ECU 20.3
jilhon in 1992 2 billion inore than in 1991. The "ojher
manufactured goods" (SITC 6+8) balance was ECU
15.8 billion, having deteriorated by
0£
'pillion since
1991. Despite an irrTproyement of some ECU 2billion in
the "food etc." balance (STC 0+1), a deficit of ECU 4.8
billionremained. The crude materials (SITC 2+4) deficit
was ECU 24.4 billion in 1992 an improvement of a
billion ecus over 1991.
Trade in machinery and transport equipment registered
a surplus of ECU 6.2 billion in December 1992, compa
red to 4.3 bill on In December 1991. The "other manu
factured goods balance was a billion ecus less than in
December 1991 and more or less in balance. Trade in
other product groups remained close to its December
1991 figures.
a
K
Fuel product
imports fell sharply in 1992 (9.2%), re
flecting the drop In the cost of crude oil supplies to the
Comrnumty. Crude materials imports were 2.6% below
their 1991 level. Imports of machinery and transport
equipment fell slightly (1.4%). while those of other
manufactured gooas increasea by 1.6%. Chemical im
ports were 4.3% up on their 1991 level. Imports of food
etc. were 1.3% down.
ExtraCommunity imports pf other manufactured goods
and chemicals in December 1992 showed sharp in
creases over their December 1991 levels (14.5% and
18.9% respectively). Imports of fuel products and crude
materials were similar to those, in December 1991:1.2%
up and 1.2% down respectively.
ExtraCommunity exports were boosted In 1992 by ex
ports of chemicals (+6.6%) and
machinery and trans
port equipment
(.+4.6%).
Exportç,. of other
manufactured goods increased to an insignificant extent
(+1.4%). Exports of food etc. were up by 8%.
Exports of chemical products and machinery and trans
port equipment rose sharply in December 1992 (by 9.7%
and 11.6% respectively). Exports of other manufactured
goods and food etc. were 3.7% above their December
T991 levels.
GR.V EXTRA TRADE BALANCE (PRODUCT GROUPS)
(BN ECU)
40
60
80
10 χ
Manufactures
Prim.goods
Manufactures
Prim.goods
Fuels
EXTRA-EC
- Food, etc (SITC 0+1)
- Crude materials (SITC 2+4) (2)
-Fuel products (SITC 3)
-Chemicals (SITC 5)
- Machinery, transport eq. (SITC 7)
-Other manufact. goods (SITC 6+3)
- Articles not classified (SITC 9)
EXTRA-EC
- Food, etc (SITC 0+1)
- Crude materials (SITC 2+4) (2)
- Fuel products (SITC 3)
-Chemicals (SITC 5)
- Machinery, transport eq. (SITC 7)
- Other manufact. goods (SITC 6+8)
- Articles not classified (SITC 9)
EXTRA-EC
- Food, etc (SITC 0+1)
- Crude materials (SITC 2+4) (2)
- Fuel products (SITC 3)
-Chemicals (SITC 5)
- Machinery, transport eq. (SITC 7)
- Other manufact. goods (SITC 6+8)
- Articles not classified (SITC 9)
1991
STRUC-TURE
%
-100,0
7,7
8,2
152
6,6
28,6
28,6
5 1
100,0
7,3
2,1
2,7
11,6
40,4
31,1
4,8
(1) External Trade Statistics (Imports CIF, Exports FOB).
(2) Petroleum not included.
' Estimate.
1989
-33,7
-4,7
-32,7
-52,5
18,7
350
3,0
-0,4
152
3,7
13,4
30,2
17,0
17,2
18,6
-16,2
13,8
20,0
9,2
14,5
7,9
13,3
151
16,8
1990
1991
1992
1992
III
1992
IV
1991
12
TRADE BALANCE (Bio ECU)
-42,9 -70,5 -52,1
-9,2 -6,7 0,1
-5,1 -7,0 -4,8 -0,4 -1,7 -0,5
-29,1 -255 -24,4
- 5 4 -6,0 -1,9
-59,3 -60,8 -54,3 -13,2 -14,1
-4,8
18,2 18,4 20,3
53 5 2 2,0
37,6
24,4 34,4 9,8
13,1
43
-1,8
-152 -158
-3,7 -2,1 03
-3,4 -4,7 -7,4 -1,7 -1,0
0,1
IMPORTS
% change on the corresponding period of the previous year
3,6 6,8
-1,3 -€,6 -0,8
6,5
-0,1
7,0
0,9 -7,7 4,5
16,1
-10,2
-0,2 -2,6
-12,5
-0,1
8,5
13,6
1,2 -9,2
-11,1
-0,2
-20,9
3,5 7,0
43 4,4 9,9
5 0
5 6
12,2
-1,4 -8,5 -3,3
21,5
3,1 8,5 1,6
-2,7 3,0
7,3
-0,9 6,8 -3,2 -9,1 -0,1
12,3
EXPORTS
% change on the corresponding period of the previous year
1,6 0 3 2 3 0,3 1,5 8,5
-1,1 1,8 8,0 6,5 3,9 15,1
-7,6 5 2 2,2 -4,3 0,1 12,6
17,3 -5,5 -0,6 -6,5 3,1 -0,6
1,1 4,8 6,6 4,3 2,0 13,3
6,1 1,7 4,6 1,8 4,2 8,3
-0,6 -1,7 1,4 0,4 -0,9 4,7
-13,8 1,5 -17,1 -27,0 -12,7 23,9
SITC Rev.3 is in application from 1988.
1992
12
0,4
-0,6
- 1 3
-4,8
2,0
6,2
-0,1
^0>4
5,6
5,3
-1,2
1,2
183
0,5
14,5
-1,0
6,4
3,7
0,4
8,7
9,7
11,6
3,7
[image:19.595.46.562.30.778.2]EXTRACOMMUNITY TRADE IN VOLUME TERMS BY PRODUCT:
Results for the fourth quarter of 1992
Imports of fuel products in volume terms in 1992 were
similar to those in 1991. Volume imports of crude ma
terials showed a slight increase (1°/°)· Imports of machi
jquipment tell by 5% by volume,
Volumes exported were up in 1992 for all product groups
except machinery and transport equipment, which re
mained stable. Exports ofchëmiçals by volume were up
nerv and transport.equipment tell by 5% by volume,
by 4% and those of other manufactured goods by 2%.
while those of chemicals ang other manufactured goods
Food exports showed a sharp increase in volume (+7%).
increased by almost 4%. The volume of food imports
remained more or less the same (+1%).
In the last quarter of 1992 the volumes of Imports were
down compared with the same period of the previous
year. Manufactured goods showed contrasting trends:
imports of machinery and transport equipment fell by
10%, while those of chemicals ahd other manufactured
goods rose by 4%.
Exports of manufactured goods in volume terms were
lower in the fourth quarterof 1992 than they had been
in the fourth quarter of 1991, Chemical exports we.re
10% down and those of machinery and transport equip
ment 3% down, Exports of other manufactured goods
remained roughly the same in volume terms (1%).
Exports of food etc. were 6% higher than in the last
quarterof 1991.
GR.VI EXTRACOMMUNITY TRADE IN VOLUME ( PRODUCT GROUPS)
( % change on the corresponding period of the previous year)
Food.etc...
SITC 0+1
921
9211
921V» Γ
20
15
10
S
0
5
10 •15
Chemicals
SITC
5
911V 921 9211 92 III 921V
Machinery, transport eq.
SITC 7
Other manufactured goods
SITC 6+8
911V 921 9211 92 III
β
Exports
911V 921 9211 92 III 921V