1019
J. Dairy Sci. 100:1019–1036
https://doi.org/10.3168/jds.2016-11494
© 2017, THE AUTHORS. Published by FASS and Elsevier Inc. on behalf of the American Dairy Science Association®.
This is an open access article under the CC BY-NC-ND license (http://creativecommons.org/licenses/by-nc-nd/3.0/).
ABSTRACT
The objective of this study was to test whether diet selection of dairy cows under grazing conditions could be estimated using plant wax markers. Furthermore, differences between 2 cow strains and the effect of concentrate supplementation on plant species selection were investigated. The experiment was a study with a crossover design performed on an organic farm with 12 Swiss Holstein cows and 12 New Zealand Holstein cows. Both experimental periods consisted of a 21-d adapta-tion and a 7-d measurement period. All cows grazed full time in a rotational stocking system and received either no concentrate or 6 kg/d of a commercial cereal-grain mix. Representative herbage samples of each grazed paddock were taken and botanical composition of sub-samples was manually determined. The average propor-tions of the plant species were 27.8% Lolium perenne, 6.1% Dactylis glomerata, 10.4% Trifolium repens, and 9.0% Taraxacum officinale. Other grass species were merged as “other grass” (38.2%) and other forb spe-cies as “other forbs” (8.5%). n-Alkanes, long-chain fatty acids, and long-chain alcohols (LCOH) were analyzed in the samples of plant species, concentrate, and feces from each cow. A linear discriminant analysis indicated that diet components were differentiated best with LCOH (96%) and worst with the combination of all marker groups together (12%). For each marker, the fecal marker recovery (FR) relative to dosed ytterbium was determined in 2 ways. Estimation of diet composi-tion was performed with the software “EatWhat,” and results were compared with botanical composition with the Aitchison distance. The results indicate that the diet composition of grazing dairy cows can be estimated using plant wax markers. Additionally, the calculation of FR led to mostly reliable results, yet this approach needs further validation. The most accurate estimation
was achieved with the marker combination of n-alkanes and LCOH with a correction for FR. Less accurate estimations were achieved with long-chain fatty acids alone or in combination with n-alkanes. No difference relating to diet selection between the 2 cow strains was recorded, but supplemented cows apparently ingested higher proportions of T. repens than nonsupplemented cows. Awareness that supplementation influences selec-tion behavior of grazing dairy cows may lead to adapta-tions in botanical composition of the pasture according to the demand of the animals.
Key words: alkane, long-chain fatty acid, long-chain alcohol, concentrate supplementation
INTRODUCTION
The benefits of grassland communities with a higher diversity of species and functional groups, such as higher productivity, increased resources utilization, higher up-take of nitrogen, and increased occupation of available space, are well known (Spehn et al., 2005). Recently, the considerable features of multi-species, legume-based grassland-livestock systems at different stages in the soil-plant-animal-atmosphere system were summarized by Lüscher et al. (2014). They stated that legume-based grassland-livestock systems would constitute one of the pillars for more sustainable and competitive ruminant production systems and will become more important in the future.
Concentrate supplementation of dairy cows in a pasture-based feeding system causes substitution of herbage and grazing time is reduced [McCarthy et al., 2007; C. Heublein, F. Dohme-Meier, K.-H. Südekum, R. M. Bruckmaier (Vetsuisse Faculty, Bern, Switzer-land), S. Thanner (Agroscope, Posieux, SwitzerSwitzer-land), and F. Schori, unpublished data], but no certainties exist about whether it influences plant species selection in multispecies pastures. According to Villalba et al. (2015), the knowledge of the effects of feed context on preference of grazing animals should pioneer innovative management strategies to enhance forage intake,
pro-Using plant wax markers to estimate the diet
composition of grazing Holstein dairy cows
C. Heublein,*† K.-H. Südekum,† F. L. Gill,‡ F. Dohme-Meier,* and F. Schori*1 *Agroscope, Institute for Livestock Sciences, Tioleyre 4, 1725 Posieux, Switzerland
†University of Bonn, Institute of Animal Science, Endenicher Allee 15, 53115 Bonn, Germany ‡University of Leeds, School of Earth and Environment, LS2 9JT, Leeds, United Kingdom
Received May 20, 2016. Accepted October 17, 2016.
ductivity, and animal welfare. Previous studies exam-ined the suitability of different cow strains or breeds for a pasture-based feeding system [McCarthy et al., 2007; Piccand et al., 2013; C. Heublein, F. Dohme-Meier, K.-H. Südekum, R. M. Bruckmaier (Vetsuisse Faculty, Bern, Switzerland), S. Thanner (Agroscope, Posieux, Switzerland), and F. Schori, unpublished data], but to the authors’ knowledge, no studies considered differ-ences in diet selection on pasture. In New Zealand, Hol-stein cows are bred for an efficient use of pasture and have a higher feeding drive (McCarthy et al., 2007). Therefore, differences might exist in plant species se-lection between New Zealand and other Holstein cow strains. Such investigations are needed in natural graz-ing situation with a greater number of plant species, as requested by Villalba et al. (2015).
Plant wax markers, such as n-alkanes (hereafter called alkanes), long-chain fatty acids (LCFA), and long-chain alcohols (LCOH), are used for diet com-position estimation of grazing ruminants (Ali et al., 2005; Lin et al., 2012). With the combination of alkanes and LCFA (Ferreira et al., 2009, 2011) or with alkanes and LCOH (Boland et al., 2012; Ferreira et al., 2015), diet composition estimations provided reasonable re-sults for diets with between 2 and 6 components. The combination of all 3 marker groups might be applicable to situations with more complex diets (Ferreira et al., 2015). Supplementary feeds, such as concentrates, can be labeled and considered as an additional component in the diet (Dove and Charmley, 2008; Elwert et al., 2008). However, several studies included shrubs (Ali et al., 2005) or heather-gorse plant species (Ferreira et al., 2015) in the diets, which are not typical plant species occurring on pastures for dairy cows. Various grasses, legumes, and forbs are the main plants growing on pastures grazed by dairy cows, and studies to esti-mate plant species selection on multispecies pastures with dairy cows are rare. In one of the few studies on this kind of multispecies pasture, using alkanes alone led to erroneous diet composition estimations of dairy cows (Schori et al., 2012). Therefore, we tested whether the approach of estimating diet composition of graz-ing dairy cows usgraz-ing plant wax markers is applicable under farming conditions and if reasonable results are obtained with different breeds and concentrate supple-mentation.
The basic precondition for estimating diet selection of ruminants on a multispecies pasture is the sufficient differentiation of marker profiles between plant spe-cies. Identification of markers that contribute most to the differentiation between plant species may reduce workload and contribute to a more accurate differentia-tion as low concentradifferentia-tion of markers and large within-species variation may limit their use for diet estimation
(Mayes and Dove, 2000). As the recovery of the mark-ers in the feces is incomplete, an important element for gaining accuracy of diet composition estimation is the fecal recovery (FR) correction (Ferreira et al., 2015). Corrections are needed for incomplete FR of alkanes (Dove and Mayes, 1991), LCFA (Ferreira et al., 2009), and LCOH (Ferreira et al., 2015), but in the aforemen-tioned studies, FR was determined in indoor feeding experiments with similar diet composition to outdoors, with known amount of DMI, diet composition, and col-lection of total fecal output. This approach is labor intensive and expensive, so 2 alternative ways for cal-culating FR were used in the current study. The aim of the study was to test whether the approach using calculated FR to estimate diet selection of dairy cows is applicable under grazing conditions and to investigate which marker group or marker group combination, with or without FR correction, delivers the most accurate estimation. Furthermore, differences between 2 cow strains and the effect of concentrate supplementation on plant species selection were investigated.
MATERIALS AND METHODS
Experimental Design and Animals
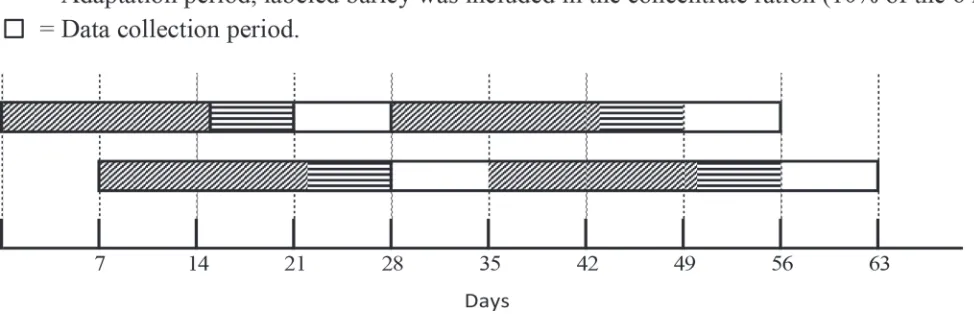
All experimental procedures were in accordance with the Swiss guidelines for animal welfare and were ap-proved (no. 2012_51_FR) by the Animal Care Com-mittee of the Canton of Fribourg, Switzerland. Before selecting the cows for the experiment, a medical check-up including vital parameters as well as udder and claw health was performed. The experiment was a 2 × 2 factorial design, which was conducted as a crossover de-sign with 2 concentrate levels and 2 cow strains. It was divided into 2 measurement periods, each consisting of a 21-d adaption period and a 7-d data collection period (Figure 1). For the flow of work and equipment rea-sons, the cows were equally divided into 2 consecutive data collection periods of 7 d per measurement period, resulting in 4 data collection periods. The experiment took place on the organic farm “Ferme École de Sorens” located 824 m above sea level in Sorens, Switzerland.
(SD 0.31), and were producing 34.9 (SD 6.08) kg of milk/d. The HNZ cows had an average number of lacta-tions of 2.1 (SD 1.0), had been 102 (SD 22.0) DIM, had an average BW of 513 (SD 75.5) kg, a BCS of 2.8 (SD 0.25), and were producing 29.1 (SD 4.44) kg of milk/d.
During the first measurement period, one of the supplemented HCH cows was excluded from the experi-ment because of health problems.
Grazing Management, Pasture, and Weather Conditions
The experiment was carried out in a rotational grazing system from May 6 to July 14 in 2013. All 24 experimental dairy cows were managed as a single herd and grazed on pasture from 0800 to 1400 h and from 1800 to 0430 h the following morning. In the meantime, cows were housed in a freestall barn. For certain work steps, cows were briefly tethered in the cubicles. Indoors, cows had no access to roughages, but concentrate was distributed to supplemented cows. Cows were milked twice a day at 0500 h in the morn-ing and 1600 h in the afternoon. Paddocks used were rotationally grazed for 1 to 5 d based on decision rules considering sward height with a reference of 130 mm pre-grazing equivalent to an herbage mass of ap-proximately 1,000 kg of DM/ha above 50 mm until a postgrazing sward height of 50 mm from ground level. The sward surface height was measured with a pasture meter (C-Dax pasture meter, C-Dax Ltd., Turitea, New Zealand) before cows entered a new paddock and after leaving the paddock. The average pre-grazing sward height was 72 (SD 6.6; n = 10) mm, corresponding to 295 (SD 84.5) kg of DM/ha above 50 mm in the first measurement period, and 124 (SD 20.3; n = 5) mm,
corresponding to 958 (SD 260.3) kg of DM/ha for the second measurement period. The average postgrazing sward surface height was 56 (SD 3.1; n = 10) mm in the first measurement period and 64 (SD 10.1; n = 5) mm in the second measurement period. Herbage mass above 50 mm (kg of DM/ha) was calculated according to −625 + 12.8 × sward height (mm). This regres-sion was calibrated on the same paddocks during the vegetation period 1 yr before the current study (R2 = 0.84, n = 89). The pastures were long established and composed predominantly of grasses (mainly Lolium perenne, Dactylis glomerata, and Phleum pratense) but also of clover (mainly Trifolium repens) and forbs (mainly Taraxacum officinale). The pastures were fer-tilized once per year with 25 m3/ha of farm-produced manure (corresponding to approximately 80 kg of N, 22 kg of P, and 108 kg of K per ha). The ambient outdoor temperature and rainfall were recorded daily by the meteorological station in Grangeneuve (Meteo-Schweiz, Station Grangeneuve, Switzerland), located about 15 km north of the experimental pastures. During the first measurement period, the average temperature was 12°C (minimum 6°C, maximum 17°C) and in the second measurement period 19°C (minimum 16°C, maximum 20°C). On 7 out of the 14 d, scattered rain showers occurred with an average daily precipitation of 7 (SD 10.1) mm in the first measurement period, whereas on 2 out of the 14 d in the second measurement period the average daily precipitation was 1 mm.
Concentrate Supplementation
[image:3.612.60.547.104.261.2]Figure 1 shows the description of the experiment set-up. A step-wise adaptation to the targeted amount of concentrate, 0 or 6 kg (as-fed basis), took place during
the first 14 d of the adaptation periods of 21 d before data collection periods. Six days before the data col-lection periods and during the whole data colcol-lection periods, the organic, commercial concentrate mix (UFA 275 Bio, UFA AG, Herzogenbuchsee, Switzerland; com-position in descending order according to the delivery note: corn, wheat bran, wheat, barley, sorghum mill feed, barley mill feed, rye, sugar-beet molasses, oats, vegetable oil, minerals, and sunflower seed press cake), was mixed with 10% of labeled barley (50 g/kg of oc-tacosane HC28, C28H58, Acros Organics BVBA, Geel, Belgium). The concentrate was fed after milking in 2 equal meals (3 kg at 0600 h and 3 kg at 1700 h) at the feed fence in the freestall barn using separate buckets for each cow. During the data collection periods, all 6 kg/d of concentrate was ingested by all cows with no refusals. The nonsupplemented cows received no con-centrate in addition to pasture. Fresh water was always available and a mineral block was available in the barn.
Data Recording and Sample Collection
Individual feed intake was estimated with the n-alkane double indicator technique (Mayes et al., 1986). Gelatin capsules (HGK 17–60 sl; Capsula GmbH, Ratingen, Germany), containing 0.5 g (weighing accuracy 0.01) dotriacontane (HC32, C32H66, Argenta Ltd., Auckland, New Zealand) on a carrier of dried fruit pomace and 1.0 g of ytterbium(III) oxide (purity: 99.99%, REacton, Alfa Aesar GmbH & Co KG, Karlsruhe, Germany), were administered twice per day starting 6 d before the data collecting periods. The ytterbium(III) oxide was added to calculate relative FR of alkanes, LCFA, and LCOH. During the data collection periods, a daily spot sample of feces was taken from each cow with or without stimulus between 0700 and 0800 h. Samples were pooled by cow and data collection period and stored at −20°C. For estimating feed intake, herbage samples were collected starting 1 d before the feces sampling. Herbage sample collection was carried out every morning and evening as described by Graf et al. (2005). Samples were chopped and stored at −20°C un-til further analysis. Samples of commercial concentrate mix and labeled barley were taken daily, pooled per data collection period and analyzed separately.
Milk yield (Flo Master Pro, DeLaval AG, Sursee, Switzerland) was recorded daily and milk composition was analyzed from a pooled sample of aliquot propor-tion of morning and evening milk on d 1, 4, and 7 of each data collection period. Milk samples were preserved in tubes containing Broad-Spectrum Microtabs II (Gerber Instruments AG, Effretikon, Switzerland) at 8°C. Graz-ing and rumination behavior was recorded automati-cally using jaw movement recorders (Datenlogger MSR
145, MSR Electronics GmbH, Hengart, Switzerland), and for recording physical activity IceTag pedometers (IceRobotics Ltd., Edinburgh, UK) were used. Further details are described by Thanner et al. (2014).
During the data collection periods, 2 per measure-ment period, 2 strips of herbage per paddock were cut before the cows entered the new paddock for estimation of the botanical composition and to collect plant spe-cies or groups for the marker analysis. In the first data collection period, cows grazed on 10 different paddocks and in the second period cows grazed on 5 different paddocks. The strips, 7 to 9 m long and 1 m wide, were cut with a motor mower Rapid BM 117 (Rapid Technic AG, Killwangen, Switzerland). The harvested biomass was collected in plastic bags and subsamples were man-ually separated for botanical analysis. Dominant plant species were Lolium perenne, D. glomerata, T. repens, and Taraxacum officinale. Other grass species were merged as “other grass” representing Phleum pratense,
Poa pratensis, Poa annua, Festuca pratensis, Agrostis
spp., and Holcus lanatus. Further forbs were merged as “other forbs” representing Plantago lanceolata, Ranun-culus acris, and Rumex acetosa. Plant species or group samples of every data collection period, 4 in total, were collected, weighed, and chemically analyzed. The aver-age proportion of the plant species or groups over all subsamples of all data collection periods was 27.8% L. perenne, 6.1% D. glomerata, 38.2% other grass, 10.4%
T. repens, 9.0% T. officinale, and 8.5% other forbs.
Extraction and Analysis of Alkanes, LCFA, and LCOH
peak identification several samples of the diet compo-nents and feces were also analyzed using GC described above, equipped with an identical column, coupled to an ISQ mass spectrometer (Thermo Scientific). The ion source was maintained at 300°C and the transfer line at 300°C. The emission current was set to 50 mA and the electron energy to 70 eV. The analyzer was set to scan at 50 to 650 m/z with a scan cycle time of 0.6 s.
The alkanes with a carbon chain length (CCL) of 24 to 33 were analyzed. The LCFA with the even number CCL of 22 to 34 and the LCOH with the even number CCL of 20 to 30 were analyzed, as they occur in higher concentrations compared with odd chain substances.
Further Laboratory Analysis
Milk samples were analyzed by infrared spectrometry (Combifoss FT+, Foss, Hillerød, Denmark) for contents of fat, protein, and lactose (International Dairy Federa-tion, 2000; method number 141C). Urea in milk was determined with a differential pH-analyzer (Eurochem, Ardea, Italy) before and after hydrolysis with urease (International Dairy Federation, 2004; method number 195). For milk acetone determination, acetone and an internal standard (2-butanone) were transferred via static headspace directly from the milk into the gas phase. The composition of the gas phase was deter-mined with a flame ionization detector on a GC (HP 5890 Series II, Agilent Technologies, Santa Clara, CA).
Herbage, plant species, and feces samples were ly-ophilized (model Delta, 1–24 LSC, Christ, Osterode, Germany). Thereafter, concentrate, herbage, plant spe-cies, and feces samples were milled through a 1.0-mm screen (Brabender mill with titanium blades, Braben-der, Duisburg, Germany). Subsamples of the lyophi-lized samples were dried for 3 h at 105°C to determine DM and subsequently incinerated at 550°C until they reached a stable mass to assess the ash contents. The contents of alkanes HC32 and tritriacontane (HC33, C33H68) were determined as described by Peiretti et al. (2006). The N content was determined using the Dumas method (AOAC International, 1995) on a C/N analyzer (type FP-2000, Leco Instruments, St. Joseph, MI) and then multiplied by 6.25 to determine the CP content. The ether extract was determined using the Soxtec Avanti 2050 apparatus for extraction following the guidelines of VDLUFA (2012, method 5.1.1.). Acid detergent fiber (procedure 973.18; AOAC International, 1995) was determined with correction for residual ash obtained after incineration at 500°C for 1 h. For ana-lyzing Yb, subsamples were dissolved in HNO3 before analyzed with an inductively coupled plasma optical emission spectrometry (ICP-OES Optima 2000 DV, Perkin Elmer, Shelton, CT, with system ICP-OES
Op-tima 7300). Crude fiber was analyzed only in herbage, plant species, and concentrate samples according to the procedure 978.10 (AOAC International, 1995) and NDF (Mertens, 2002) was assessed with the addition of heat-stable amylase and sodium sulfite. Starch con-tent was determined based on the polarimetric method (ISO, 2000; method 6493) in concentrate samples. Wa-ter-soluble carbohydrates (WSC) and ethanol-soluble carbohydrates (ESC) were analyzed according to Hall et al. (1999) and determined with the Thermo Scien-tific Genesys 10S Vis Spectrophotometer (Thermo Sci-entific, Waltham, MA). Lignin was analyzed according to the procedure 973.18 (AOAC International, 1995).
Calculation of Fecal Recovery and Estimation of Diet Composition
The correction for incomplete FR was performed in 2 different ways. To estimate average marker concentra-tion in the herbage (HM) for the subsequent calculation
of individual FR of each marker substance (FRM), the
average botanical composition of the pasture was as-sessed in 2 different ways.
Method 1: With the alkane concentrations of the rep-resentative herbage samples and from the plant species, the average botanical composition for each data col-lection week was calculated using a nonnegative least-squares procedure in R (R Core Team, 2012). Mean FR rates were subsequently calculated with the formula described below for alkanes, LCOH, and LCFA across all data collection weeks (FR1).
Method 2: The manually assessed botanical compo-sition was used to calculate HM (FR2). The relative FR of alkanes (CCL: 24–33), LCFA (CCL: 22, 24, 26, 28, 30, 32, and 34), and LCOH (CCL: 20, 22, 24, 26, 28, and 30) to Yb were calculated with the following equation:
FRM = (DYb + DMIH × HYb) × FRYb × FM/ [(DHC32 + DMIH × HM + DMIConc × ConcM) × FYb],
where D is the dosed amount of Yb (DYb) and HC32 (DHC32; just used for FR calculation of HC32), H is the concentration of Yb (HYb) in herbage, FRYb is the FR of Yb fixed to 0.95, F is the concentration of Yb (FYb) and marker (FM) in feces, and ConcM is the concentra-tion of markers in the concentrate (only included for supplemented cows). Total DMI was separated into herbage DMI (DMIH) and concentrate DMI (DMIConc).
Diet composition of each animal was estimated us-ing a nonnegative least-squares procedure included in the software “EatWhat” (Dove and Moore, 1995). Estimations were performed with alkanes, LCFA, and LCOH alone, and their combination. Furthermore, all diet composition estimations were performed with data not corrected for FR, with FR1, and FR2 resulting in 21 combinations (7 marker and marker combinations and 3 FR). For supplemented cows, concentrate was in-cluded as a diet component. The alkanes administered with the capsules were considered in diet estimations with alkanes or in marker combination with alkanes.
Other Calculations and Statistical Analyses
The NEL and the absorbable protein in the small intestine when rumen fermentable energy is limiting microbial protein synthesis in the rumen were calcu-lated according to Agroscope (2013). The ECM was calculated based on a 4% fat, 3.2% protein, and 4.8% lactose basis (Agroscope, 2013). Feed intake was es-timated with the equation proposed by Mayes et al. (1986) using the alkanes HC32 and HC33. The statisti-cal analyses for milk yield and composition, rumination and grazing behavior, physical activity, and feed intake were carried out with SYSTAT 13 (Systat Software Inc., Chicago, IL). The data were collected over sev-eral days and averaged per cow, day, and measurement period. The averages were analyzed using the following linear mixed model:
Yijklm = μ + τi + φj + pk + (τp)ik + (τφ)ij + Pl + Km(Pl) + εijklm,
where Yijklm is the response (respectively, its logarithm), μ is the least squares means, τi is the fixed effect of cow strain i (i = HCH, HNZ), φj is the fixed effect of the treatment j (j = nonsupplemented, supplemented cows), pk is the fixed effect of the period (k = period 1, period 2), (τp)ik is the effect of the interaction between cow strain i and period k, (τφ)ij is the effect of the interaction between cow strain i and treatment j, Pl is the random effect of cow pair l (1, …, 12), Km is the random effect of the cow m (1, …, 24), and εijklm is the random error. The effects were considered significant at
P ≤ 0.05. A value of 0.05 < P < 0.10 was considered a trend.
Linear discriminant analyses were performed with SYSTAT 13 for evaluating the differentiation of marker profiles of the plant species and the concentrate. Results are summarized in a jackknifed classification matrix where the percentage of correct allocations of marker profiles to the plant species is presented. The
concen-trate percentage of the diet of supplemented cows was subtracted from the results of entire diet estimated with “EatWhat” and compared with the manually assessed botanical composition. Based on the Aitchison distance measure (Aitchison et al., 2000) the similarity between botanical compositions and diet estimations was tested with the R package “compositions” to figure out the marker group and FR with the most accurate diet es-timation. Using the R package PCS (Wilson, 2013), the marker group combinations with the most accurate diet estimation were determined. A parametric linear mixed model was applied to the Aitchison distances of the 2 best marker and FR combinations to test whether they differ significantly from each other (SYSTAT 13). The most accurate marker group combination for diet estimation was selected and the effects of concentrate supplementation and of cow strain were tested with the R package “composition” as described in van den Boogaart et al. (2014). Zeroes in the estimated compo-sitions were first replaced by the nonparametric impu-tation procedure proposed by Martín-Fernández et al. (2003). For each plant variety, a robust linear mixed model (Koller, 2015) was applied to the logarithms of the estimated compositional results of the most accu-rate diet estimation to test the effects of concentaccu-rate supplementation and of cow strain.
RESULTS
Chemical Composition of Herbage and Concentrate
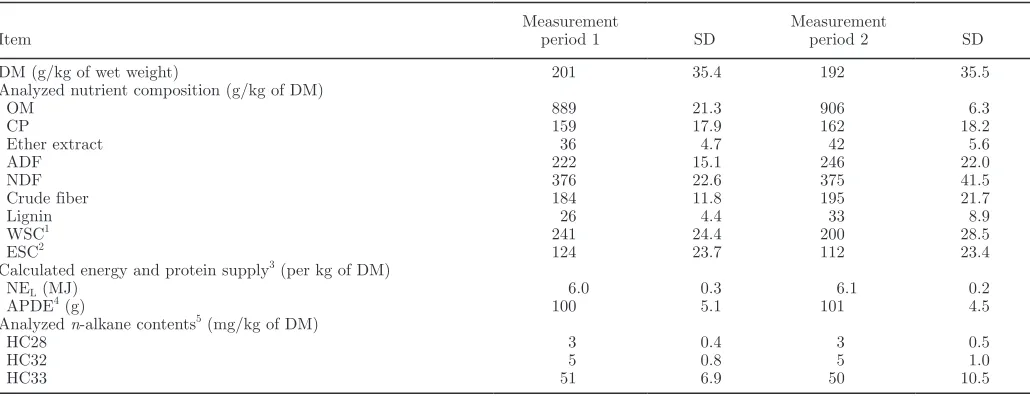
In Table 1, the average chemical composition of the herbage samples from the paddocks for each measure-ment period is presented. All analyzed components are similar in both measurement periods. The average chemical composition of plant species and concentrate is displayed in Table 2. Small differences were recorded between plant species; for example, T. repens had the highest concentration of CP, but the lowest concentra-tion of WSC. Grass species, including L. perenne, D. glomerata, and the group of other grass, had a higher concentration of crude fiber, ADF, and NDF than the other plant species. As the concentrate was a commer-cial mix based on grain, the chemical composition was similar to the labeled barley with high NEL concen-tration (8.0 MJ/kg of DM for both) and medium CP concentration (127 and 138 g/kg of DM, respectively).
Milk Yield, Milk Composition, and DMI
additional milk yield per kilogram of concentrate. Concentrate supplementation had no effect on ECM yield and no difference between cow strains occurred. Nonsupplemented cows had a higher (P < 0.001) milk fat content and a lower (P < 0.01) milk protein content. Swiss Holstein cows had a lower (P < 0.05) milk fat and a lower (P < 0.001) milk protein content compared with HNZ cows. Concentration of acetone and urea in milk were influenced by concentrate supplementation with greater (P < 0.001) concentrations for nonsupple-mented cows. Nonsupplenonsupple-mented cows had a higher (P
< 0.001) herbage DMI compared with supplemented cows, but total DMI was lower (P < 0.001) for non-supplemented cows. No further difference between cow strains and no interactions for aforementioned traits were observed.
Grazing and Rumination Behavior and Physical Activity
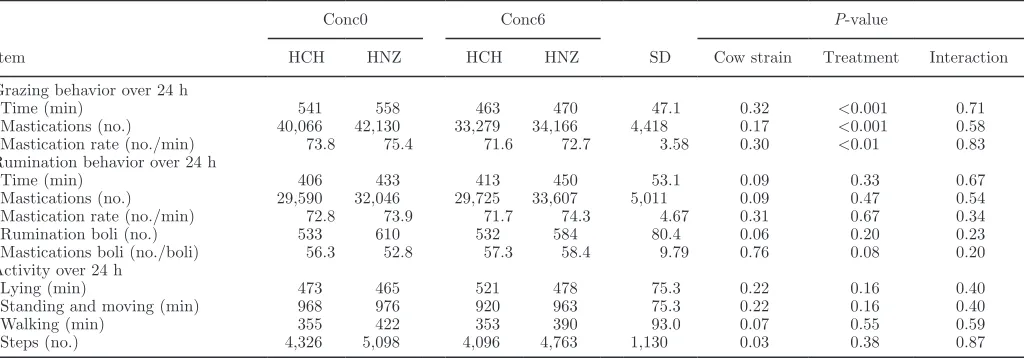
Grazing time, grazing mastication, and grazing mas-tication rate were higher (P < 0.001) for nonsupple-mented cows, but no differences between cow strains were recorded (Table 4). Concentrate supplementation had no influence on rumination behavior, but non-supplemented cows tended to have a lower number of mastications per bolus than supplemented cows (P = 0.08). Swiss Holstein cows spent slightly (P = 0.09) less time ruminating and made less rumination
masti-cations. A trend (P = 0.06) for a lower number of boli per day was recorded for HCH cows compared with HNZ cows. Physical activity was not influenced by con-centrate supplementation. No difference between cow strains was recorded for time spent lying or standing. The HCH cows had a tendency to walk less (P = 0.07) and made fewer (P = 0.03) steps compared with HNZ cows. No interactions were recorded.
Composition of Diet Components, Fecal Recovery, and Diet Selection
[image:7.612.61.576.467.665.2]Concentration of alkanes, LCFA, and LCOH of plant species and concentrate are given in Table 5. The LCOH had the highest average concentration with 446 mg/kg of DM compared with alkanes (21 mg/ kg of DM) and LCFA (277 mg/kg of DM). The odd-chain alkanes were in higher concentration compared with even-chain numbered alkanes. For L. perenne, D. glomerata, other grass, and other forbs the C31 n-alkane had the highest concentration, but for T. repens and T. officinale the C29 n-alkane was most abundant. Alkane concentration in concentrate was generally low (<3 mg/kg of DM) except for the C28 n-alkane from labeled barley added to the concentrate. The C24 n-alkane had the lowest concentration of those measured with <1 mg/kg of DM in all diet components. In general, the highest overall average alkane concentration in plant species was analyzed for L. perenne with 36 mg/kg of
Table 1. Average chemical composition of herbage samples (n = 28; mean ± SD)
Item Measurement period 1 SD Measurement period 2 SD
DM (g/kg of wet weight) 201 35.4 192 35.5
Analyzed nutrient composition (g/kg of DM)
OM 889 21.3 906 6.3
CP 159 17.9 162 18.2
Ether extract 36 4.7 42 5.6
ADF 222 15.1 246 22.0
NDF 376 22.6 375 41.5
Crude fiber 184 11.8 195 21.7
Lignin 26 4.4 33 8.9
WSC1 241 24.4 200 28.5
ESC2 124 23.7 112 23.4
Calculated energy and protein supply3 (per kg of DM)
NEL (MJ) 6.0 0.3 6.1 0.2
APDE4 (g) 100 5.1 101 4.5
Analyzed n-alkane contents5 (mg/kg of DM)
HC28 3 0.4 3 0.5
HC32 5 0.8 5 1.0
HC33 51 6.9 50 10.5
1WSC = water-soluble carbohydrates.
2ESC = ethanol-soluble carbohydrates.
3According to Agroscope (2013).
4APDE = absorbable protein in the small intestine when rumen fermentable energy is limiting microbial protein synthesis in the rumen.
5HC28 = octacosane, C
T
able 2
. Av
erage c
hemical comp
osition of plan
t sp
ecies and groups (n = 4), concen
trate (n = 4), and lab
eled concen
trate (n = 4)
Item LP 1 DG 2 OG 3 TR 4 TO 5 OF 6 Conc 7 lConc 8 Mean SD Mean SD Mean SD Mean SD Mean SD Mean SD Mean SD Mean SD DM 215 17.4 211 10.9 232 25.3 165 26.9 137 20.2 159 21.2 880 1.4 870 0.7 Analyzed n utrien t comp osition
(g/kg of DM) OM
905 10.9 904 15.5 897 16.7 870 29.4 855 29.5 854 48.3 945 0.6 978 0.2 CP 142 18.6 152 15.4 151 16.5 204 13.1 145 19.6 142 20.2 127 2.6 138 2.9 Ether extract 29 2.9 38 5.2 35 1.1 44 4.7 42 7.0 34 3.8 63 3.7 33 1.4 Crude fib er 222 22.2 247 3.5 241 15.3 148 21.5 142 17.2 156 18.6 49 0.9 53 1.8 ADF 248 30.2 270 6.4 266 19.9 207 25.9 209 21.8 229 34.9 73 8.1 78 8.9 NDF 436 46.1 484 5.3 469 30.5 246 19.8 223 19.6 284 38.5 274 31.7 287 47.3 Lignin 24 5.7 28 4.0 31 5.8 53 1.0 53 4.4 65 9.6 24 5.2 16 2.6 WSC 9 213 61.1 180 22.6 175 40.1 95 5.5 182 31.9 161 26.0 ESC 10 99 19.1 84 7.6 77 11.1 93 6.0 123 12.6 124 30.7 Starc h 488 15.3 552 4.4
Calculated energy and protein supply
11
p
er kg of DM
NE L 6.3 0.3 6.2 0.2 5.9 0.1 5.9 0.3 5.9 0.3 5.6 0.4 8.2 0.1 8.0 0.0 APDE 12 101 4.2 101 4.1 98 3.6 105 4.9 94 5.9 94 3.6
1 LP =
Loli um p er en ne .
2 DG =
Dactylis glo
m
er
ata
.
3 OG = other grass sp
ecies.
4 TR =
T rifoli um r ep ens .
5 TO =
T ar axacu m offi ci nale .
6 OF = other forb sp
ecies.
7 Conc = concen
trate.
8 lConc = lab
eled concen
trate.
9 WSC = w
ater soluble carb
oh
ydrates.
10 ESC = ethanol soluble carb
oh
ydrates.
11 According to Agroscop
e (2013).
12 APDE = absorbable protein in the small in
testine when rumen fermen
table energy is limiting microbial protein syn
DM and the lowest for T. officinale with 10 mg/kg of DM. The highest concentrations of LCFA occurred for those with CCL of 22, 24, 26, and 28, and the lowest concentration was recorded for the C34 LCFA in all diet components. The highest average LCFA concentration in plant species occurred for T. repens with 426 mg/kg of DM and the lowest for L. perenne with 163 mg/kg of DM. The C26 LCOH had the highest concentration and the C20 LCOH had the lowest concentration in all diet components, except for T. repens, where the C30 LCOH had the highest and the C20 and C22 LCOH had the lowest concentration. Dactylis glomerata had the highest average LCOH concentrations in plant species with 1,150 mg/kg of DM and T. repens had the lowest with 257 mg/kg of DM.
[image:9.612.62.576.89.241.2]Most accurate discrimination of diet composition was achieved with the LCOH, where 96% of the plant species or groups were correctly allocated (Table 6). A score of 81% correct allocations was obtained with alkanes or LCFA. The marker combination with the most accurate allocation (81%) was LCFA and LCOH. Finally, the weakest discrimination with 12% correct al-location resulted from the combination of all 3 marker groups. The most accurate diet component allocation was achieved for concentrate, where a 100% allocation was accomplished unless all 3 marker groups were used. The plant-specific correct allocation varied from 50 to 77% with the best allocation for T. repens (77%) fol-lowed by D. glomerata (71%). The least accurate aver-age allocation was achieved for L. perenne as it was
Table 3. Effect of concentrate supplementation1 and cow strain2 on milk production performance and feed intake
Item
Conc0 Conc6
SD
P-value
HCH HNZ HCH HNZ Cow strain Treatment Interaction
Milk production performance
Milk yield (kg/d) 23.4 21.3 26.4 23.6 4.14 0.05 <0.001 0.58
Milk yield (kg/kg of concentrate) 0.49 0.40 0.44 0.55
ECM (kg/d) 21.7 20.9 22.6 21.6 4.05 0.44 0.18 0.86
Fat (%) 3.7 4.0 3.0 3.3 0.45 0.03 <0.001 0.92
Protein (%) 3.1 3.4 3.2 3.5 0.16 <0.001 <0.01 0.35
Lactose (%) 4.6 4.5 4.6 4.6 0.24 0.38 0.65 0.91
Acetone (mg/L) 2.7 2.3 1.6 1.5 0.64 0.26 <0.001 0.35
Urea (mg/L) 248 245 222 210 30.7 0.48 <0.001 0.55
Feed intake
Herbage DMI (kg/d) 15.4 14.7 12.2 10.9 2.30 0.10 <0.001 0.28
Total DMI (kg/d) 15.4 14.7 17.4 16.1 2.30 0.10 <0.001 0.28
1Conc0 = nonsupplemented cows; Conc6 = cows supplemented with 6 kg/d of concentrate.
2HCH = Swiss Holstein-Friesian cows; HNZ = New Zealand Holstein-Friesian cows.
Table 4. Effect of concentrate supplementation1 and cow strain2 on grazing and rumination behavior as well as on physical activity over 24 h
Item
Conc0 Conc6
SD
P-value
HCH HNZ HCH HNZ Cow strain Treatment Interaction
Grazing behavior over 24 h
Time (min) 541 558 463 470 47.1 0.32 <0.001 0.71
Mastications (no.) 40,066 42,130 33,279 34,166 4,418 0.17 <0.001 0.58
Mastication rate (no./min) 73.8 75.4 71.6 72.7 3.58 0.30 <0.01 0.83
Rumination behavior over 24 h
Time (min) 406 433 413 450 53.1 0.09 0.33 0.67
Mastications (no.) 29,590 32,046 29,725 33,607 5,011 0.09 0.47 0.54
Mastication rate (no./min) 72.8 73.9 71.7 74.3 4.67 0.31 0.67 0.34
Rumination boli (no.) 533 610 532 584 80.4 0.06 0.20 0.23
Mastications boli (no./boli) 56.3 52.8 57.3 58.4 9.79 0.76 0.08 0.20
Activity over 24 h
Lying (min) 473 465 521 478 75.3 0.22 0.16 0.40
Standing and moving (min) 968 976 920 963 75.3 0.22 0.16 0.40
Walking (min) 355 422 353 390 93.0 0.07 0.55 0.59
Steps (no.) 4,326 5,098 4,096 4,763 1,130 0.03 0.38 0.87
1Conc0 = nonsupplemented cows; Conc6 = supplemented cows.
[image:9.612.64.576.513.692.2]T able 5 . Concen trations (mg/kg
of DM) of
n -alk anes, long-c hain fatt y acids (LCF A), and long-c hain alcohols (LCOH) in samples of concen trate (n =
4) and plan
t sp
ecies
(n
=
4) for all data collection w
eeks Mark er LP 1 DG 2 OG 3 TR 4 TO 5 OF 6 Conc 7 Mean SD Mean SD Mean SD Mean SD Mean SD Mean SD Mean SD n -alk anes C24 1 0.3 1 0.5 1 0.3 0 0.1 0 0.4 1 0.2 0 0.1 C25 16 14.0 11 5.8 15 5.9 5 1.0 3 2.1 6 1.9 1 0.3 C26 1 0.8 1 0.4 1 0.2 1 0.3 1 0.5 1 0.2 0 0.1 C27 29 17.6 9 2.5 23 6.5 18 2.3 14 10.8 24 4.7 1 0.6 C28 2 0.6 1 0.3 2 0.6 2 0.4 2 1.6 3 0.5 40 1.5 C29 95 27.5 19 1.9 81 20.9 84 26.5 40 33.7 95 23.1 2 1 C30 6 1.3 1 0.5 4 1.1 4 2.0 2 1.9 8 2.5 0 0.1 C31 151 60.0 36 4.1 125 32.7 59 39.7 29 21.4 158 40.9 2 1 C32 3 0.4 2 1.0 3 0.7 2 0.8 2 1.5 7 2.2 0 0.1 C33 57 13.2 27 6.0 40 4.6 5 2.1 5 3.1 45 10.9 0 0.2 LCF A C22 424 86.1 426 119 612 188 671 255 1,259 1,431 416 116 308 65.4 C24 295 45.5 330 105 415 123 946 278 1,367 1,015 518 112 188 10.3 C26 354 126 787 286 658 270 574 133 436 136 257 45.9 87 3.4 C28 201 65.8 395 369 339 193 609 182 336 91.0 183 39.3 187 3.1 C30 93 46.8 73 42.8 160 104 162 64.0 126 19.9 114 47.6 5 1.2 C32 47 19.9 55 25.0 70 38.5 19 10 71 17.0 45 23.3 3 1.5 C34 16 7.9 48 21.0 27 16.3 2 1.2 16 3.9 8 2.3 0 0
LCOH C20
8 2.1 3 2.0 5 1.5 19 8.4 6 4.9 7 4.3 1 0.1 C22 16 2.4 38 14.6 19 5.9 19 4.9 35 16.0 26 8.4 1 0.3 C24 108 24.4 74 20.4 83 11.7 57 7.7 285 76.9 94 14.3 4 0.5 C26 2,362 871 6,519 2,223 3,599 915 370 30.2 1,010 91.9 363 49.8 7 1.1 C28 383 148 234 139 604 431 270 191 560 280 135 33.6 3 0.5 C30 23 17.0 30 22.2 56 40.0 808 63.6 454 132 51 53.7 0 0.3
1 LP =
Loli um p er en ne .
2DG =
Dactylis glo
m
er
ata
.
3 OG = other grass sp
ecies.
4TR =
T rifoli um r ep ens .
5 TO =
T ar axacu m offi ci nale .
6OF = other forb sp
ecies.
7 Conc = concen
trate; mean v
alue prop
ortional with normal (90%) and lab
eled concen
trate (10%) o
ver all data collection w
frequently mixed up with the group of other grass (data not shown). In Figure 2, the results of calculated FR are presented for alkanes, LCFA, and LCOH. All FR increased with increasing CCL, except for the FR2 of the LCOH, where FR increased until LCOH with a CCL of 26 and decreased for the ones with a CCL of 28 and 30. Both FR methods for alkanes and LCOH indicated an incomplete recovery (FR < 1.0) of the lower CCL alkanes (C24 to C32) and LCOH (C20 to C28), but were >1.0 for the C33 alkane and the C30 LCOH. The average FR of LCFA was higher than the FR of alkanes and LCOH. For the LCFA with a CCL of 26 to 32 FR was >1.0 with the highest rate for the LCFA with a CCL of 26 (FR1 = 2.6, and FR2 = 2.4).
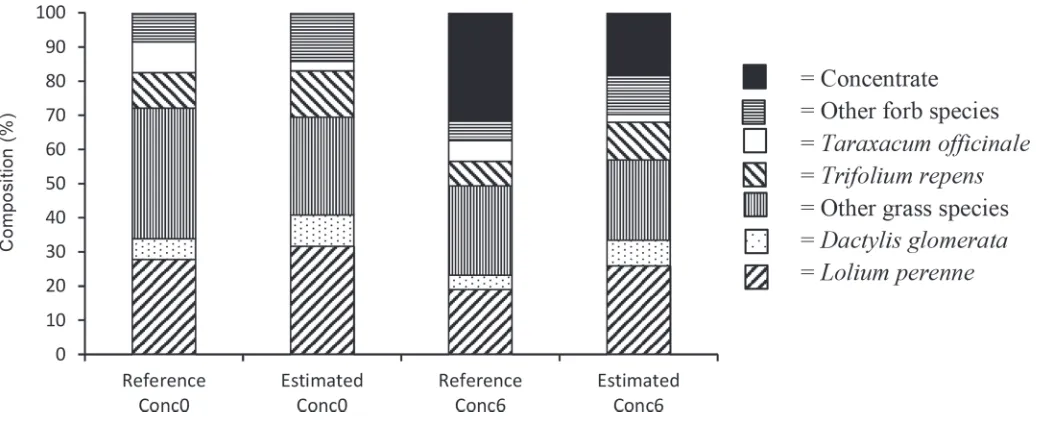
The accuracy of the diet composition estimation de-pending on the marker combinations was ranked based on the Aitchison distance (Table 7). With the com-bination alkanes, LCOH and FR1, the most accurate estimation was achieved (smallest Aitchison distance), as shown in Figure 3, with and without concentrate included, compared with the assessed botanical compo-sition. The least accurate diet composition estimations were achieved with the combination alkanes and LCFA, and LCFA alone: with or without FR correction. Using the most accurate marker group combination, alkanes, LCOH, and FR1, differences between cow strains or concentrate supplementation on diet composition has been tested (Table 8). Results indicate no difference between cow strains (P = 0.49), but an effect of con-centrate supplementation (P = 0.02) on diet selection. Nonsupplemented cows had a lower (P < 0.05) propor-tion of T. repens in their diet compared with supple-mented cows.
DISCUSSION
Plant Wax Concentration and Profiles of Plant Species
A sufficient differentiation between plant species is essential for successful diet estimation. Differentiation between plant species with alkanes, LCFA, and LCOH
is feasible, but most previous studies included only a few pasture plant species (Boland et al., 2012) or stud-ied diets containing herbaceous and heathland woody species (Ferreira et al., 2009). Similar marker profiles between different species result in incorrect allocations, which create a challenge for accurate diet composition estimation. Therefore, plant species from the same genus or plants with similar marker profile can be sum-marized and denoted as one diet component (Ferreira et al., 2011). However, differences in palatability and consequently intake have to be considered. For exam-ple, D. glomerata is less preferred than L. perenne when taking the whole grazing season into account (Ivins, 1952), because the decline in quality of D. glomerata is more rapid than that of L. perenne. Concentrations of all 3 marker groups varied within plant species samples, which was attributed to environmental conditions (Dove et al., 1996) and simultaneous sampling of plant species and animal feces is required. Date of sampling influences the alkanes concentration depending on the plant growth stage, as concentration differs between plant parts. The highest is in the florescence, at least for L. perenne (Dove et al., 1996; Ferreira et al., 2009),
T. officinale, and T. repens (Gedir and Hudson, 2000). Ferreira et al. (2009, 2015) observed similar LCFA and LCOH marker profiles of L. perenne for leaf and stem fractions, and for the spike fraction, and there may be only minor differences between plant parts in other plant species, which should be tested in future studies. The concentration of the C31 alkane was high in samples of L. perenne and in the group of other grass, which is typical for grass species (Bush and McInerney, 2013). Furthermore, alkane and LCFA profiles of L. perenne
and other grass were similar, probably because cognate grasses such as Lolium multiflorum are included in the group of other grass, resulting in frequent mixing up in the outcome of the linear discriminant analysis. The C29 alkane was dominant in T. repens, which is typical for legumes (Dove et al., 1996; Charmley and Dove, 2007), and a 100% correct assignment of T. repens profiles was achieved with alkanes. In accordance with Schori et al. (2012), T. officinale had low alkane
concentra-Table 6. Correct allocation (%) of marker profiles of plant species and concentrate with linear discriminant analysis1
Marker group combination LP DG OG TR TO OF Conc Total
n-alkanes 75 75 75 100 100 50 100 81
LCFA 50 100 50 100 100 75 100 81
LCOH 75 100 100 100 100 100 100 96
n-alkanes + LCFA 25 50 75 67 0 75 100 56
n-alkanes + LCOH 50 100 75 75 67 50 100 74
LCFA + LCOH 50 75 50 100 100 100 100 81
n-alkanes + LCFA + LCOH 25 0 0 0 0 25 33 12
1LP = Lolium perenne; DG = Dactylis glomerata; OG = other grass species; TR = Trifolium repens; TO = Taraxacum officinale; OF = other
[image:11.612.60.576.617.704.2]tions, but achieved a 100% correct assignment with alkanes alone. Long-chain fatty acids achieved a good differentiation of plant species, but no individual LCFA was identified that contributed most for differentiation. The concentration of LCFA in samples of L. perenne
was similar to that of Ferreira et al. (2010), except C30 and C32 LCFA, which in the current study showed lower concentration. In contrast, concentrations of the LCFA with a CCL of 22, 24, 26, and 28 in T. repens samples were higher in the current study compared with Fer-reira et al. (2010) and those with a CCL of 30, 32, and 34 were in the same range. Environmental condi-tions, variety, and plant growth stage can influence the
concentration of plant wax markers. A comparison of samples from different locations and time is therefore problematic. The predominant LCOH for grass species are those with a CCL of 26 and 28 (Dove and Charm-ley, 2008; Ferreira et al., 2015), whereas the C30 LCOH was dominant in T. repens, which is typical for clover (Dove and Charmley, 2008). However, the C24 and C26 LCOH contributed most to the accurate allocation in the current study. Labeling the concentrate with the C28 alkane seems to be sufficient for discrimination, and allocation also worked well with LCFA and LCOH without labeling. However, estimations of proportion of concentrate in the diet may be underestimated (Figure 3). Hameleers and Mayes (1998) did not consider the supplemented barley in diet composition calculations because of the low alkane concentration. Without la-beling, grain-based concentrate, which has low alkane concentrations, may lead to difficulties in accurate estimation of the concentrate proportion in the diet (Charmley and Dove, 2007). The advantage of using labeled concentrate is the parallel assessment of DMI of the animals, as discussed in Dove and Charmley (2008).
Fecal Recovery
Estimation of FR of grazing animals is difficult as to-tal fecal output, composition of plant species on pasture and precise pasture DMI estimation are required. An independent feeding experiment with housed animals and total feces collection is labor intense and expensive, and feed selection of cut herbage fed indoors might be different compared with selection behavior on pasture. Rectal grab samples collected once or twice daily pro-vide a representative marker profile in the feces and are valid for estimating diet composition under field condi-tions (Dove and Charmley, 2008). Calculated FR based on the fixed FR of Yb led to appropriate results, at least for alkanes and LCOH. Further studies are neces-sary to investigate whether the methods for calculating FR are adequate and correlate to measured FR.
[image:12.612.34.284.253.692.2]In previous studies, FR increased with increasing CCL for alkanes, LCFA, and LCOH (Dove and Charm-ley, 2008; Elwert et al., 2008; Ferreira et al., 2011). In the current study, all calculated FR tended to increase with CCL except the FR2 for LCOH. Similar to the study of Ferreira et al. (2009), no clear relationship was detected between alkane CCL and FR. A separate analysis of odd- and even-numbered alkanes indicated a linear increase for FR of odd-numbered alkanes and a curvilinear decrease for FR of even-numbered alkanes. Concentration of even-numbered alkanes is low com-pared with odd-numbered alkanes and low concentra-tions include more analytical uncertainties. The values of both calculated FR and their SD for LCFA were
unrealistically high (up to 2.6) with the highest value for the LCFA with CCL of 26. The increase of both calculated FR occurred in a curvilinear way, as in the study of Ferreira et al. (2011). Equally, a high
concen-tration of the LCFA with a CCL of 26 was observed in the study of Ferreira et al. (2011), although the value did not exceed 1.0. The current method of calculating FR did not work for LCFA as evidenced by
unrealisti-Table 7. Results of diet estimation validation with Aitchison distance
Sequence Marker combination1 Fecal recovery2 Aitchison distance
1 n-alkanes + LCOH FR1 0.3683
2 n-alkanes + LCOH FR2 0.437
3 LCOH FR2 0.447
4 n-alkanes + LCOH FR0 0.458
5 LCOH FR0 0.463
6 LCOH FR2 0.474
7 n-alkanes + LCFA + LCOH FR2 0.583
8 LCFA + LCOH FR2 0.630
9 n-alkanes + LCFA + LCOH FR1 0.637
10 n-alkanes + LCFA + LCOH FR0 0.644
11 LCFA + LCOH FR0 0.647
12 LCFA + LCOH FR1 0.669
13 n-alkanes FR0 0.680
14 n-alkanes FR1 0.734
15 n-alkanes FR2 0.809
16 n-alkanes + LCFA FR0 1.060
17 LCFA FR0 1.060
18 n-alkanes + LCFA FR1 1.060
19 LCFA FR1 1.060
20 n-alkanes + LCFA FR2 1.060
21 LCFA FR2 1.060
1LCFA = long-chain fatty acids. LCOH = long-chain alcohols.
2FR0 = no correction for fecal recovery. FR1 = mean fecal recovery calculated according to alkanes in herbage
samples. FR2 = mean fecal recovery according to botanical composition analysis.
3Value for Aitchison distance of the marker combination alkanes + LCOH and FR1 differs significantly (P <
[image:13.612.121.521.92.312.2]0.001) from the value for Aitchison distance of marker combination alkanes and LCOH with FR2.
[image:13.612.61.580.452.663.2]cally high values but, in contrast, calculated FR for al-kanes and LCOH seemed to be appropriate. Measured LCFA in feces could partly originate from endogenous sources and peaks might not be completely pure (Ali et al., 2005). However, a subset of samples was tested us-ing GC-MS and peaks of LCFA were identified without contamination of other FA components. Nevertheless, the LCFA concentration in feces may be overestimated leading to unrealistically high FR and resulting in inac-curate diet estimations. Both methods of calculating FR achieved similar results (taking into account the relation between the difference of the means to the SD) for alkanes, LCFA and LCOH, except C28 and C30 LCOH. The FR1 increased with increasing CCL in a linear way as recorded by Dove and Charmley (2008), but FR2 increased up to the C26 LCOH and decreased with increasing CCL afterward. Furthermore, SD was high for the LCOH with a CCL of 30, especially for FR1. This may be related to different consumption of
T. repens, which has high concentrations of C30 LCOH. Ruminant species may also have an effect on FR (Ferreira et al., 2011) as well as diet composition (Elwert et al., 2008; Ferreira et al., 2010), although others reported no effect of diet composition on FR (Ali et al., 2004; Dove and Charmley, 2008). Increasing digestibility of diet components decreased the FR of alkanes, which partly explained the differences in FR between diets in the study of Elwert et al. (2008). In accordance with Ferreira et al. (2015), diet estimation was more accurate with FR than without FR, indicat-ing that a correction of marker concentration in feces is recommended. The significant difference between the combinations of alkanes and LCOH with either FR1 or FR2 for diet estimation indicates that a correction of recoveries calculated with the alkanes (FR1) results in more precise diet estimation, at least for the combina-tion of alkanes and LCOH. Probably, diet estimacombina-tions
with FR1 achieved better results as alkanes were also used to estimate botanical composition for calculating FR. The botanical composition assessed during manual separation of plant species for FR2 might be a more independent factor. Therefore, it is important that pasture is grazed evenly without systematic leftovers. This is difficult to ensure as cows avoid grazing around dung patches. Further studies with total fecal output collection would be necessary to confirm and improve the used methods for FR determination.
Diet Composition Estimations
Results of diet estimation with the program “Eat-What” (Dove and Moore, 1995) were compared using the Aitchison distance with the average botanical com-position of pastures. Cows stayed on paddocks until an average postgrazing height of 56 mm in the first and 64 mm in the second period and thus, we can assume a consumption of all plants on pasture. This assump-tion was supported by visual evaluaassump-tions. Regarding marker groups separately, LCOH achieved best results for diet estimation followed by results with alkanes and the poorest results were reached with LCFA, as in Ali et al. (2005). The best combination for diet estima-tion was alkanes and LCOH with a correcestima-tion of FR, followed by LCOH alone. This is in agreement with Ferreira et al. (2015), where a combination of alkanes and LCOH improved accuracy of diet estimation com-pared with LCOH or alkanes alone. In our study, using LCOH alone achieved a more accurate diet estimation compared with any combination with LCFA or with a combination of all 3 marker groups.
[image:14.612.95.493.563.660.2]The marker group combination of alkanes and LCFA resulted in a less accurate diet estimation compared with LCOH alone, which is contrary to results of Fer-reira et al. (2011). Despite reasonable differentiation
Table 8. Results of diet estimation with most accurate marker combination (alkanes and long-chain alcohols
with fecal recovery 1) and their effect on concentrate supplementation and cow strain1
Item1
(%)
Conc02 Conc63
SD
P-value
HCH4 HNZ5 HCH4 HNZ5 Cow strain Treatment Interaction
LP 35.3 30.6 28.2 31.0 22.1 0.97 0.73 0.81
DG 8.4 9.9 7.3 10.3 10.0 0.32 0.67 0.41
OG 32.3 33.1 22.7 24.7 19.5 0.59 0.14 0.70
TR 11.4 13.4 14.9 15.4 8.7 0.23 <0.05 0.33
TO 2.2 1.9 5.7 1.6 7.3 0.87 0.88 0.48
OF 10.6 10.5 21.2 17.1 11.7 0.59 0.40 0.88
1LP = Lolium perenne. DG = Dactylis glomerata. OG = other grass species. TR = Trifolium repens. TO =
Taraxacum officinale. OF = other forb species.
2Conc0 = nonsupplemented cows.
3Conc6 = cows supplemented with 6 kg/d of concentrate.
4HCH = Swiss Holstein cows.
between plant species, diet estimation reached poor results with LCFA, as in Ali et al. (2005), indicating difficulties in the analysis of LCFA in feces. Thus, dif-ferentiation of marker profiles between plant species is essential, but does not guarantee reasonable results for diet estimation. Other factors, such as correction of FR or relation of patterns in plant species to patterns in fe-ces influence the method of diet estimation. Mayes and Dove (2000) mentioned that markers with the highest concentration affected diet estimation more than lower marker concentration, particularly when least squares are used. Transforming to relative terms, weighting individual marker concentration or omitting certain markers according to individual analytical uncertain-ties, concentration levels, utility for discrimination, or variability within plant species might be useful for a better diet composition estimation (Mayes and Dove, 2000).
With the best marker combination (alkanes and LCOH with FR1), concentrate was identified as a part of diet composition but, the proportion was underes-timated (Figure 3), which is in line with the results of Dove and Charmley (2008) who calculated FR as a grand mean of all treatments. On the other hand, herb-age DMI might be underestimated resulting in higher percentage of concentrate in the diet. Average herbage DMI of 15 kg/d for nonsupplemented cows seemed to be reasonable and is comparable to values presented in the review of Bargo et al. (2003). Higher herbage DMI (McCarthy et al., 2007) are possible as herbage DMI depends on intake capacity, milk production, and herbage offer (quality and quantity). Estimating DMI of grazing animals may contain difficulties (Thanner et al., 2014), but the double-alkane method was tested in-doors (Berry et al., 2000) and outin-doors (Bezabih et al., 2012), and considered to be accurate. Estimated per-centage of T. officinale in the diet was lower compared with botanical composition, although dairy cows may prefer T. officinale over grass species (Lantinga et al., 2004). The underestimation might have resulted from low alkane concentrations of T. officinale, even though LCOH concentration was high. Low marker concentra-tions lead to difficulties in accurate diet composition estimation (Charmley and Dove, 2007). A reason for the overestimated portion of the group other forbs may be the heterogeneous composition of the group. Forb species differ in their morphological appearance, and a separate analysis of forb species, which are included in the group other forbs, may be necessary to test the variance of marker profiles between them and decide if a different grouping of the forbs is preferable. Differ-ences between botanical composition on pasture and estimated diet composition might occur because of individual variation of cows’ selection behavior.
Com-pared with other studies where all cows received the same diet with the same composition, diet selection and preference may play a bigger role in grazing dairy cows.
Differences Between Cow Strains and Effect of Concentrate Supplementation
2006; Chapman et al., 2007). In contrast to the afore-mentioned studies, the current study took place on an organic, multispecies sward with a T. repens proportion of only 10%, and thus, cows had to search more for preferred plant species. This assumption was supported by the results of similar physical activity between nonsupplemented and supplemented cows, although grazing time was significantly lower for supplemented cows. On the other hand, weather conditions in the first measurement period may have precluded supplemented cows lying down for long periods. Supplemented cows were probably more quickly satiated with a lower moti-vation to graze, which is supported by results of lower grazing time and lower mastication rate, but higher motivation to search for palatable plant species. Fast-ing sheep spend less time eatFast-ing clover than L. perenne
(Newman et al., 1994), indicating that fasting prob-ably provokes a higher feeding drive, which results in longer grazing time and less selection. More research is needed to explore whether ruminants are able to select plant species to match their nutrient demand and which signals lead them to select. If other stud-ies confirm that supplemented cows change their diet selection to balance carbohydrates and protein in the diet and to reduce the load of rapidly fermented carbo-hydrates, sward composition could be better adapted to the needs of the ruminants, for example, by increasing the percentage of T. repens of pasture DM. This may therefore increase efficiency.
CONCLUSIONS
The results of our study indicate that the diet se-lection of dairy cows under grazing condition can be estimated with plant wax markers. For the differentia-tion of plant species, LCOH performed best and the combination of all 3 marker groups achieved the worst differentiation. Diet estimation with LCFA alone or in combination gave poor results. Analytical difficulties concerning LCFA in feces might create uncertainties in the estimation of diet selection. The calculated FR relative to Yb gave mostly realistic results, but further validation is required. Using calculated FR instead of experimental measured ones would be time-saving, less expensive, and applicable for field work. The marker group combination alkanes and LCOH with FR1 achieved the most accurate results for diet composition estimation and provided evidence that HCH and HNZ cows had a similar diet selection behavior, and that concentrate supplementation influenced diet selection of grazing dairy cows. The knowledge of diet selection and foraging behavior may allow optimization of the offer (herbage) to the demands of the cows, which is
expected to improve animal health, welfare, and effi-ciency.
ACKNOWLEDGMENTS
This study was funded by the AGFF (Zurich, Swit-zerland) research fund and the Fondation Sur-la-Croix (Basel, Switzerland). The authors gratefully acknowl-edge the help afforded to them by the staff of the farm “Ferme École de Sorens” and S. Thanner (Agroscope, Posieux, Switzerland) for assistance with the cows dur-ing experiment. We thank the staff of Agroscope in Po-sieux and F. Keay of Leeds University for assistance in the laboratory analysis and W. Luginbühl (Chemstat, Bern, Switzerland) for statistical advice.
REFERENCES
Agroscope. 2013. Fütterungsempfehlungen und Nährwerttabellen für Wiederkäuer (Grünes Buch). Online ed. Forschungsanstalt Agro-scope Liebefeld-Posieux ALP, Posieux, Switzerland.
Aitchison, J., C. Barceló-Vidal, J. A. Martín-Fernández, and V. Paw-lowsky-Glahn. 2000. Logratio analysis and compositional distance. Math. Geol. 32:271–275.
Ali, H. A. M., R. W. Mayes, B. L. Hector, A. K. Verma, and E. R. Ør-skov. 2005. The possible use of n-alkanes, long-chain fatty alcohols and long-chain fatty acids as markers in studies of the botanical composition of the diet of free-ranging herbivores. J. Agric. Sci.
143:85–95. https://doi.org/10.1017/S0021859605004958.
Ali, H. A. M., R. W. Mayes, C. S. Lamb, B. L. Hector, A. K. Verma, and E. R. Ørskov. 2004. The potential of long-chain fatty alcohols and long-chain fatty acids as diet composition markers: Develop-ment of methods for quantitative analysis and faecal recoveries of these compounds in sheep fed mixed diets. J. Agric. Sci. 142:71–78.
https://doi.org/10.1017/S0021859604004034.
AOAC International. 1995. Official Methods of Analysis. 16th ed. AOAC International, Arlington, VA.
Bach, A., J. J. Villalba, and I. R. Ipharraguerre. 2012. Interactions between mild nutrient imbalance and taste preferences in young
ruminants. J. Anim. Sci. 90:1015–1025. https://doi.org/10.2527/
jas.2011-4176.
Bargo, F., L. D. Muller, E. S. Kolver, and J. E. Delahoy. 2003. Invited review: Production and digestion of supplemented dairy cows on
pasture. J. Dairy Sci. 86:1–42.
https://doi.org/10.3168/jds.S0022-0302(03)73581-4.
Berry, N. R., M. R. L. Scheeder, F. Sutter, T. F. Kröber, and M. Kreu-zer. 2000. The accuracy of intake estimation based on the use of al-kane controlled-release capsules and faeces grab sampling in cows.
Ann. Zootech. 49:3–13. https://doi.org/10.1051/animres:2000104.
Bezabih, M., W. F. Pellikaan, A. Tolera, and W. H. Hendriks. 2012. Estimation of feed intake and digestibility in cattle consuming low-quality tropical roughage diets using molasses-based
n-al-kane bolus. Anim. Feed Sci. Technol. 177:161–171. https://doi.
org/10.1016/j.anifeedsci.2012.08.014.
Boland, H. T., G. Scaglia, D. R. Notter, A. J. Rook, W. S. Swecker, and A. O. Abaye. 2012. Diet composition and dry matter intake of beef steers grazing tall fescue and alfalfa. Crop Sci. 52:2817–2825.
https://doi.org/10.2135/cropsci2011.12.0638.
Bramley, E., I. J. Lean, W. J. Fulkerson, M. A. Stevenson, A. R. Rabiee, and N. D. Costa. 2008. The definition of acidosis in dairy herds predominantly fed on pasture and concentrates. J. Dairy Sci.
91:308–321. https://doi.org/10.3168/jds.2006-601.
Chapman, D. F., A. J. Parsons, G. P. Cosgrove, D. J. Barker, D. M. Marotti, K. J. Venning, S. M. Rutter, J. Hill, and A. N. Thomp-son. 2007. Impacts of spatial patterns in pasture on animal grazing
behavior, intake, and performance. Crop Sci. 47:399–415. https://
doi.org/10.2135/cropsci2006.01.0036.
Charmley, E., and H. Dove. 2007. Using plant wax markers to estimate diet composition and intakes of mixed forages in sheep by feeding a known amount of alkane-labelled supplement. Aust. J. Agric. Res.
58:1215–1225. https://doi.org/10.1071/AR07187.
Denbow, D. M., and M. A. Cline. 2015. Intake regulation. Pages 469– 485 in Sturkie’s Avian Physiology. Vol. 6. C. G. Scanes, ed. Aca-demic Press, London, UK.
Dove, H., and E. Charmley. 2008. Using the alkanes and long-chain alcohols of plant cuticular wax to estimate diet composition and the intakes of mixed forages in sheep consuming a known amount
of alkane-labelled supplement. Animal 2:1474–1485. https://doi.
org/10.1017/S1751731108002735.
Dove, H., and R. W. Mayes. 1991. The use of plant wax alkanes as marker substances in studies of the nutrition of herbivores: A re-view. Aust. J. Agric. Res. 42:913–952.
Dove, H., and R. W. Mayes. 2006. Protocol for the analysis of n-alkanes and other plant-wax compounds and for their use as markers for quantifying the nutrient supply of large mammalian
herbivores. Nat. Protoc. 1:1680–1697. https://doi.org/10.1038/
nprot.2006.225.
Dove, H., R. W. Mayes, and M. Freer. 1996. Effects of species, plant part, and plant age on the n-alkane concentrations in the cuticular wax of pasture plants. Aust. J. Agric. Res. 47:1333–1347.
Dove, H., and A. D. Moore. 1995. Using a least-squares optimization procedure to estimate botanical composition based on the alkanes of plant cuticular wax. Aust. J. Agric. Res. 46:1535–1544. Elwert, C., H. Dove, and M. Rodehutscord. 2008. Faecal alkane
recov-eries from multi-component diets and effects on estimates of diet
composition in sheep. Animal 2:125–134. https://doi.org/10.1017/
S1751731107000900.
Fedele, V., M. Pizzillo, S. Claps, P. Morand-Fehr, and R. Rubino. 1993. Grazing behavior and diet selection of goats on native
pas-ture in Southern Italy. Small Rumin. Res. 11:305–322. https://doi.
org/10.1016/0921-4488(93)90002-Y.
Ferreira, L. M. M., S. Carvalho, V. Falco, R. Celaya, U. García, A. S. Santos, M. A. M. Rodrigues, and K. Osoro. 2009. Assessment of very long-chain fatty acids as complementary or alternative natu-ral fecal markers to n-alkanes for estimating diet composition of
goats feeding on mixed diets. J. Anim. Sci. 87:2732–2745. https://
doi.org/10.2527/jas.2008-1718.
Ferreira, L. M. M., R. Celaya, V. Falco, M. Oliván, A. S. Santos, C. Guedes, M. A. M. Rodrigues, and K. Osoro. 2010. Evaluation of very long-chain fatty acids and n-alkane epicuticular compounds as markers for estimating diet composition of sheep fed heathland
vegetation species. Anim. Feed Sci. Technol. 156:75–88. https://
doi.org/10.1016/j.anifeedsci.2010.01.007.
Ferreira, L. M. M., R. Celaya, A. S. Santos, V. Falco, C. Guedes, M. A. M. Rodrigues, and K. Osoro. 2011. The utilization of long-chain fatty acids as markers for diet composition estimates in ruminants: Effects of animal species, diet composition and marker
combi-nation. Grass Forage Sci. 66:183–195. https://doi.org/10.1111/
j.1365-2494.2010.00774.x.
Ferreira, L. M. M., R. Celaya, A. S. Santos, R. W. Mayes, M. A. M. Rodrigues, and K. Osoro. 2015. Application of long-chain alcohols as diet-composition markers in sheep fed on grass–white clover and
heather–gorse plant species. Grass Forage Sci. 70:30–43. https://
doi.org/10.1111/gfs.12083.
Gedir, J. V., and R. J. Hudson. 2000. Seasonal intake determination in reproductive wapiti hinds (Cervus elaphus canadensis) using
n-alkane markers. Can. J. Anim. Sci. 80:137–144. https://doi.
org/10.4141/A99-042.
Graf, C. M., M. Kreuzer, and F. Dohme. 2005. Effects of supplemental hay and corn silage versus full-time grazing on ruminal pH and chewing activity of dairy cows. J. Dairy Sci. 88:711–725.
Hall, M. B., W. H. Hoover, J. P. Jennings, and T. K. Miller Webster. 1999. A method for partitioning neutral detergent soluble carbo-hydrates. J. Sci. Food Agric. 79:2079–2086.
Hameleers, A., and R. W. Mayes. 1998. The use of n-alkanes to esti-mate herbage intake and diet composition by dairy cows offered a perennial ryegrass/white clover mixture. Grass Forage Sci. 53:164–
169. https://doi.org/10.1046/j.1365-2494.1998.5320164.x.
International Dairy Federation. 2000. Determination of milk fat, pro-tein and lactose content. Guide for the operation of mid-infra-red instruments. IDF Standard method No. 141C, Brussels, Belgium. International Dairy Federation. 2004. Milk. Determination of urea
content. Enzymatic method using difference in pH. IDF Standard method No. 195, Brussels, Belgium.
ISO (International Organization for Standardization). 2000. Animal feeding stuffs-Determination of starch content-Polarimetric meth-od. ISO, Geneva, Switzerland.
Ivins, J. D. 1952. The relative palatability of herbage plants. Grass
Forage Sci. 7:43–54. https://doi.org/10.1111/j.1365-2494.1952.
tb01302.x.
Koller, M. 2015. robustlmm: Robust Linear Mixed Effects Models. R
package version 1.7–2. Accessed Apr 10, 2015.
http://CRAN.R-project.org/package=robustlmm.
Lantinga, E. A., J. H. Neuteboom, and J. A. C. Meijs. 2004. Sward methods. Pages 23–52 in Herbage Intake Handbook. Vol. 2. P. D. Penning, ed. The British Grassland Society, Reading, UK. Lin, L. J., X. Y. Zhu, C. Jiang, H. L. Luo, H. Wang, Y. J. Zhang,
and F. Z. Hong. 2012. The potential use of n-alkanes, long-chain alcohols and long-chain fatty acids as diet composition markers: Indoor validation with sheep and herbage species from the
range-land of Inner Mongolia of China. Animal 6:449–458. https://doi.
org/10.1017/S1751731111001765.
Lin, Q., and J. F. Patience. 2016. Factors involved in the regulation of
feed and energy intake of pigs. Anim. Feed Sci. Technol. https://
doi.org/10.1016/j.anifeedsci.2016.01.001.
Lüscher, A., I. Mueller-Harvey, J. F. Soussana, R. M. Rees, and J. L. Peyraud. 2014. Potential of legume-based grassland-livestock
sys-tems in Europe: A review. Grass Forage Sci. 69:206–228. https://
doi.org/10.1111/gfs.12124.
Martín-Fernández, J. A., C. Barceló-Vidal, and V. Pawlowsky-Glahn. 2003. Dealing with zeros and missing values in compositional data sets using nonparametric imputation. Math. Geol. 35:253–278.
https://doi.org/10.1023/A:1023866030544.
Mayes, R. W., and H. Dove. 2000. Measurement of dietary nutrient intake in free-ranging mammalian herbivores. Nutr. Res. Rev. 13:107–138.
Mayes, R. W., C. S. Lamb, and P. M. Colgrove. 1986. The use of dosed and herbage n-alkanes as markers for the determination of
herb-age intake. J. Agric. Sci. 107:161–170. https://doi.org/10.1017/
S0021859600066910.
McCarthy, S., B. Horan, M. Rath, M. Linnane, P. O’Connor, and P. Dillon. 2007. The influence of strain of Holstein-Friesian dairy cow and pasture-based feeding system on grazing behaviour,
in-take and milk production. Grass Forage Sci. 62:13–26. https://doi.
org/10.1111/j.1365-2494.2007.00557.x.
Mertens, D. R. 2002. Gravimetric determination of amylase-treated neutral detergent fiber in feeds with refluxing in beakers or cru-cibles: Collaborative study. J. AOAC Int. 85:1217–1240.
Newman, J. A., P. D. Penning, A. J. Parsons, A. Harvey, and R. J. Orr. 1994. Fasting affects intake behaviour and diet preference of
grazing sheep. Anim. Behav. 47:185–193. https://doi.org/10.1006/
anbe.1994.1021.
Peiretti, P. G., G. Meineri, N. Miraglia, M. Mucciarelli, and D. Bergero. 2006. Intake and apparent digestibility of hay or hay plus concentrate diets determined in horses by the total collection of feces and n-alkanes as internal markers. Livest. Sci. 100:189–194.
https://doi.org/10.1016/j.livprodsci.2005.08.016.