UNIVERSITI TEKNIKAL MALAYSIA MELAKA
MODELLING AND FORECASTING THE BANDWIDTH
CONSUMPTIONS IN TECHNOLOGY CAMPUS OF UTeM BY
USING A STATISTICAL METHOD (ARIMA)
This report submitted in accordance with requirement of the Universiti Teknikal Malaysia Melaka (UTeM) for the Bachelor Degree of Engineering Technology (ELECTRONICS & COMPUTER ENGINEERING TECHNOLOGY) (Hons.)
by
NURAFIZA SURAYA BINTI MOHD YAACOB B 071310896
940131-06-5008
UNIVERSITI TEKNIKAL MALAYSIA MELAKA
BORANG PENGESAHAN STATUS LAPORAN PROJEK SARJANA MUDA
TAJUK:
MODELLING AND FORECASTING THE BANDWIDTH
CONSUMPTIONS IN TECHNOLOGY CAMPUS OF UTeM BY USING
A STATISTICAL METHOD (ARIMA)
SESI PENGAJIAN: 2015/16 Semester 1
Saya NURAFIZA SURAYA BINTI MOHD YAACOB
mengaku membenarkan Laporan PSM ini disimpan di Perpustakaan Universiti Teknikal Malaysia Melaka (UTeM) dengan syarat-syarat kegunaan seperti berikut:
1. Laporan PSM adalah hak milik Universiti Teknikal Malaysia Melaka dan penulis. 2. Perpustakaan Universiti Teknikal Malaysia Melaka dibenarkan membuat salinan
untuk tujuan pengajian sahaja dengan izin penulis.
3. Perpustakaan dibenarkan membuat salinan laporan PSM ini sebagai bahan pertukaran antara institusi pengajian tinggi.
4. **Sila tandakan ( )
(Mengandungi maklumat yang berdarjah keselamatan atau kepentingan Malaysia sebagaimana yang termaktub dalam AKTA RAHSIA RASMI 1972)
SULIT
TERHAD
TIDAK TERHAD Disahkan oleh:
Cop Rasmi:
Tarikh: ________________________ Alamat Tetap:
No. 3, Solok Sri Siantan 48, Taman Sri Andalas,
412000, Klang, Selangor, Malaysia
I
DECLARATION
I hereby, declared this report entitled “Modelling and Forecasting the Bandwidth Consumptions in Technology Campus of UTeM by Using a Statistical Method
(ARIMA)” is the results of my own research except as cited in references.
Signature : ……….
Author’s Name : NURAFIZA SURAYA BINTI MOHD YAACOB
II
APPROVAL
This report is submitted to the Faculty of Engineering Technology of UTeM as a partial fulfillment of the requirements for the degree of the degree of Bachelor of Engineering Technology Electronic Telecommunication with Honours. The member of the supervisory is as follow:
III
ABSTRAK
Jaminan jalur lebar dari rangkaian tidak disediakan untuk applikasi pengguna di Internet hari ini. Oleh itu, pengukuran jalur lebar seperti saiznya dan kapasiti rangkaian harus dititikberatkan sama ada kadar kegunaan applikasi penghantaran itu adalah sesuai dengan anggaran ukuran lebar jalur. Objektif projek ini adalah untuk menghasilkan sekumpulan model data dan peramalan siri data yang merupakan penggunaan jalur lebar dengan menggunakan ARIMA yang merupakan kaedah statistik yang berkesan untuk peramalan. Analisis ini mungkin berguna untuk meningkatkan sistem rangkaian kami untuk menjadi sebuah universiti terkemuka dalam teknologi rangkaian.
IV
ABSTRACT
The guarantees of bandwidth from the network is not available for end-user
V
DEDICATION
All the effort is dedicated to my beloved parents, family lecturers and friends, whose love can never be forgotten for their support, guidance and encouragement upon completing this project and report.
Special dedication to my parents and lecturers
MOHD YAACOB BIN MOHD JAAFAR
CHE JAH BINTI MOHAMED
MADAM RAHAINI BINTI MOHD SAID
VI
ACKNOWLEDGEMENT
In the name of Allah S.W.T, The most Merciful and the most Passionate, I am thankful to Allah for enabling me to complete this report.
First of all, I would like to thanks Madam Rahaini binti Mohd Said as my supervisor and Madam Nor Hamizah binti Miswan, lecturer of Faculty Technology Engineering for giving me a full cooperation and supervision during the making of this final year report. Not to be forgotten, I would like to thank my family and friends for contributing their ideas and also encouraging me by giving moral support in completing this report. Next, a thousand of thanks for peoples in Pusat Komputer in UTeM who is willing to spend their time to provide me the informations needed.
VII
TABLE OF CONTENTS
DECLARATION ... I APPROVAL ... II ABSTRAK ... III ABSTRACT ... IV DEDICATION ... V ACKNOWLEDGEMENT ... VI TABLE OF CONTENTS ... VII LIST OF TABLES ... IX LIST OF FIGURES ... IX
CHAPTER 1 ... 1
1.1 Background ... 1
1.2 Objectives ... 2
1.3 Problem Statement ... 3
1.4 Scope ... 3
1.5 Expected Results ... 4
CHAPTER 2 ... 5
2.1 Technology ... 5
2.2 Wireless ... 6
2.2.1 Wireless Network Component ... 7
2.2.2 WiFi Protocols and Data Rates ... 8
2.2.3 Wireless LAN Networking... 8
2.2.4 Different WLAN Technologies ... 9
2.2.5 Ad Hoc (Peer-to-Peer) Mode vs. Infrastructure Mode ... 10
2.2.6 Wi-Fi Security ... 11
2.3 Wireless Infrastructure in UTeM ... 13
2.3.1 INTERNET CONNECTION OF UTeM... 16
2.3.2 INTRANET CONNECTION ... 18
2.4 Management Network Technology ... 20
2.4.1 SNMP Limitation ... 20
VIII
2.5 Bandwidth Management ... 22
2.6 Time-Series and Forecasting ... 22
2.6.1 Basic of Forecasting ... 23
2.6.2 Three Types of Time Series Forecasts ... 24
2.6.3 Characteristics of Time Series... 25
CHAPTER 3 ... 27
3.1 INTRODUCTION ... 27
3.2 Collection of Data ... 29
3.3 ARIMA ... 29
3.3.1 ARIMA Modelling ... 29
3.4 E-View Software ... 34
3.5 R-Software ... 35
CHAPTER 4 ... 36
4.1 MODELLING THE DATA... 36
4.1.1 STATIONARY TEST ... 36
4.1.2 ACF AND PACF POTENTIAL VALUES ... 39
4.1.3 POTENTIAL MODELS ... 40
4.1.4 STATIONARY PARAMETERS ... 41
4.2 FORECASTING THE SELECTED MODEL ... 43
4.3 DISCUSSIONS ... 44
CHAPTER 5 ... 46
5.1 CONCLUSION ... 46
5.2 RECOMMENDATIONS ... 49
APPENDIX ... 50
IX
LIST OF TABLES
Table 2-1 802.11 Wi-Fi protocol summary ... 8
Table 2-2 Timeline of WEP ... 12
Table 2-3 Comparison between TMN and SNMP ... 21
Table 2-4 Alternative Forecasting Methods ... 25
Table 2-5 Description of Time Series Categories ... 26
Table 4-1Pontetial Models of Time Series ... 40
Table 4-2 Potential Parameters ... 42
LIST OF FIGURES
Figure 2.1 Overview of a WiFi LAN ... 6Figure 2.2 Basic Service Set and Extended Service Set ... 10
Figure 2.3 Ad hoc Mode ... 10
Figure 2.4 WEP encryption protocol... 11
Figure 2.5 Wireless Infrastructure ... 13
Figure 2.6 802.1X Authentication ... 16
Figure 2.7MYREN Connection Flow ... 16
Figure 2.8 UTeM's Intranet Connection ... 18
Figure 2.9 Simplest Internal Connection... 19
Figure 3.1 Flow of the procedures ... 28
Figure 3.2 Process in the ARIMA model ... 33
Figure 3.3 Open Workfile ... 34
Figure 3.4 Stationary Check ... 34
Figure 3.5 ADF Unit Root Test ... 35
Figure 3.6 Coding to produce ARIMA Model in Eview... 35
Figure 4.1 Stationary test for time series data ... 37
Figure 4.2 Graph before differencing ... 38
Figure 4.3 Graph after differencing... 38
Figure 4.4 ACF and PACF test ... 39
Figure 4.5 The values that needs to substitute in equation of ARIMA ... 41
Figure 4.6 Results in R-software ... 43
Figure 4.7 Graph based on the prediction result obtained... 44
1
CHAPTER 1
INTRODUCTION
1.1 Background
2
In this research, the type of data we used is a time series data. Time series is a grouping of numerical data focuses in progressive order, normally happen in uniform intervals. The data collection will be carried out by daily for 8 months which is from January to August. Then, the data will be analysed by using a statistical analysis using ARIMA (AutoRegressive Integrated Moving-Average). In addition, the collected data will produce a model of bandwidth consumption for the next 3 months. An ARIMA model can predict a value in a response time series as a line combination of its own past values. These models are believed to have the ability to capture the bandwidth consumption whereby their accuracy will be measured by using Mean Absolute Percentage Error (MAPE) and Root Mean Squared Error (RMSE) with the help of Eview software. The aim of this research will be successfully achieve once the most reliable model with minimum MAPE and RMSE values in forecasts bandwidth consumption in Technology Campus is produced.
1.2 Objectives
These are the objectives of this research:
i. To explore and study the network system in UTeM.
ii. To develop the time series models of bandwidth consumption by using ARIMA model.
3
1.3 Problem Statement
Nowadays, majority of students are well exposed in internet usage and it has become one of the needs in their live as a student. The lack of adequate access will slow down the efficiency of the learning process. Therefore, this study is to investigate whether the provided network bandwidth for students is sufficient enough to accommodate their needs. In case, there is too many user use the bandwidth at the same time, it may cause the traffic jam and hence slow down the work done. To live in such an evolving technology era, everything we do is a race. When it comes to race, it means we need to do the work as fast as we can or else we will be left out and not comparable with any university model.
1.4 Scope
This research will not cross over any limitations as below:
i. Study the network system at Technology Campus of UTeM. ii. Bandwidth of wireless data collection used in Technology
Campus for 3 months.
4
1.5 Expected Results
At the end of this research, I should be able to:
i. Understand the network system in UTeM.
5
CHAPTER 2
LITERATURE REVIEW
2.1 Technology
Nowadays, smartphone is one of the important communication technology. Moreover, recently it has a great processing capabilities and they are occupied with excellent graphical user interface (GUI), and multiple radio interfaces due to the momentous development in micro- electronics technology, (Palit, Naik, & Singh, 2012). In addition, they are increasing the functionality of the phones and they have built the ability to support resource intensive application. Next, the applications that have been added in the function of the phone are multimedia playing, global social networking, online gaming, global system (GPS) based navigation, and weather/stock updates. Plus, these applications are the application that related to the network will lead the smartphone to consume a high amount of wireless access traffict along with producing many uplink traffic. There are two ways of smartphone routing for wireless access traffic, first is infiltrate cellular and second is 802.11 based WiFi data networks, (Zhuang, Syed, Georgy, & El-Sheimy, 2015). Normally WiFi based networks consume less energy with higher data rates compared to the Universal Mobile Telecommunications System (UMTS) based 3G cellular data networks. Hence, because of its approachibility, comparison in bigger bandwidth and cheaper cost make it more preferable for smartphones to use WiFi data link by default.
6
broadband access showed to use a huge amount of energy for delivering data. Furthermore, learning science principles and amend education are going along with the specification of new technologies consistently.(Kozma, 2003). Henceforth, by providing platforms and materials to student it can help them to enhance learning process, new information and technologies of communication (ICT).. Additionally, students and teachers can build local and global communities through network technology and enable them to connect with interested peoples and expand opportunities for learning.
2.2 Wireless
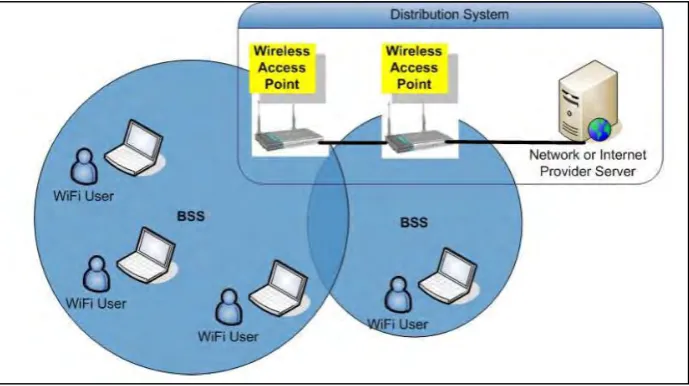
[image:17.595.147.492.482.675.2]Wireless local area networks technology which also known as WiFi is compling with IEEE 802.11 standards and owned by WiFi Alliance (Systems, 2009). The objective WiFi Alliance promotes standards is to improve the interoperability of wireless local area network products based on the IEEE 802.11 standards. Figure 2.1 describes the overview architecture of a WiFi LAN.
7
2.2.1 Wireless Network Component
There are 4 basics wireless components. The first is Access Point (AP). This component is to connect a wired LAN to a wireless network. Plus, it can increase the limits of a wireless network to work well and extra network maintenance. Second is PC Card, it will provide the ability for laptop users do the connection to the LAN wirelessly. This component normally have effective limits for connection of ad hoc up to 3 computers maximum is 1000 feet in open space. The third one is PCI adapter which allow the PC users to access to the LAN through a wireless adapter. It has same function as a wireless access PC card. The fourth is a router. This component act as a bridge to share a network across multiple gadgets.
These are the other components that form WiFi LAN:
BS/AP – Base Station or Access Point – a device equipped with antenna that will do the transmission and receiving radio packets between the end-user devices over wireless environment;
BSS – Basic Service Set – is the coverage of cell that is formed by radio antenna in Access Point;
DS – Distribution System – is the items that provide the Internet to the APs. It is possible to have in the office or home an Intranet without having a distribution system. There is where the internet to the APs is provided. In the office or home an intranet can be well functioning even without a distribution system. All devices can communicate and interconnect through a router even with only one AP.
8
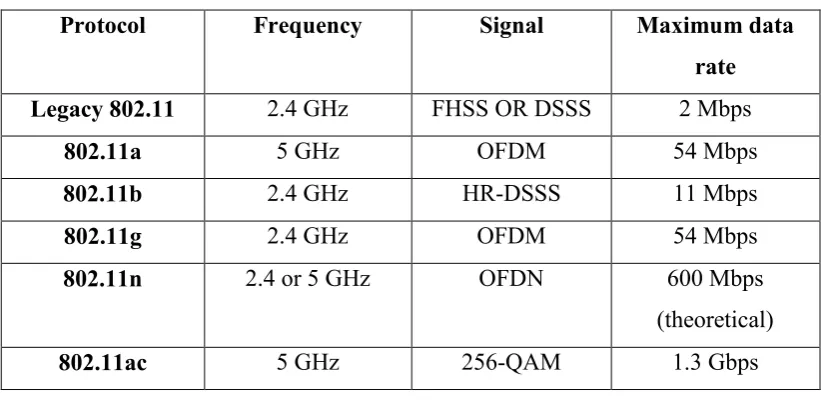
[image:19.595.141.552.157.357.2]2.2.2 WiFi Protocols and Data Rates
Table 2-1 802.11 Wi-Fi protocol summary
2.2.3 Wireless LAN Networking
As can be seen, wireless innovation has simplify networking by empowering various PC clients to at the same time share resources in a home or business without extra or meddling wiring, (Frank, 2009). These resources may include a broadband Internet connection, network printers, information documents, and even streaming audio and video. This sort of resource sharing has turned out to be more pervasive as PC clients have changed their habits from using single, stand-alone PCs to work on networks with numerous PCs, each with conceivably diverse operating systems and varying peripheral hardware, (Hong, Nam, & Kim, 2015).
Protocol Frequency Signal Maximum data
rate
Legacy 802.11 2.4 GHz FHSS OR DSSS 2 Mbps
802.11a 5 GHz OFDM 54 Mbps
802.11b 2.4 GHz HR-DSSS 11 Mbps
802.11g 2.4 GHz OFDM 54 Mbps
802.11n 2.4 or 5 GHz OFDN 600 Mbps
(theoretical)
9
2.2.4 Different WLAN Technologies
10
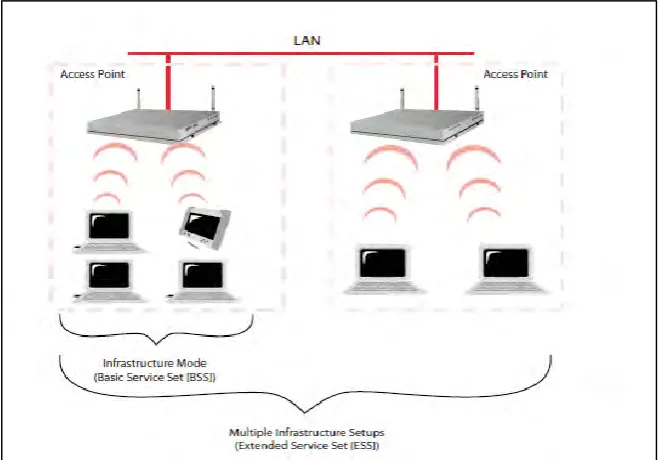
2.2.5 Ad Hoc (Peer-to-Peer) Mode vs. Infrastructure Mode
[image:21.595.156.480.168.322.2]Two modes of operational model: ad hoc (peer-to-peer) mode and infrastructure mode.
Figure 2.2 Basic Service Set and Extended Service Set
[image:21.595.155.486.370.600.2]11
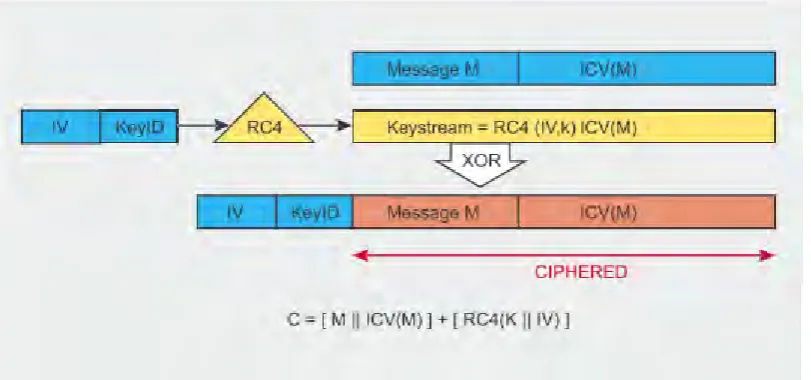
2.2.6 Wi-Fi Security
WEP
WEP (Wired Equivalent Privacy) was the default encryption presented in the first IEEE 802.11 standard in 1999 (Lehembre, 2005). It depends on the RC4 encryption algorithm, with a mystery key of 40 bits or 104 bits being joined with a 24-bit Initialisation Vector (IV) to encrypt the plaintext message M and its checksum – the ICV (Integrity Check Value). Hence, the encrypted message was determined using the following formula:
[image:22.595.138.544.543.733.2]𝐶 = [𝑀||𝐼𝐶𝑉 (𝑀)] + 𝑅𝐶4(𝐾||𝐼𝑉)]
Where, || = concatenation operator and + = XOR operator
The key to WEP security is the initialisation vector, hence to maintain a decent level of security and minimise disclosure the IV should be incremented for each packet,(Mekhaznia & Zidani, 2015). However, for WEP security, the IV conducted in plain text and the 802.11standard does not mandate IV incrementation, leaving this security measure at the possibility of particular wireless terminal (access point or wireless card) implementations.
12
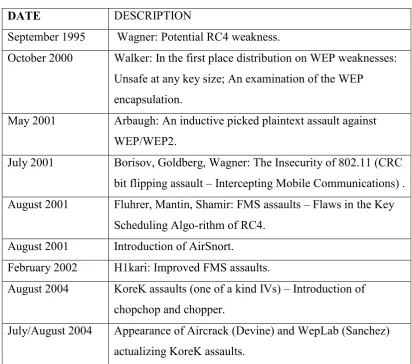
Table 2-2 Timeline of WEP
DATE DESCRIPTION
September 1995 Wagner: Potential RC4 weakness.
October 2000 Walker: In the first place distribution on WEP weaknesses: Unsafe at any key size; An examination of the WEP encapsulation.
May 2001 Arbaugh: An inductive picked plaintext assault against WEP/WEP2.
July 2001 Borisov, Goldberg, Wagner: The Insecurity of 802.11 (CRC bit flipping assault – Intercepting Mobile Communications) . August 2001 Fluhrer, Mantin, Shamir: FMS assaults – Flaws in the Key
Scheduling Algo-rithm of RC4. August 2001 Introduction of AirSnort.
February 2002 H1kari: Improved FMS assaults.
August 2004 KoreK assaults (one of a kind IVs) – Introduction of chopchop and chopper.
13
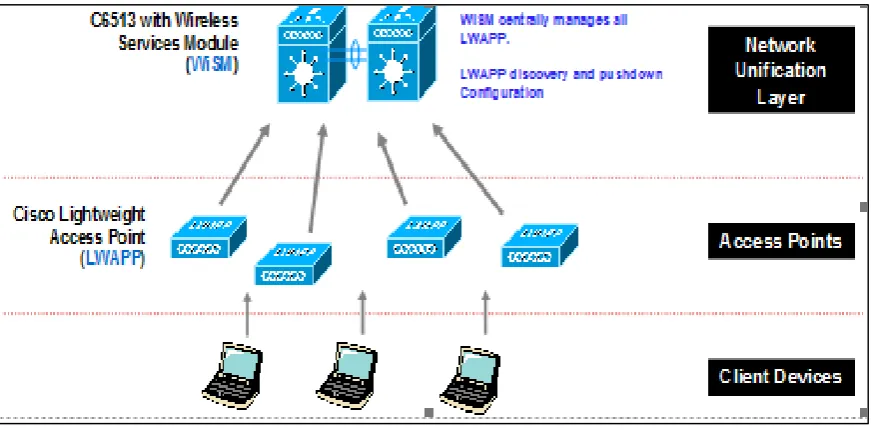
2.3 Wireless Infrastructure in UTeM
Overview
The wireless infrastructure mentioned here is the Cisco Wireless Service Module (WiSM) which is installed on both the Data Center Switches. The Catalyst 6500 Series Wireless Services Module (WiSM) is an integrated Catalyst 6500 supports up to 300 lightweight access points. The switch has eight internal Gigabit Ethernet ports that connect the switch and the controller. The switch and the internal controller run separate software versions, which must be upgraded separately.
A single Cisco WiSM actually has two Wireless LAN Controller (WLC) 4404 built-in to the module and is managed as a separate entity. Each module has the ability to support 150 lightweight Access Points. With two WiSM modules in place, therefore a total of 4 x WLC 4404 controllers will be fully functional and operational for scaling UTeM’s Wireless network in the future.
[image:24.595.118.554.504.719.2]The WiSM controllers here in the Data Center are to cater for all the access points within the Industrial campus. UTeM has an existing LAN Controller which will be installed in the City Campus for the AP’s that are there.