L[N$lilfi
E$PT
0bservatory
on
national
policies
to
combat
exclusion
social
THE NERTHERI.ANDS
Commission
of
the
European Communities
'l'his
rcport
was
produced
by
indepcndcnt
experts,
and
should not
be
taken to represent
thc
views
DUTCII
POLICIES TO COMBAT
SOCIAL EXCLUSION:
CONSOLIDATED
REPORT,
1990.1991
Tilburg, September 1992
H.J. Dirven
G.J.M. Jehoel-Gijsbers
S. Serail
Written under the direction of
Prof. J. Berghman
Report for the European Commission by the Depanment of Social Security Studies and
Publisher:
IVA, Institute for Social Rese archTilburg Univenity
Warandelaan 2. P.O. Box 90153 NL-5000 LE Tilburg, The Netherlands
Phone : + 3 I 13 66 24 37. telefax: +
3ll3
66 29 59Word Processing
:
Monique Seebregs Bea van Wiflk@ |992IVA. Institute fot Social Research
TABLE
OF
CONTENTS
Page
Introduction.
...1Preliminary
work.."...".,..
.."..."..2Keys to the interpretation of the dutch welfare state ..."...."...7
Data on social exclusion in the Netherlands. ".".12 Uni-dimensional
disadvantage..."...
....""...13Income and property
ownership"...
..."....""."...13Consumption, expenditure and indebtedness..."...21
Educational
achievement."
.."".."""...22Employment and Working
Conditions
...""...24Housing...
"...""27Health...
...28Multi-dirnensional disadvantage
...
...30Longitudinal
disadvantage
...33Policies to combat social exclusion in the
Netherlands..
..."...36The first track: Increasing labor market participation...37
Economic growth
...
..."...39The activating labor market policy
...
...41The second track: Income policy and the role
of
socialsecurity
...46 National Assistance4
4.1
4.t"1
4.1.2 4.1.3 4.1.4
4.1.5-4.r.6
4)
4"3
5
5.1
5.1.1
5.r.2
5.2
5"2.2 5.2.3 5.2.4 5.2.5
5.3 5.3.1
5.3.2 5.3.3 5.4
5.4.1
5.4.2 5.4.3 5.4.4
References
The Adaptation Mechanism
Act...,.
...48Special
Assistance...
...49The Youth Employment Guarantee Act...50
Occupational
disability
...51The third track: The Social Renewal
Policy
...52The first circle: Labor, training and
income
...55The second circle: The daily social environment...56
The third circle: The sector of welfare. health. culture and
education
...57Policy measures in other
areas...
...59Education
...59Housing...
...60Health
care
...63Social
services
...6568
O
SUMMARY
This report consolidates the Dutch reports that have been produced within the fra-mework of an observatory established by the Commission
in
1990 to study themea-sures which the Member States are taking to combat social exclusion. The imple-mentation
of
thisinitiative
requires the regular collectionof
information about policies to combat or to prevent social exclusion in each of the Member States and thepresentation of data in a slandardized form. The present report describes the
prelimi-nary work of the observatory, presents some keys to guide the interpretation of the
Dutch welfare state, and discusses both data and policy measures with regard to social exclusion. The most important results of the consolidated report are
summari-zed below.
Recent research on poverty, insecurity of subsistence and relative deprivation in the
Netherlands shawed that for most persons paverty is transitory. Only a very limited amount ofpoverty appeared to be persistent. This result suggests that a specific and
multidimensional poverty
policy
is
feasible,if
it
is
accompaniedby
a broader employment and social security policy. In fact, the Dutch govemment follows these three tracks to reduce social exclusion. The first track is the increase of labor market participation. Income policy and social security constitute the second track. The Social Renewal Policy is the third track.The government acknowledges that the issue of social and economic disadvantage is
a relative matter and may be described by various concepts, such as (new) poverty, social exclusion, insecurity ofsubsistence ormarginalization. However, the govern-ment itself explicitly uses the more general phrase of situations of disadvantage to denote unfavorable positions people may take on various dimensions, such as inco-me, education, health, etc. These situations of (cumulative) disadvantage involve more than financial problems and often lead to (persistent) welfare state
dependen-cy,
whichis
consideredto
be both socially and economically undesirable. TheEconomic growth and an active labor market policy are considered the two main pre-conditions for an increase in labor market participation. An increase in participation
is expected to decrease social disadvantage, because employment provides the
indivi-dual with an adequate income to enable social participation, and creates the financial
basis of the social security system. One of the major developments within the Dutch active labor market policy was the enforcement of the Labor Pravision Law
in
1991,making the social partners responsible for the provision of labor.
According to the government, the social security system has two main functions. One
function is to serve as a safety net.
It
should guarantee an income level covering the essential costs necess:uy to enable the individual to live a life worthy of o human being for individuals who are unable to work and for persons who are allowed not to work,such as the elderly. This also applies to persons who are available for the labor
mar-ket in principle, but do not succeed in finding ajob despite all efforts. The second main function of the social security system is to serve as a trampoline:
it
should contain incentives for people to find and to keep paid employment.Four recent developments should be mentioned in this respect. First, the Adaptation Mechanism Act, linking the minimum wage and social security benefits to the
avera-ge waavera-ge level, was reinstated in January 1991. However, this Act was replaced by the
Adaptation Mechanism Act with Possibilities of Deviations in January 1992"
Becau-se of the unfavorable ratio of economically inactive to economically active income recipients expected
in
1992" adaptation was suspendedin
1992.Secondly, the budgets for Special Assistance, to be used by the municipalities to give financial support to individual households in special circumstances, were raised and
decentralized. Thirdly, the national enforcement of the Youth Employment Guarantee Act, offering work experience and training to unemployed youngsters, took place in January 1992. Fourthly, the govemment made a number or proposals on the reduction of occupational disability in the Reduction of Occupational Disability Bill. Most of
the-se proposals entered into force in March 1992.
The third track of the government's-policy aiming at the reduction of social disad-vantage is the Social Renewal Policy.
A
central element within the Social Renewal Policy is the direct approach of the individual citizen at the local level. For thatpur-pose, responsibilities are being transferred to local authorities and institutions. The
cen-tral government only sets the general framework within which the local authorities can take measures to combat social exclusion according to their own opinions and
TNTRODUCTION
Early in 1990, the commission established an observatory to study the measures which the Member States are taking to combat social exclusion within the framework of the
Resolution of the Council of Ministers on combating social exclusion. The implementa-tion of this initiative requires the regular collection of information about policies to com-bat or to prevent social exclusion in each of the Member States and the presentation of
data in a standardized form.
The present report consolidates the reports that have been produced under the direction
of
the Dutch expert participatingin
the observatory up to this moment (September 1992',t:.l.
A feasibility study (Dirven 1990);2.
The first annual report on policies to combat social exclusion (Dirven andJehoel-Gijsbers 1990);
3.
The updated report on policies to combat social exclusion (Dirven 1992); and4.
A special study on social services (Serail 1992).The structure of the present report is as follows: First of all, Chapter 2 describes the
pre-liminary work of the observatory reported
in
the feasibility study. Chapter 3 presentssome keys to guide the interpretation of the Dutch welfare state. Data on social exclu-sion in the Netherlands are discussed in Chapter 4. Together, these two chapters
2
PRELIMINARY WORK
In each Member State the actual work of the observatory was preceded by a feasibility study (Dirven 1990). The aims of the feasibility study were to examine the following
issues:
1.
The cast of actors engaged in the combat against social exclusion;2.
The political and scientific debates on social exclusion; and3.
The available data.Social exclusion was given a working definition in terms of a generalization or cumula-tion of disadvantages across various life-chances. The definition covered the following
dimensions of disadvantage:
1.
Income and property ownership;2.
Consumption, expenditurc and indebtedness;3.
Educational achievement;4.
Vocationalopportunitiesandqualifications;5.
Employment and working conditions;6.
Housing;7.
Health:8.
Neighborhood networks and associations; and9.
Legal advice and rights.From the feasibility study
it
appeared that most organizations involved in activities to reduce social disadvantage are not directly engaged in a battle against mahipledisad-vantage or social exclusion. Their attention is usually restricted to employment, income and education,
implicitly
assuming these dimensions to be preconditions for a more favorable position on the other dimensions of social exclusion. According to the1.
The central government (including parliament), the political parties and the advisory councils ofthe government;
2.
The local authorities;3.
Employers' organizations and the trade unions;4.
Specific interest groups and the churches.Although
it
appeared that the conceptof
social exclusion is not explicitly usedin
thepolitical debates,
it
wasimplicit
in
the parliamentary rePort on the Social RenewalPolicy (Iweede Kamer 1990). This report paid much attention to those grroups having less than average employment rates, low educational achievements and limited social participation. To some extent the housing and health situation
of
these gloups werediscussed as well. Moreover, the report and the ensuing debates dealt extensively with
the concentration
of
physical and social problemsin
theold
city
districts.
Thecumulation of disadvantages along several dimensions was consistently described in terms of social disadvantage,Therefore, the concept of social disadvantage used in the
report on Social Renewal and the ensuing debate appeared
to
haveto
the samesubstantive meaning as the concept of social exclusion defined above.
In the scientific debates the concept of poveny is used more often than the concePts of
social exclusion, (social) disadvantage or marginalization. In most cases the definition of
poverty is restricted to a lack of income, referring to a disadvantaged situation with
respect to income. However, the concept
of
(social) disadvantage is not necessarily restricted to a lackof
income;it
has a more general meaning than the conceptof
poverty. The concept
of
social
exclusion,defined
as asituation
of
cumulativedisadvantage, is related to notions of multiple and relative deprivation used by various authors, such as Schuyt (1987), Berghman,
Muffels,
De Vries and Vriens (1989)' Muffels and Vriens (1991), Dirven and Berghman (1991), and Muffels, Berghman andDirven (1992). To conclude, the concept of marginalization might be used in a dynamic sense to denote the process leading towards cumulative disadvantage
or
socialexclusion.
An ext€nsive exploration of ttre available data showed that for most dimensions of social exclusion data afe available on a regular basis. However, regular data on the cumulation
of disadvantages along these dimensions are scarce. Besides, the available statistics on
the cumulation
of
disadvantages do not include the complete setof
dimensions.Furthermore, the issue
of
permanency, which would require longitudinal data,is
notaddressed in regular statistics (except for the duration of unemployment).
The
feasibility
study established a major problem inherentin
the available data. Individuals or groups excluded from society in a very severc sense (e.9., the homeless,illegal
immigrants, peoplein
institutions) arelikely
to
be excluded from national statistics as well. The conceptof
social exclusion itself already suggests that socially excluded individuals or groups are verylikely
to be excluded from statistics based onsurvey data and even administrative Sources. AS a consequence, information on severe disadvantage appears only partially in regular statistics. Data on severe disadvantage are
scarce and incidental almost of necessity.
Information on the cumulation of disadvantages in the Netherlands can be obtained from an index developed by the Social and Cultural Planning Office
in
its bi-annual Social and Cultural Report. In this report an indicator of well-being is constructed, based onseveral objective aspects
of life,
such as health, housing, consumption and leisureactivities.
With
this
indicator the Social andCultural
Reportis
ableto give
animpression
of
the conditions oflife
for
various groupsin
the population on several dimensions of well-being simultaneously.Another index in which most dimensions of social exclusion appeared to be covered, is the deprivation index used by Berghman et al. (1989), which included both material and
immaterial items and claimed to give an operationalization
of
(exclusion from) thenational way of life.Ttte deprivation index was developed further by Muffels and Vriens (1991), and used
in
the annual social baromerer of poverty, insecurityof
subsistence and relative deprivation by Dirven and Berghman (1991).A plenary discussion of the feasibility studies carried out in the different Member States
led to the general conclusion that the annual reports of the observatory should focus on
policies conceming social exclusion and the evaluation of these policies. Moreover,
it
was agreed that attention should be rcstricted to the following dimensions:
l.
Income and proPerty ownershiP;2.
Consumption,expenditureandindebtedness;3.
Educational achievement;4.
Employment and working conditions;5.
Housing;6.
Health.In
accordance with the decisions about the workof
the observatory, thefirst
annual report on social exclusionin
the Netherlands (Dirven and Jehoel-Gijsbers 1990) paid extensive attention to Dutch policies concerning social exclusion and the evaluation ofthese policies.
It
focused on sectoral policies, target gtoups, criteria for eligibility and the evaluation of policy effectiveness. Furthermore, attention was paid to the integration of policy measures within the Social Renewal Policy. The report also proposed a set ofindicators to monitor social exclusion and presented statistical data on situations 0f social exclusion.
increasing labor market participation, (2) income policy and the role of social security,
and (3) the Social Renewal Policy.
Chapter 5 of the presents report present these three main tracks
of
the Dutch battle against disadvantage. However, to some extent policies related to social exclusion areimplemented
in
other policy areas as well. Therefore, policy measuresin
the areas ofeducation, housing, health, and social services are dealt with in the remainder of Chapter
5. The subsections on health care and social services contain information from a special study on social services in the Netherlands (Serail 1992).To provide a background for
3
KEYS TO THE INTERPRETATION
OF
THE
DUTCH WELFARE
STATE
To facilitate an interpretation
of
the Dutchfight
against social exclusionwithin
itsEuropean context, this chapter draws up a brief outline of the main characteristics of the
Dutch welfare state. Historically, two main branches have developed within the Dutch welfarr state: the system of income protection and the system of social services.
The main roles
in
the Dutch system of income protection are played by the minimum wage and the minimum income, thosociaal minimum. Benefits provided under thesystem
of
national assistance and the systemof
national insurance take the minimum income level as the point of reference. This implies that the level of the minimum wage'on which the minimum income
is
based,is of
great importancefor
the disposableincome of beneficiaries on the one hand and the proportion of the government budget
and of the national income that is devoted to social Protection on the other hand.
Three determinants appear to be resPonsible
for
the evolutionof
the Dutch social protection syst€m with its heavy emphasis on the minimum wage and the minimumin.o-"
(Berghman 1991). Twoof
these determinants are of a cultural nature, one ofthem is structural.
Fint
of all, a moderate development of wages was considered to beimportant
for
the post-w.u reconstructionof
the Netherlands andfor
guaranteeing dcciptable living conditions by means of the wage system. Secondly,it
was considered nece;sary to provide a wage level meeting the needsof
a family. The fact that the political decision making process in the Netherlands took place in a rather rational way may be considered the third determinant.Because the minimum wage had to meet the needs of a family
it
was established at arclatively high level. This is, by the way, one of the causes of the low level of female participation
in
the labor mafket. The minimum wage level also became the point ofreference of the minimum social security benefits, because the latter also had to meet the
needs
of
afamily.
The intention was that the whole population should be able to participate in the economicThe high level of the minimum wage also explains the high productivity per worker in the Netherlands. However,
it
should be emphasized that the average productivity levelper possible worker, i.e., per person within the active age group, is not very high. The
high level of productivity per worker is considered one of the causes of the high rate
of
occupational disability in the Netherlands.
In recent years, budgetary problems and the central place of the minimum benefit level have played an important role in the evolution of the social protection system. Although
the minimum benefit level for families remained at the level of the net minimum wage, the rates for single persons and single-parent families were decreased during the 1980s.
Moreover, a separatre (lower) rate was introduced for persons sharing the same dwelling. Also, means tests were introduced into the national insurance system, and less generous
benefits were provided to the partially disabled.
overall,
the emphasisof
the social protection system was placed to an increasing degree on minimum protection.At
the same time, the authorities came to the opinion that the operation of the welfare systemhad been too much focussed on indemnification and that
it
should aim more at preventive and reparative action (retraining, reinsertion, etc.).Especially because of the high unemployment rates during the 1980s, the pressure to implement more active policies increased.
A
numberof
measures was proposed to reintegrate unemployed youth, the long-term unemployed and the partially disabled into the labor market. The most important of these measures are discussedin
chapter 4.However, evaluation studies showed that the effectiveness
of
these initiatives wasdoubtful. Moreover, they had to be considered more as large-scale experiments than as structural and stable schemes. The first measure
of
a more general character was theintroduction of the reqrientation interviews
for
the long-term unemployed about threeyears ago. Especially during the last few years! a number
of
important large-scale measures were launched specifically aiming at prevention and reintegration. Theinroduction of the Regional Employment Boards and the Social Renewal policy are
mentioned here as the most important policies. Among the legal initiatives the Youth Employment Guarantee Act and the Job Pools are the most conspicuous.
At
present the problemof
occupational disabilityis
on the topof
the agenda, even higher than the unemployment problem. Because the numberof
persons receiving disability benefits is still extremely high, and because earnings-related disability benefitsare provided until retirement age without any means test, the budget for social protection
has come under severe pressure.
It
is expected that the historyof
the unemployed is repeated with respect to *re disabled, with first policy measures inspired by budgetary problems andonly
later a convincing reorientation from indemnification towards preventive and reintegrative actions.The second branch of the Durch welfare state is constituted by the provision of social
services. The organizational and financial structure of the provision of social services in
the Netherlands has to be understood from the pillarization process which shaped the
social and political structure between 1900 and 1960. The pillarization process produced
four main pillars: the roman catholic pillar, the protestant pillar, the socialist pillar and
the liberal pillar. Social and political organizations such as the trade unions, employers' organizations, political parties and primary schools developed within the socio-cultural
boundaries of these pillars. And so did the provision of social services.
During the period of pillarization, the political parties agreed upon a govemment policy
to
grant autonomyto
organizationsproviding social
services. The taskof
thegovernment was to
fill
in the gaps that were not closed by private organizations. Even in the periodfollowing
the second world war, when the provisionof
social servicesbecame more strongly dependent upon public financing, the organizations' autonomy
with respect to policy making was not called into question. As a consequence
of
thepillarization process a mosaic of numerous social services developed without any co-operation between similar organizations from different pillars.
The impact of pillarization on Dutch society slowly decreased from about 1960. Co-operation between organizations became more common and sometimes organizations
from
differentpillars
mergedinto
one. The social services sector expanded, as a consoquence of high economic gfowth rates and social and political consensus on the need for adequate social protection for all citizens. The result was a wide range of high level social provisions covering the whole population. New problems were tackled by organizations that were not linked to anyof
the pillars.Still,
however, many socialservices organizations exist that used to be connected t<l one of the main pillars.
During the 1980s, budgetary problems
of
the Durch government raised the questionwhether
public funding
of
the social services should be continued and whethergovernment priorities should be re-examined. The Welfare Act
of
1988 circumscribed the responsibilities of the national, provincial and local authorities with respect to anumber ofsocial services. Public funding oflocal organizations was transfered from the
national to the local authorities. Although this made up for cutbacks at the national level,
it is expected that the financial limits of the local authorities
will
be reached in the nearfuture. Any attempts to r€structure the provision of social services in order to increase
efficiency, e.g., by means of co-operation and merging, have largely been unsuccessful due to ideological differences stemming from the pillarization period'
Ar present, the financing of the social services is
in
a process of restructuring.It
is thegovernment's intention to substitute the existing structure by a compulsory insurance scheme covering the whole area
of
social and health care services. The new schemeshould entitle the whole population to a basic amount of social services. However, a
major difference of opinion exists between the coalition parties about which services to
be included in the new scheme.
To summarize the development
of
the Dutch welfare stat€, the period between about1960 and the early 1970s may be described in terms
of
the institutional welfare model.According to this model, citizens are objects of policy action, incapable of meeting their needs and not
knowing
whatis
goodfor
them. The state, on the other hand, is characterized by a patriarchal type of government, taking over responsibilities from its citizens and institutionalizing social protection (Muffels 1990).The oil crisis in the early 1970s marked the start of an economic recession period with high unemployment and disability rates. The burden of high social security contributions and taxes was alleviated by severe retrenchment policies, especially with respect to the
social welfare sector. Cash benefits were subjected to strong cutbacks
in
expenditure,but the social services
in
particular. These cutbacks resultedin
a withdrawalof
government action
in
the fieldof
the provision of social services. This went together with an increase in informal and voluntary work and, therefore, marked a shift of social welfare policy towards the informalwelfare model.Due to economic recovery, the
late
1980s saw ashift
from the dominating roleof
economic policy in favor of social welfare policies. The center-left coalition government of christian-democrats and social-democrats provided a basis for a new socio-economic
policy
in
reaction to the increaseof
social exclusion during the 1980s: the SocialRenewal Policy. This policy is shaped according to the inclusive welfare model, which is
based on the idea
of
the intervention state imposing conditions on and offeringopportunities to individuals who are responsible to do their best to meet their own social
needs.
4
DATA
ON
SOCIAL EXCLUSION
IN
THE NETHERLANDS
One contribution of the first annual report (Dirven and Jehoel-Gijsbers 1990) was the
identification
of
a setof
indicators to monitor patt€rns of disadvantage. This chapt€rprcsents data on a number of indicators used in Durch statistics and social reseiuch, to provide a background for the policy measures discussed in Chapter 5. Because of the European Commission's intentions to reiterat€ the observatory on social exclusion once a year, our main focus was on regular statistical and administrative data. On some occasions references are made
to
incidental
researchfindings
on situationsof
disadvantage and exclusion.
As was argued in the preceding chapter, social exclusion is a multi-dimensional concept.
It was defined in terms of a cumulation of disadvantages along several dimensions, such as:
1.
Income and proPertY ownershiP;2.
Consumption,expenditureandindebtedness;3.
Educational achievemenq4.
Employment and working conditions;5.
Housing; and6.
Health.First, the following sections present data on indicators for each dimension
of
socialexclusion separately. Secondly, some measures
of
cumulative disadvantage arediscussed. Finally, the issue of persistent poverty is briefly addressed and some policy implications are drawn.
4.1 Uni-dimensional disadvantage
4.1.1
Income and property ownershipA first impression of the amount of disadvantage with respect to income can be derived from a measure of income inequal.ity, such as the Gini-coefficient. Using this coefficient, Table 4.1 shows that the overall distribution of disposable household income
in
theNetherlands is more equal than
in
France, Spain, the United Kingdom and WestGermany,
but
somewhat less equal comparedto
Belgium
and Denmark. TheNetherlands appear to be rather egalitarian with respect to the distribution of income. However, the income share of the poorest l}Vo-group in the Netherlands (2.4Vo
in
1985)is smaller only in France Q.ZVo
in
1984), suggesting a relatively unfavorable position oflow income households.
Table 4.1: The distribution of disposable household income in deciles.
NL
1985
B
1985
DKFE
1984
1984
1986UKD
l98s
1983first l07a-group
second lO7o-gfoup
third lO7o-group
fourth l07o-group
fifth
l07o-group sixth lO7o-group seventh l0%o-groupeighth l07o-group ninth 107o-group
tenth l07o-group
GINI.
33
354.9
4.76.0
5.97.2
7.18.5
8.4.9.8
10.2rl.2
11.9r2.9
13.715"1
15.91zt.t
18.72.7
2.83.8
4.35.0
5.56.3
6.77
.9
8.19.5
9.5ll.l
ll.l
13.1
13.016.0
15.724.6
23.40.34
0.32 2.4 5.1 6.4t.)
u.) 9.6 10.9 12.6 14.9 2r.9 0.28 22 +.+ 5.3 6.5 7.8 9.0 10.5 12.3 5.2 26.8 0.34 2.7 4.3 5;7 6.8 8.0. 9.2 10.6 12.4 15.6 24;l 0.32 0.2'l 0.27'
The GlNl-coefficient is a measur€ of income inequality.Source:SCP (1990)
Whereas Table 4.1 presents information about the distribution
of
household incomeacross the population as a whole,
it
does not address the issue of income poverty. Forthat purpose the Department of Social Security Studies, the Department of Econometrics and
IVA,
Institute for Social Research, at Tilburg University have developed a social barometer of poverty, using a number of definitions of poverty (Muffels, Kapteyn andBerghman 1990, Dirven and Berghman
l99l).
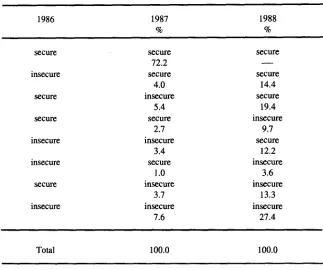
At present the barometer is available for1984, 1985, 1986, 1987 and 1988. It gives insight into the distribution ofpoverty among different social categories and into the development of
is
distribution over time. [image:20.404.47.369.220.417.2]The social barometer approach includes both political and (inter-)subjective poverty lines. Among the first are the legal poverty line and the EC poverty line. The level of the
legal poverty line is set by politicians.
It
represents the minimum amount of incomepoliticians consider to be necessary
for
peopleto live
in
securityof
subsistence'Although no official poverty line exists in the Netherlands, the national assistance levels might be considered as such.
The EC poverty line (O'Higgins and Jenkins 1988) is based on the notion of equivalent disposable household income. Equivalent income refers
to
income adjustedfor
differences in needs because of differences
in
household composition. The EC poverty line is usually ret at 50Vo of the average equivalent disposable household income.(Inter-)subjective poverty lines are based on the social, instead
of
thepolitical,
consensus on the minimum income households need to live
in
security of subsistence.Three subjective methods are cornmonly used: The Subjective Poverty Line (SPL)' the
Leyden
plverty
Line (LPL) and the methodof
the Belgian Centerfor
Social Policy (CSP).All
three methods assume that people themselves ale best aware of the needsof
their own household.
The SPL is based on a survey question called the minimum income question, asking for the minimum income households need to make ends meet.
It
can be shown that thereexists an income level such that
for all
incomes below this level actual household income is lower than the household's minimum income, while for all incomes above this income level actual household income is higher than the household's minimum income' ThecsP
method, developed by the centerfor
social Policyin
Belgium (Deleeck' Berghman etal.
1980), is simitar to the sPL methodin
being based on the minimum income question. For those respondents answering that they have difficulties to makeends meet, the smaller amount of their minimum income and their actual income is used for the calculation of the poverty line. The average of these amounts is considered to be
the (inter)subjective poverty line'
The LPL is based on the income evaluation question asking people to give the income level they consider to be very bad, bad, insfficient, sfficient, good and very good. The
answers enable the estimation of each respondent's welfare function of income. Since
poverty is a state
of
low utility, a household is considered to be poorif
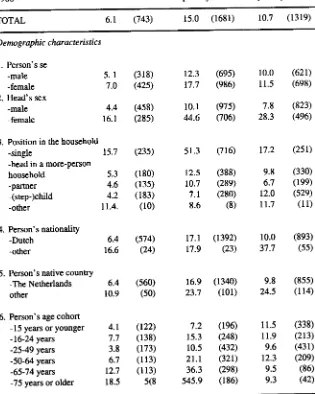
its income is below a certain predetermined welfare level.The Dutch social barometer
for
1988 in Table 4.2.It
shows that 6.17o of the populationlived
below the legal povertyline
and l57o below the Subjective Poverty Line.Lrespective ofthe subsistence definition used, persons (in households with a head) of75
y.".i
ot older, persons living in households with a head in the 16-24 age cohort, personsilning in
femaie-headed households, single persons, widow(er)s, the self-employed'p.rro=n, and households dependent on an unemployment or social assistance benefit, and
households dependent on a student grant appearcd to have the highest probabilities
of
living in insecurity of subsistence.
Table 4.2:
The 1988 social barometer; persons below the legal poverty line, persons below the Subjective Poverty Line, and persons below the subjective deprivation poverty line (SDL) ; (weishted) proportions (absolute numbers).
Income poverty line
1988
legal Subjective poverty line
SDL poverty Line
TOTAL 6.1 (743)
15.0
(1681)10.7
(1319)D e mo g r aphic char ac te ristic s
l.
Person's se-male
5.I
-female
7.02. Head's sex
-male
4.4-female
16.l 3. Position in the household-single
15.7-head in a more-person
household
5'3-partner
4.6-(step)child
4'2-other
11.4.4. Person's nationality -Durch
-other
5. Person's native countrY -The Netherlands other
6.4
16.6
6. Person's age cohort
-15 years or
younger
4.1-16-24
yearc
7.7-2549
years
3.8-50-64
years
6.7-65-74
years
12.7-75 vears or
older
18.5(318) (42s) (458) (285) (235) (180) (135) (183) (10) (s74) (24) (560) (50) (r22) (138)
(r73)
(l l3)
(1 13)
5(8
r2.3
(69s)r7.7
(986)10.1
(97s)44.6
(706)s1.3
Qr6)rz.s
(388)10.7
(289)7.r
(280)8.6
(8)L7.r
(1392)r7.e
Q3)16.9
(1340)23.7
(101)7.2
(196)15.3
Q48)10.5
(432)zr.L
(32r)36.3
Qe8)54s.9
(186)r7.2
(zsr)
9.8
(330)6.7
(l9e)
r2.o
(s29)rr.7
(11)lo.o
(893)37.7
(55)9.8
(855)24.s
(ll4)
1l.s
(338)I1.9
(2r3)
9.6
(431)r2.3
(209)e.5
(86)e.3
(42) [image:23.405.42.357.122.516.2]lncome poverty line r988
Iegal Subjective poverty line
SDL
7. Head's age cohort
- 76-24
yeus
18.2- 25-49
years
4.0 - 50-64years
5.7- 65-74
years
11.7- 75 years or
older
17. 8. Head's marital status- maried
- divorced
- widow(er)
- unmarried
-0
a
-2
-3
- 4 or more
Labo r marke t charac te r is ti c s I 1. Person's educational level
- primary education
- secondary: first stage
- secondary: second stage
- non-university higher education
- university
43.0
(183)8.7
(632)15.9
(343)33.9
(324)45.4
(199)8.
(718)35.6
(23r)
46.0
(335)2e.9
(397)s1.3
(716)rr.7
(77)18.6
(343)5.2
(346)27.0
(re8)2e.3
(rr37)
13.r
(247)s.s
(191)5.8
(87)3.8
(18)12.0
(51)r0.s
(821)12.6
(313)8.8
(e3)8.3
(42)7
(6e4)s0.8
(344)16.5
(141)10.1
(140)1't.2
(2sr)
6.r
(43)s.4
(108)7.8
(563)4r.4
(355)e.6
{3e7)t2.8
(266)8.1
(306)rr.9
(203)26.2
(148)rs.4
(868)9.9
(222)5.8
(r74)
3.9
12.9
t5.2
I 1.1
9.9 5.5 2.4 4.2 9.5 7.0 5.4 6.3 2.9 4.1 (84) (31r) (138) (r24) (87) (367) (e0) (r2e)
(ls7)
Q3s) (41) (140) Q0e)(l 19)
(4r6)
(r12)
(e2) (6e) (54)
9. Type of household
- one-person household 15.7
- non-family
household
5.9 - couple withoutchildren
6.9 - couple withchildren
2.9-one-par€nthousehold 13.8
10. Number of children livine
in the household
(3ee)
(r2r)
(186)
4.r
(35)2.4
(7)16.3
(852)16.0
(331)r4.4
(392)9.2
(73)7.7
(20)Q5)
(l
1)lncome poverty line
1988
legal
Subjective
SDL povertyline
poverty Line12. Head's educational level
- primary education - secondary: first stage
- secondary: second stage
- non-university higher education
- university
13. Person's socio-economic group
12.2 5.1 5.4 2.6 2.5 19.3 1.3 1.0 1.5
18.
l
13.7 5.3 16.5 (305)
(r22)
(260) (37) (16) (53)(l)
(11 (46) (31) (206) (18) (23)(2r5)
(141)(r20)
(2) (18) (7r (60) (227) (4s) (48) (146) (6)(r7)
(2r)
(10) (16) (7) (2e) (e)27.4
(620)15.9
(3s4)r2.s
(558)28.1
(706)10.8
(2s2)5.7
(276)7.0 (96)
3.0
(42)4.8 (28)
2.r
(14)-other without employment 8.9
-unknown 4.4
t4. Head's socio-economic group
-self-employed 20.r -managing
director
.9-civil
servant-employee - unemployed -retired -disabled
-social
assistance
17.- other without employment 27.1 - unknown 19.9
15. Person'5 socio-economic class
-service
class
1.2-routine
nonmanual
1.7- petty
bourgeoisie
24.3- farmers 22.7
-skilled
worters
1.0-non-skilled
workers
3.2-farm
workers
10.7-self-employed -managing director
-civil
servant-employee -unemployed -retired -disabled - social assistance
18.3
(37)r.4
(l)
)3.4
(33)5.8
(166)47.3
Q6)37.s
(514)37.0
(l
19)sz.r
(67)18.3
(408)8.8
(26r)16.6
Q2)r.0
(2)2.0
w)
)s.2
(2s7)49.r
(109)34.6
(s7e)32]
(209)48.0
(r2r)
56.3
(281)30.2
(4)5.1
(17)r.2
(l)
3.7
(3e)6.e
(2r3)
29.6
(s2)e.3
(140)29.8
(102)67.s
(9r1r2.r
(288)rr.7
(377)5.3
(38)2.2
(4)3.0
(76)6.s
(337)40
.(ee)8.0
(149)35.5
(249)75.2
(201)29.6
(r57)24.
2(9)2.6
(37)5.1
(63)3.e
(2)8.e
(7)7.1
(53)11.0
(r03)e.5
(8),7 1.3 25.2 t2.3 6 2.8
).)
12.6 31.0 2.8 r0.7 r7.6 (36 (63) (4) (14)(le)
(e0)(l
l)
Income poverty line
1988
legal poverty line
Subjective poverty Line
SDL
16. Head's socio-economic class
- service class
- routine nonmanual
- petty bourgeoisie - farmers - skilled workers
- non-skilled workers
- farm worters
17. Number of employed persons
in the household
-01
-l
a - 3 or more
Income characte ri sti cs 18. Number of income sources
in the household
-l
-2
-J
A
- 5 or more
19. Number of income recipients in the household
-l
-2
- 3 or more
20. Main source of income in the household
- labor income
- pension
- unemployment benefit
- sickness or disability payment
-
social assistance - studentgnnt
.e
(32)r.7
(24)31.8
(33)r9.4
(4s)l.r
(2r)
2.s
(36)s.4
(8)7.6
(463)2.9
(r42)
r.7
(s7)5.8
(81)3.7
(41)7.s
(337)4.3
(r97)
3.8
(60)4.7
(23\2.0
(63)s.4
(72)16.0
(r2)
18.0
(283.3
(60)9.4
(r24)r4.r
(18)46.0 (1139)
6.8
(315)2.0
(58)r4.7
(169)r5.0
(149)15.3
(628)r3.9
(582)rs.4
Q2s)20.7
(e6)2.3
Q7) 5.r
(72)4.e
o)
r0.$
(27)4.7
(86)ll.8
(168)8.7
(13)23.4 (609)
9.0 (44r)
3.5
(rr4)
10.5
(l5s)
s.2
(sl)
7.8
(32s)8.4
(363)20.s
(302)47.1 (208)
8.1
(552)2.6
(l16)
8.r
(76)2.2
(193)ll.8
(223)22.e
(78)7.2
(4s)18.6
(47)3e.e
(72)22.3
(r4r8)
6.1
(255)r.2
(8)4.8
(394)3s.7
(626)54.5
(179)38.1
(22s)47.7
(l14)77.5
(136)12.7 (810)
7.8
(326) 10.7 (183)5.9
(488)10.2 (184)
45.5
(147)36.6
(2rt)
78.5 (189)
15.6
Qs)Income poverty line
1988
legal proverty line
Subjective proverty Iine
SDL 21. Head's property income
- no property income
-Dfl.>0-<500
- Dfl. >= 500 - < 1000
- Dfl. >= 1000 - < 5000
- >= Dfl. 5000
Housing characte ristic s 22. Housing situation
- rented house - subtenancy
- owner occupied house - free house
23. Degree of urbanization
- Rural municipalities
- Urbanized rural municipalities
- Typical dormitory municipalities
- Towns < 30,000 - 30,000 - 100,000 - > 100,000
24. Region
- Norttr: Groningen, Friesland, Drcnte
- East: Overijssel, Gelderland, Utrecht, Flevoland
- West: Noord-Holland, Zuid-Holland
-Ztid:Tneland,
Noord-Brabant, Limburg
6.7
(565)4.2
(74)4.0
(26)4.7
(52)7.s
(26)7.6 5.1 3.9 4.3 6.0 8.4
7.8
(4s7)20.r
(ll)
4.r
(255)20.7
(19)r7.9(1032)
19.8
(1r)4.2
(267)10.8
(10)7.7
(rrr)
10.0 (294)
7.0
(120)9.6 (r29)
10.3 (203)
16.r
(462)(l0e) (r47) (66) (se)
(l2l)
(240)r7.0 (1300)
t3.4
(22r)7.7
(48)8.3
(86)e.0
(26)23.0
(rzsr)
72.t
(40)6.3
(358)43.2
(32)r2.4
(151)r2.7
(334)9.7
(r52)13.1
(165)16.l
(303)2r.6
(s77)14.3
(l
183)5.0
(87)3.0
(20)r.4
(16)2.8
(9)6.2 6.0 6.6 5.3 (84)
(le8)
(300)(l6l)
17.8
(214)16.4
(488)14.3
(606)l3.l
(372)l3.l
(167)r0.3
(334)rr.4
(szs)9.3
(293)Source: Dirven and Berghman (1991)
The number of consumer durables can be used as an indicator of property ownership. Information on the possession of consumer durables is presented in Table 4.3. This table
shows that poor people have fewer consumer durables, and more often buy these durables second hand.
Table
4.3:
Average number of durables by income-groups; average rurmberof
durables bought second hand; average Vo of durables planned to buy in the near future;average age ofdurables, 1985, 1986.
Income
Average Average Average
Averageas %
of
numberof
9obought
%of
ageof
poverty
line
9durables
secondhand
durables
durables ofbuying
notowning,
in yearsbut plans
1985
1986
1985
1986
1985
1986
1985 1986Total
7.2
7.3 l8.l l8.r 8.2 7.3 7.r
7.0*
less or equallxlegalnorm
6.0 6.1
27.5
21.4 5.5 6.3 7.4
8.7*
l-1.25xlegal
norm
6.5 6.5
20.6
21.9 5.5 4.3 7.6
7.4*
1.25-2xlegal
norm
'1.5
7.4
l?.8
11.9 8.6 7.6 7.0
7.0 * 2-3xlegal
norm
7.6 7.7
15.6
16.1 10.0 8.7 6.8
6.8* more than 3x
legal
norm
7.8 7.9
I1.3
I1.8 10.2 9.0 6.7
6.7* less or equal
1x SPL
*
l-1.25xSPL
*
1.25-2xSPL * 2-3x
SPL
* more than 3x SPL
5.9
6.1
23.9
23.6 4.4 4.8
7.8
7.87.0
7.r
20.6
20.4 8.0 6.1
7.3
6.97.5
7.6
r7.3
16.5 8.8 8.8
7.0
7.07.8
7.8
r4.r
15.0 8.9 9.2
6.8
6.87
.9 8.1
I1.0
l1.5
l l.r 6.9
6.7
6.7Source:Muffels, Kapteyn and Berghman (1990)
4.1.2
Consumption,exp€nditureandindebtednessThe number of consumer durables in the household can also be used as an indicator
of
consumption and expenditure. Muffels, Kapteyn and Berghman (1990) present some
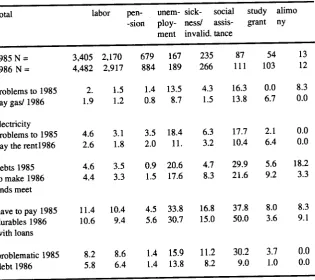
information about the distribution of deb* in the Netherlands. As Table 4.4 shows. 1.9%
of the households in 1986 had problems paying the gas and electricity bill, and 2.6Vo had problems paying the rent. Having debts
in
order to make ends meet occurred among4.4Eo
of
the households,while
10.67o used consumer credit to payfor
durables.A
problematic debt situation, defined as having to pay interest on a loan and having problems paying the gas or elecricity bill and/or having problems paying the rent and/or
-haning
probie-s to make ends meet and/or paying durables with consumer credit, was
[image:29.404.43.359.193.473.2]founO
in
5.8% of the households. Muffels etal'
also show that householdsliving
on unemployment or social assistance benefits, and households defined as poor according to the le;al poverty line and the Subjective Poverty Line clearly ran the highest risksof
being in a situation of indebtedness.Table 4.4: Percentage ofhouseholds having certain payment problems, by main source ofincome,1985.
Total
labor
pen--sionunem-
sick-
socialploy- nesV
assis-ment
invalid. tancestudy
alimogrant
ny1985 N =
1986 N = problems to 1985
pay gas/ 1986
electricity problems to 1985
pay the rentl986 debs 1985 to make 1986 ends meet have to pay 1985
durables 1986
with loans
problematic 1985
debt 1986
3,405
2,1704,482
2,9172.
1.51.9
1.24.6
3.12.6
1.84.6
3.54.4
3.3ll.4
10.410.6
9.48.6 6.4
679 167
235884 189
2661.4
13.5
4.30.8 8.7
1.53.5 18.4
6.32.0 11.
3.20.9
20.6
4.71.5
17.6
8.34.5
33.8
16.85.6
30.7
15.0r.4
15.9
ll.2
r.4 13.8
8.287
54lll
103r3 t2
16.3
0.0
8.313.8
6.7
0.0t7.7 2.1
0.0r0.4 6.4
0.029.9
5.6
r8.22r.6 9.2
3.337.8
8.050.0
3.6 8.39.r
8.2 5.8
30.2
3.7
0.09.0 1.0
0.0Source: Muffels, Kapteyn and Berghman (1990)
4.1.3
EducationalachievementEducational disadvantage may be indicated by the level ofeducational achievement, the
propot'tion of school drop-outs, irregular attendance or non-attendance and illiteracy. On
average, educational achievement among ethnic minority group children appears to be
lower than those among Dutch children.
A
study by Van Langen and Jungbluth (1990) showed that this hadto
be attributed to the lower socio-economic statusof
thesechildren's parents, not to their ethnicity. Children from ethnic minority groups do not differ from Dutch children in terms of educational achievement,
if
differences in socio-economic origin are controlled for.A
cross-national comparisonof
the educational achievementof
the populationin
a number of countries showed that,in
1987, 48Va of all Dutch men and 60Vo of all Dutch women had an educational level below the second stage of secondary education. The corresponding figures for Belgium, Italy and spain appeared to be higher, whereas theywere lower in Japan, the United States, West Germany, Sweden and Switzerland. Every year the Ministry of Social
Affain
and Employment publishes the Schoolleavers Letter (Ministerie van sociale Zaken en werkgelegenheid 1988), based upon data from different sources. Among other things, this report addressed the problemof
school drop-aats: According to the Schoolleavers I-etter 29,382 (29.7vo) pupils in junior vocational training or secondary general educationleft
school without any diplomain
full-timeeducation
in
1985.It
is clear that this group has a severe disadvantage both along theeducational and along the employment dimension of social exclusion, since having no
diploma reduces labor market probabilities dramatically (Meesters and Huson 1990).
Neve (1989) showed that the number of drop-outs
in
the Schoolleaverslrtter
is too high: Almost half the number of drop-outs continued to follow a part-time education. she proposed to redefine the concept of drop-outs as those pupils leaving secondary education @oth full-time and part-time) without a diploma. Her estimate of the numberof
'real'
drop-outs from full-timejunior
vocational training and secondary general educationin
1985/1986 was 13,415. The number of drop-outs from part-time educationis unknown, however. Neve's concept of drop-outs also did not include pupils which leave the educational system after completing primary or special education (about
10,000 pupils each year). Individual characteristics that are likely to increase the risk
of
dropping out from education are: Being bom
in
a lower social class, being agirl
andbelonging to an ethnic minority group.
Another cause
of
reduced educational achievementis
irregular attendance or non-attendance at school, in spite of compulsory education. The first phenomenon is called relative non-attendance or truancy, the second is called absolute non-attendance. There are no regularly published statistics about non-attendance, but Devries (l9gg)
presented some estimates. About .5 to l.UEo of all schoolable children was not registered
as a pupil. This was most common
in
the larger cities and among immigrants. About l57oof
the registered pupils was absent once in a while without permission. The time lost by truancy was about l.5Vo of the total time spent at school by all pupils'The issue of illiteracy is clearly related to the educational dimension of social exclusion, since
it
is not hard to imagine the consequencesof
not being able to read and write properly for one's position on the other dimensions. There is no definite estimate of the number of illiterate persons in the Netherlands. Estimates ran from L to 87o of the adult population - in absolute numbers 100,000 to 800,000 - depending on the definition ofillit
tu.y
(there is no consensus about this). The estimated percentages of illiteracy (in their own language) among Turks and Moroccans living in The Netherlands were much higher: 23.5 and 58.57o, respectively (Nationale Stuurgroep Internationaal Jaar van de Alfabetisering 1990).4.1.4
Employment and Working ConditionsIn the Netherlands there has been a lot ofdiscussion on the definition of unemployment.
At
the moment three definitionsof
unemployment are being used(cf.
Section 4'1)' According to the official unemployment definition, based on the number of registeredunemployed, the official number
of
unemployedin
1991 is estimated to be 315'000. However, the estimateof
the total numberof
unemployed persons registered at theLabor Exchange offices
in l99l
is 605,000, and the numberof
unemployed persons looking for ajob, based on the defrnition of the International Labor Office and used bythe Central Planning Office, is estimated to be 485'000'
Another indicator not addressed in the discussions on the definition of unemployment is the amount of hidden unemployment In the 1987 Labor Market Reporr (Ministerie van
sociale zaken en werkgelegenheid 198?) the hidden unemployed were defined as
.unemployed people wanting to have a paid
job of
less than 20 hours a week andunemployed people, not registered at a Labor Exchange office, looking for a job of 20 hours or more a week.'
An
(under)estimation of the amount of hidden unemploymentcan thus be made by subtracting the official unemployment figure from the
llO-figure'
For
l99l
the estimated number of hidden unemployed would therefore be 485'000 -315,000=
170,000.It
is very likely that this is an underestimated figure because theremay be people wanting a job without taking action. One of the reasons for this could be the existence of a discouragement effect.
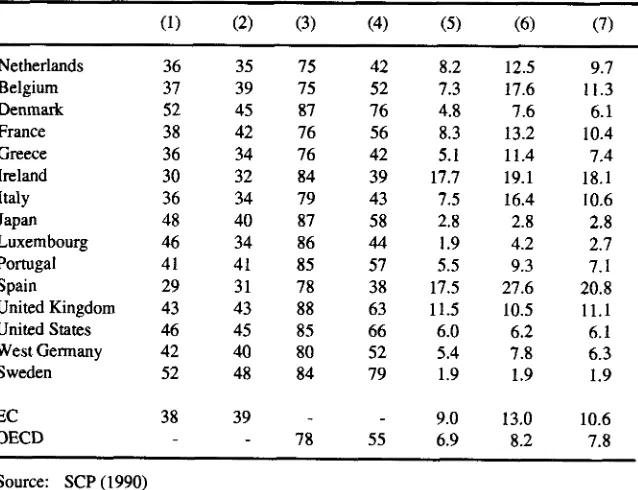
some cross-national data on (un)employment are presented
in
Table 4.5. The labor marketparticipationof Dutch men(757o in 1987)issomewhatbelowtheOECDaverage(787o), whercas the participation of Dutch women (42Vo) is far below the avetage (55Vo).
Unemployment
in
the Netherlands (9.7Voin
1987) is below the average rate in the EC (to.os6), uut clearly above theoECD
average (7.87o). The proportion of long-termunemployment (12 months) in the Netherlands is quite luge (53.27o
in
1987) comparedto other OECD counties. Generally, exit probabilities from unemployment decrease
with duration
of
unemployment from 68%(<
I
year unemployed) to 26Vo|
4 yearsunemployed). Unemployed with primary education only and unemployed
with
the Moroccan nationality have very low exit probabilities (387o).Table 4.5: Employment, labor market participation and unemployment, seyeral
countries, 1987. Column:
(1)
employment(proportion of total population),
(2)proportion ofwomcn in the hborforce, (3) labor market participation oftnen, (4) idem
for
women, (5) unemployment among men, (6) idemfor women, (7)ntal
unemployment.(7) (6) (5) (4) (3) Q)
(l)
Netherlands Belgium Denmark France Greece Ireland Italy Japan Luxembourg Portugal SpainUnited Kingdom United States
WestGermany Sweden EC OECD 36 JI 52 38 36 30 36 48 46
4l
29 43 46 42 52 38 35 39 45 42 34 32 34 40 34 4T 3r 43 45 40 48 39 42 52 76 56 42 39 43 58 44 57 38 63 66 52 79))
8.2 4.8 8.3 5.1 17.7 7.5 2.8 1.9).)
17.5 I1.5 6.0 5.4 1.9 9.0 6.9 75 75 87 76 76 84 79 87 86 85 78 88 85 80 84r2.s
9.717
.6
I 1.37.6
6.113.2
10.4tt.4
7.4l9.l
18.1t6.4
10.62.8
2.84.2
2.79.3
7.127.6
20.810.5
Ir.l
6.2
6.r7.8
6.31.9
1.913.0
10.68.2
7.878
Source: SCP (1990)
Empirical evidence onworking conditions is collected by the NCBS within the
framework of the Quality of Life Surttev (NCBS 1987). In 1986, more than a quarter
of
the working respondents in sample claimed to do physically hard work (26Vo), dirty
work(27vo), or claimed to work at a rapid
r
itg (50%). Related to working conditions isthe problem of incapacity for work. At prcsent this is a very important social and
political issue in the Netherlands. In 1991, the number of disabled persons was about
910,000 persons and outnumbered the number of unemployed persons to a very large
extent.
[image:32.403.46.365.174.419.2]4.1.5 Housing
Regular statistics about the number of homeless people in the Netherlands do not exist. The most recent estimate by the research department of the Association of Dutch Municipalities (VNG/SGBO 1990) estimated the number of homeless people (living in a reception center or boarding house, or just wandering about) between 17,500 and 24,200. About 8,000 to I 1,000 resided in the four largest municipalities (Amsterdam,
Rotterdam, The Hague and Utrecht); the remainder lived in smaller municipalities. The rcport also mentioned the phenomenon of the new homeless: There appeared to be an
increase of homeless people with psychiatric and/or drug problems and younger people without a home. Sleeping outside appeared to be very uncommon.
According to information about the owner/rental status of the housing stock the
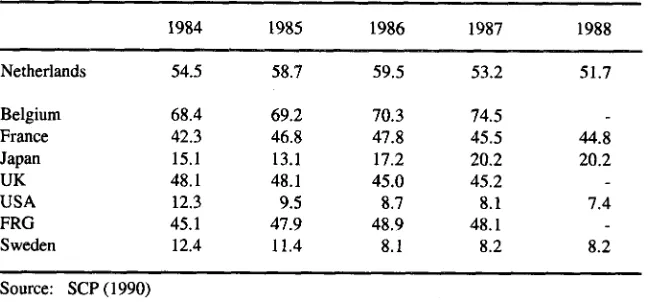
proportion of rented houses in the Netherlands in the mid 1980s was 57%.The proportion of housing expenses in the private consumption of family households in the
Netherlands was lg%o
in
1986. Compared to other countries this was a relatively small proportion. ln Sweden and Denmark, for example, the proportion was about 257o (cf. Table 4.6).Table 4,6:Gross housing expenditure ratio (the proportion ofhousing expenses in the
private consumption
offamilt
households) in a number of European countries, 1986. gross housingexoenditure ratioa
Netherlands
Belgium Denmark
France
United Kingdom WestGermany
Sweden
a
The share of housing expenditure in the private consumption of households.Source: SCP (1990)
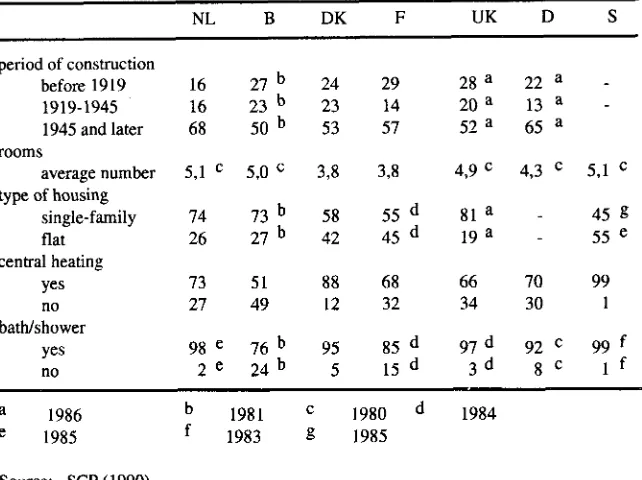
Quatity characteristics
of
the housing situation show that 68Voof
the Dutch housing stock was built after the second world war. Moreover, 73% has central heating and9S%oa bath or shower. In Belgium these figures are relatively unfavorable: Only 50% of the houses was built after the war, 5lVo hts central heating and76% a bath or shower (cf. Table
4.1.
t9
l8
25
t9
20
2l
26
[image:33.404.36.360.290.421.2]Table 4.7: Housing-stock fiy quality characteristics
in
a number of Eutopeancountri e s, I 988 ( pe rcentages ).
D
UK
NL DK
period of construction before
l9l9
1919-1945
1945 and later rooms
average number type of housing
single-family flat
cenral heating yes no
bath/shower
yes
no
L6
27b
16
23b
68
50b
5,1
c
5,0 c74 Tb
26
27b
73
5127
499ge
2e
2ga
22
a20L
13
a52a
65
a4,9c
43
c8la
lga
66
7034
3024 23 53 29 14 57 3,8
55d
45d
68 3285d
15d
5,1 c
45c
55e
99I
3,876b
24b
584)
88l2
95)
g7d gZc
ggt
3d
8c
1f
a e b
f
1986 1985198
l
r983r980
1985
1984 o
Source: SCP (1990)
4.1.6 Healttl
Compared to Belgium, France, the United Kingdom and West Germary,
ltft
expectcrncyat birth in the Netherlands was somewhat higher: 76.8 years
in
1987. However,it
waslower compared Sweden and Switzerland (cf. Table 4.8). Compared to other countries, infant nortality has an average value in the Nethedands.
In
1986,it
was 7.8 (per 1000births), compared to 16.l in Belgium, and 10.6 in ltaly. In Finland and in Sweden infant mortality was 5.9 (per 1000 births) (cf. Table 4.9).
[image:34.403.46.367.78.318.2]Table 4.8: Life expectancy at birth in seven European countries by sex
total
year
of
observation
Netherlands
Belgium
France
United Kingdom
West Germany
Sweden Switzedand 76.8 74.3 75.9 75.3 75.8 77.1 77.6 73.5 70.9 7 1.8
n^a
I L.+
'72.2 74.0 74.0 80.1 77.7 80.0 78.1 ?8.9 80.2 81.0 (1987) (re86) (1e86) (1e87) (1987) (1986) (1987)
Source: SCP (1990)
Tabk 4.9: Infant monalit.v per 1000 babies born alive (Colurnn
I),
and babies with abirth-weight of at least 25(N grams (Column 2) in a number of countries (percentages).
(2) (1) Netherlands Belgium Denmark Finland France Italy Norway Austria Spain
United Kingdom
West Germany
Sweden Switzerland '1.8
t6.l
8.4 5.9 8.0 10.6 7.9 9.8 9.9 9.r 8.3 5.9 6.9 96.0 94.6 94.0 96.0 94.8 93.3 95.5 94.r 97.0 93.3 94.3 95.2 94.6 (1986) (1e86) (1e86) (1e86) (1e86) (re85) (1e86) (re87) (1e84) (1e87) (1987) (1986) (1987)Source: SCP (1990)
[image:35.403.38.360.284.475.2]