This is a repository copy of Exports, Outward FDI and Technology Upgrading: Firm Level Evidence from India.
White Rose Research Online URL for this paper: http://eprints.whiterose.ac.uk/94379/
Version: Accepted Version
Article:
Lancheros, S (2016) Exports, Outward FDI and Technology Upgrading: Firm Level Evidence from India. Journal of Development Studies, 52 (10). pp. 1415-1430. ISSN 0022-0388
https://doi.org/10.1080/00220388.2016.1139697
© 2016 Taylor & Francis. This is an Accepted Manuscript of an article published by Taylor & Francis in the Journal of Development Studies on 28 April 2016, available online: http://www.tandfonline.com/10.1080/00220388.2016.1139697.Uploaded in accordance with the publisher's self-archiving policy.
eprints@whiterose.ac.uk https://eprints.whiterose.ac.uk/ Reuse
Items deposited in White Rose Research Online are protected by copyright, with all rights reserved unless indicated otherwise. They may be downloaded and/or printed for private study, or other acts as permitted by national copyright laws. The publisher or other rights holders may allow further reproduction and re-use of the full text version. This is indicated by the licence information on the White Rose Research Online record for the item.
Takedown
If you consider content in White Rose Research Online to be in breach of UK law, please notify us by
Exports, outward FDI and technology upgrading:
Firm level evidence from India
Sandra Lancheros Torres University of Leeds, UK
Abstract
This paper evaluates the individual and combined effects of exporting and outward foreign direct investments (OFDI)
on firms’ technology investments at home using firm-level data from the pharmaceutical industry in India. The analysis accounts for unobserved firm heterogeneity and the endogeneity of the choice of foreign market participation, and shows that exporting has been an important channel through which Indian multinational expansion has encouraged greater domestic technological activity. However, all else constant, higher levels of OFDI have rather acted as substitutes for such technological efforts.
1.
Introduction
During the past three decades policy makers from a number of developing countries have
undertaken outward-oriented economic reforms with a view to stimulating the acquisition of
global capabilities and promoting greater domestic economic activity. The liberalization of trade
and foreign direct investment regimens have been two important features of such reforms, which
have resulted in firms from developing countries rapidly expanding their presence in international
trade and foreign direct investment. However, the extent to which the deliberate outward
orientation of such firms is related to greater domestic economic activity is still a sparse area of
research. In particular, whether firms' international activities in the form of exports and outward
foreign direct investments (OFDI) affect their technological effort at home remains an important
open question.
From a theoretical perspective, recent work in international economics has emphasised
that improved access to foreign markets due to trade liberalization encourages firms to undertake
complementary investments in technology adoption and innovation. This connection between
exporting and technology investments has been modelled and tested empirically in a number of
different contexts.1 For example, Bustos’ (2011) provides empirical evidence from Argentina
showing that firms in industries facing reductions in Brazil’s imports tariffs, as mandated by
MERCOSUR, increased their investment in technology faster, and exporters upgraded technology
more rapidly than other firms in the same industry. Lileeva and Trefler (2010) show that Canadian
plants that were induced to start exporting, or export more, due to the elimination of U.S. tariffs
displayed higher rates of technology adoption and innovation. Constantini and Melitz (2008) show
participation in export markets, and Atkeson and Burstein (2010) show that a reduction in marginal
trade costs induces exporting firms to spend more on process innovation than non-exporting firms,
amplifying the superiority of exporting firms over time.2
While the above models have focused on the technological effects of improved access to
foreign markets in the context of liberalization of trade regimes, the technological effects resulting
from the increased access to foreign markets due to outward FDI liberalization has been absent
from existing theoretical work in international economics. This issue is particularly relevant in the
context of developing countries where capital controls have been relaxed in recent years, allowing
an increasing number of firms to rapidly expand their international operations. However, as yet,
little effort has been devoted to investigating the effect of such investments on firms’ technological
performance at home. The international business literature, on the other hand, has focused
primarily on understanding the characteristics and motivations of developing countries
multinationals to invest abroad, but little is known about the consequences of such investments
for the investing firms in their home countries. 3
Understanding the role of outward FDI for technological improvements in the home
country is central as there is a considerable concern as to whether the activities of multinational
enterprises affect the home economies; an issue that is particularly relevant in the context of
developing countries with scarce capital. On one hand, flows of outward foreign direct investment
generate fears that such investments come at the cost of reducing economic activity at home. In
contrast, an alternative perspective suggests that greater outward foreign direct investment could
enrich home activities by improving the competitiveness of the parent investing firms (Desai, et.
The limited empirical literature on the technological implications of overseas investments
by multinational firms has provided mixed results. In the context of developing countries, Chuang
and Lin (1999) find that the overseas investments of Taiwanese manufacturing firms substitute
their R&D investments at home, whereas Lin and Yen (2005) find complementary effects in the
Taiwanese electronic industry. Chen and Yang (2013), on the other hand, show that the
relationship between outward FDI and domestic R&D is undetermined because overseas
investments induce complementary as well as substitutive effects. In the case of India, Pradhan
and Singh (2009) find that outward FDI by automotive firms exerts a positive impact on the R&D
intensity of the investing firm. Those mixed results reveal that the impact of OFDI is likely to
differ depending on many factors, including the context and the motivations behind such
investments. Anecdotal evidence and numerous case studies performed on developing country
multinationals show that those firms are not an homogeneous group. Rather, they differ in a
number of dimensions, such as their country of origin, the industry in which they operate, and
their competitive advantage, amongst other aspects (Ramamurti, 2009). Hence, any attempt to
evaluate the effects of outward FDI on firms' performance should take into account those
specificities.
Overall, the sparse empirical literature examining the home-country technological effects
of the process of globalization of emerging market firms have mainly focused on the individual
effects of exporting and/or investing abroad. Yet, the complementary technological impact of
these two activities remains unexplored in the literature. This study investigates empirically the
individual effects of exporting and investing abroad, as well as their complementary impact on the
rate of technology investment at home. Examining the individual and complementary effects of
these two forms of foreign market participation is central to better understanding the channels
through which foreign activities of emerging market firms shape their technological capabilities at
international economics by exploring the relevance of a firm's multinational (OFDI) status for the
technology-exporting link, as well as the direct link between overseas and technological
investments. The international economics literature tends to regard exporting and investing abroad
as substitute modes of foreign market participation, yet empirical data show that in many contexts
firms engage in both activities simultaneously. Hence, the interplay between exporting, investing
abroad and investing in technology is still an open area for future theoretical and empirical research.
Apart from considering the complementary effects of exporting and investing abroad on
firms' domestic technological efforts, this paper extends previous works by considering a broader
measure of technology investment that includes not only expenditures on in-house R&D, but also
expenditures on computers and software, royalty fees, and the imports of capital goods. Also,
unlike most theoretical models that express technology investment as a binary choice for the sake
of mathematical tractability, this paper employs continuous measures of technology investment
which correspond more closely to the notion of technology upgrading. Moreover, this paper
accounts for firm unobserved heterogeneity and the potential endogeneity of the choice of foreign
market participation, an issue that has been largely neglected in previous empirical studies analysing
the effects of OFDI on firms' technological efforts.
The policy relevance of this work stems from the fact that Indian policy makers have been
active in promoting international agreements and liberalising trade and FDI regimes in order to
encourage technology acquisition by indigenous companies, especially from 2000 onwards. While
these efforts have produced remarkable results in terms of export and multinational expansion,
the cost-effectiveness of such policies in generating greater domestic economic activity remains
open to question. India’s rapid economic growth and successful integration with the global
economy makes it an excellent case study for this topic. As many developing countries are
becoming active global players, there is a growing interest from researchers and policy makers in
FDI liberalization. The analysis covers the years from 1999 to 2007, a period of on-going
globalization of Indian firms, in contrast to studies based on developed countries where the
process of internationalisation is not new.
This study focuses on the pharmaceutical industry in India and is based on the Prowess
database compiled by the Centre for Monitoring the Indian Economy. The Indian pharmaceutical
industry is an ideal case to study the relationship between exporting, OFDI and technology
investments. During the period 1999–2007, exports earnings by Indian pharmaceutical firms was
a staggering US$14.3 billion, accounting for 2.4% of India's total exports.4 Parallel to this
development, and taking advantage of the investment liberalisation policy of the government,
Indian pharmaceutical firms have been also busy in overseas markets having invested US$1.3
billion in transnational acquisitions during the period 2000-2006 (Pradhan and Alakshendra, 2006).
Moreover, the Prowess dataset used in this paper shows that within the manufacturing sector,
pharmaceuticals is the top industry in terms of flows of outward FDI during the period
1999-2007.5 Understanding the technological implications of foreign activities of Indian pharmaceutical
firms is particularly interesting, as it has been observed that firms in this industry are investing
abroad with the purpose of acquiring global capabilities to overcome their lack of cutting-edge
technologies. This analysis is therefore illustrative, as it is now well documented that an increasing
number of developing country firms have started to venture abroad with the purpose of acquiring
foreign technologies to cope up with increasing global competition and stronger international
property rights regimens (Athreye and Kapur, 2009).
As documented by Pradhan (2008), strategic government interventions facilitated the
building of strong indigenous capabilities and conquest international markets via exporting in the
pre-1990s period by Indian pharmaceutical firms. In particular, the soft patent policy that remained
manufacturing processes instead of final products. By permitting the adaptation of imported
technology and reverse engineering, this patent regime facilitated the development of local
innovations, but was mainly based on cost-effective process rather than in the creation of new
products. However, with the migration to a stronger patent regime in 2005, as mandated by the
WTO, Indian pharmaceutical firms have been observed to increasingly start investing in developed
countries with the purpose of quickly acquiring new products and foreign knowledge, rather than
using their limited resources in costly long-term innovations (Pradhan, 2008). 6 As such, it is
expected that the overseas investments of Indian pharmaceutical firms may substitute domestic
investments in technology.
However, on the other hand, it might be the case that a potential foreign market expansion
induced by firms' overseas investments would encourage greater technological investments at
home, as greater sales create more incentives to invest in costly technology. This potential channel
for in-house technological improvements is tested in this paper by looking at the relevance of a
firm's multinational (OFDI) status for the technology-exporting link. In line with the insights
from recent models of exporting and technology adoption, it is likely that the increase in exports
that have accompanied the recent wave of overseas investments by Indian pharmaceutical
companies might have provided them with a new impetus to upgrade their technological
capabilities at home.
Controlling for unobserved firm heterogeneity and the endogeneity of the choice of
foreign market participation, this paper shows that the export-intensity of Indian pharmaceutical
multinationals is associated with higher rates of technology adoption. However, there is no
evidence that the exports of non-multinational firms stimulate greater technology activity. These
results highlight the importance of taking the interaction between exporting and firm’s
technology investments at home, suggesting that technology-seeking overseas investments tend to
divert national resources from home to foreign countries rather than enriching domestic
technological activities.
The remainder of the paper is structured as follows. The next section presents the
empirical approach. Section 3 describes the dataset. Section 4 reports the main findings from the
econometric estimations, and Section 5 concludes.
2.
Empirical approach
This section describes the empirical approach used to identify the individual and combined
effects of exporting and OFDI on the rate of technology adoption. The following non-linear
panel data model of technology investment describes technology investment in the current
period in terms of the previous period’s firm characteristics:
) 1 ( ) * ( 1 7 1 6 1 5 1 4 1 3 1 2 1 1 0 it i t i it it it it it it it it f D OWN MNE EXP OFDI EXP PROD CASHFLOW SIZE AGE K I
where i and t index firms and time periods respectively. The dependent variable is the amount of
technology investment (I) normalised by total assets (K)7,
fi denotes time-invariant firm-specific
heterogeneity and is a random error term. In the above model EXP and OFDI capture the
export intensity and the amount of OFDI respectively. The export intensity is also interacted with
the firm’s multinational status (MNE) to allow for the fact that the investment-export nexus is
likely to differ for multinational and non-multinational companies.
Firm age captures learning-by-doing effects, whereas firm size reflects the extent to which
firm's internal liquidity is also likely to affect its ability to fund the cost of technological investments.
To allow for this possibility the cashflow ratio is included as a measure of firm's internal liquidity.
Another control variable is firm's productivity, which may impact technology investments in two
opposing ways. On one hand, more productive firms may be more likely to afford investing in
further productivity improvements (Bustos, 2011). On the other hand, least productive firms may
investment more to catch-up with their competitors, which is consistent with the notion of firm
level productivity-convergence (e.g. Bernard and Jones, 1996).
Finally, Equation 1 is estimated using a full vector of time dummies (Dt) and a vector of two
dummy variables (OWNi), which indicate whether the firm belongs to a business group and
whether the firm is owned by the State, respectively.
The treatment of the time-invariant unobserved heterogeneity, fi , and its relationship with
the explanatory variables, constitutes an important concern when estimating equation 1. In
non-linear panel data models with small time periods, it is not possible to treat the unobservables as
fixed parameters to be estimated by standard maximum likelihood due to the incidental parameter
problem. In order to identify the partial effects of the explanatory variables, this paper adopts the
Mundlak-Chamberlain approach by modelling the distribution of fi in a parametrical way. A
common practice is to assume a linear relationship between fi and either the time means of the
explanatory variables or a combinations of their lags and leads. In terms of implementation this
approach has the effect of adding firm-specific time averages (or a full set of leads and lags) of the
regressors to the set of explanatory variables in Equation 1 (Wooldridge, 2008, 2009).
However, a potential problem with this approach is that it relies on the assumption of strict
exogeneity of the explanatory variables conditional on the unobserved effects. But arguably, some
explanatory variables in Equation 1 (i.e. productivity, size, liquidity, exporting and OFDI ) might
Equation 1 the covariates are lagged one period in order to minimize the potential problem of
contemporaneous endogeneity. However, in order to better deal with potential endogenous
explanatory variables, this paper uses a control function approach consisting of: 1) estimating a
reduced form of each hypothesised endogenous variable on their lagged values and all other
endogenous and exogenous regressors8; 2) obtaining the reduced residuals from these estimations;
3) including these residuals in the list of covariates in Equation 1; and 4) performing the estimations
using a pooled Tobit model with robust standard errors clustering at the firm level. The hypothesis
of strict exogeneity is rejected if the coefficients on the residuals are significantly different from
zero (Wooldridge, 2008).
3. Database description
This paper draws on the Prowess database compiled from audited company balance sheets and
income statements by the Centre for Monitoring the Indian Economy. Prowess covers both
publicly listed and unlisted firms from a wide cross-section of manufacturing, services, utilities,
and financial industries. The companies covered by the database account for more than 70% of
industrial output, 75% of corporate taxes and more than 95% of excise taxes collected by the
Government of India.
Table 1 gives the frequency distribution of the pharmaceutical firms in the sample by year
and global status. Firms in Table 1 have been classified in five categories. The first category
comprises those Indian firms that only serve the domestic market. The second group includes
Indian firms that also export. The third category consists of those indigenous firms that export
and invest abroad (Indian MNEs). The fourth group are those Indian MNEs that invest abroad
but do not export, and the last category comprises all foreign firms operating in India. The category
examine whether exporting and investing abroad has encouraged technology upgrading by
indigenous companies in India. It can be observed that the number of Indian pharmaceutical
multinationals started to show a marked increase after 2000. This increase is largely due to
significant improvements in the regulatory framework governing Indian outward investment. For
example, since 2000 Indian companies have been allowed to make overseas investments by market
purchases of foreign exchange without the approval of the Reserve Bank of India up to 400% of
their net worth, compared to the previous limit of 50%. It is also interesting to note that most
Indian MNEs are engaged in exports. During the whole period, only a few pharmaceutical firms
set up operations abroad without exporting. Since the sample size is very small for this group of
firms for all years, this category of firms is also dropped from the empirical analysis.
[Table 1 about here]
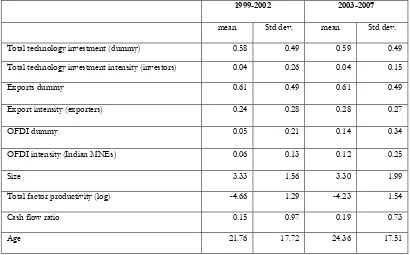
The variables used in the regression analysis are defined in Table 1A in the appendix and
their summary statistics are given in Table 2. Table 2 shows that about 59 percent of firms
undertake technology investments and that, on average, these firms invest 4 percent of their total
assets in technology. Table 2 also shows that, on average, more than 60% of pharmaceutical firms
export and the fraction of output exported increased from 24% in the first half of the sample
(1999-2002) to 28% in the second half. The percentage of firms engaged in overseas investments
and the amount of such investments also displayed significant increases between the two periods.
[Table 2 about here]
Figures 2 depicts the share of firm-year observations and technology investment ordered
by exporting and OFDI status. It is striking that although only 9.5% of pharmaceutical firms
engaged in both exporting and OFDI, they enjoyed a disproportionately high share of the value
appears to reinforce the idea that export-oriented Indian multinationals appear to be most willing
to develop their technological capabilities.
[Figures 2 about here]
In order to isolate the causal effects of exporting and OFDI on the rate of technology
adoption as well as to evaluate the interaction between them, it is important to control for a host
of observable and unobservable firm characteristics. This is achieved within the non-linear panel
data framework described in the previous section.
4. Empirical findings
Table 3 reports the marginal effects of exporting and OFDI on the expected amount of technology
investments from pooled Tobit estimates. Full estimation results including all control variables are
reported in Table 2A in the appendix. The marginal effects are calculated at the sample averages
of the control variables and the standard errors are adjusted to allow for clustering at the firm level.
In order to make this work comparable to previous related research, the first column of Table 3
reports the individual effects of exporting and OFDI on firm's technology investments without
accounting for firm heterogeneity. Similar to previous research examining the determinants of
R&D in the context of India (Pradhan, 2002, 2009; 2010), the results show that firms' export
intensity is positively associated with the pace of technology upgrading. However, in this
specification the amount of overseas investments does not appear to have significant technological
effects.
[Table 3 about here]
To allow for the fact that the technology-exporting nexus is likely to differ for
multinational and non-multinational companies, in column 2 of Table 3 the export intensity is
of heterogeneous technology-effects from exporting related to firm’s multinational status. While
the export intensity of non-multinationals does not appear to encourage technology investments,
there is strong evidence of a positive relationship between the export intensity of Indian MNEs
and their technology investment at home. The results show that a 1 percentage point increase in
the export intensity of Indian MNEs results in a 0.013 percentage point increase in the intensity
of domestic technology investments. This impact is economically important given that the average
technology investment by Indian pharmaceutical firms (as a fraction of total assets) is 4.0 percent
as reported in Table 2. This finding is consistent with the notion of market-seeking exporting
Indian MNEs being induced to invest in technology at home in order to become more competitive
in international markets. The results in column 2 of Table 3 also uncover evidence of a substantial
substitutive effect of firms' overseas investments on their rate of technology investments at home.
The estimates show that all else constant a 1 percentage point increase in outward FDI reduces
the amount of firms' technology investments by 0.011 percentage points.
The previous results do not account for potential unobserved firm heterogeneity.
However, it is likely that firms' international activities in the form of exports and overseas
investments are correlated with unobserved factors, such as managerial quality or risk behaviour,
that also influence their technological decisions. In column 3 of Table 3 firm's heterogeneity is
accounted for by including the mean values of the covariates, as described in section 2. The results
confirm the previous findings, indicating that the exports of Indian multinational firms are a
channel through which firm's multinational expansion enhances technology investments at home
and that the higher the level of outward FDI, the lower the rate of domestic technology
investments.9
As mentioned in Section 2, the above approach relies on the assumption of strict
might be violated. For example, it might be plausible that a firm's technological effort might affect
its export and/or outward FDI strategies. To check whether the previous results are driven by
the assumption of strict exogeneity conditional on firm's unobserved effects, column 4 of Table 3
presents the results of using a control function approach, where the residuals from estimating a
reduced form of each hypothesised endogenous variable are included in the list of covariates.10
As judged by the significance of the coefficients on the reduced residuals, it appears that firm's
size, total factor productivity and outward FDI are likely to be endogenous (see column 4 of Table
2A in the appendix). Interestingly, while the magnitude of the positive technological effects of the
exports of Indian MNEs remains almost unchanged, the magnitude of the negative impact of
overseas investments on firms’ technological efforts increases significantly once firm's
heterogeneity and the potential endogeneity of some regressors are accounted for. The estimate
results show that a 1 percentage point increase in outward FDI reduces the amount of firms'
technology by approximately 0.04 percentage points. This effect is almost 4 times higher than the
effect presented in column 2.
The previous results are obtained using the whole unbalanced panel dataset of Indian
pharmaceutical firms. Therefore, there is a potential risk that they might suffer from attrition bias.
In order to check whether the results are robust to this potential problem, column 5 in Table 3
reports the estimation results using only the subset of firms that are observed for all years. These
estimates confirm that overseas investments and firms' technology investments at home are
substitutive activities, with these negative effects being stronger in the balanced dataset. The results
also confirm the positive effects of exporting amongst Indian MNEs.
So far, the combined effects between exporting and firms' multinational status have been
accounted for by interacting the export intensity with a dummy variable for Indian MNEs (i.e.
and small overseas investments symmetrically. However, in order to check whether the
technology-exporting link of Indian MNEs varies with the amount of OFDI, in column 6 of
Table 3 the export intensity is interacted with 5 OFDI dummy variables, one for each quintile of
the OFDI distribution. The results indicate that the positive technological enhancing effects from
exporting are confined to Indian MNEs with low levels of overseas investments. It might be
plausible that only low levels of overseas investments are required to help firms to expand their
exports, with the subsequent positive technological implications of such expansion. The results
from this exercise show that, a 1 percentage point increase in the export intensity of Indian MNEs
in the lowest two quintiles of the OFDI distribution increases the rate of technology investments
by approximately 0.015. These results became stronger when the dataset is reduced to a balanced
panel as shown in column 7 of Table 3.
To check that the results presented in Table 3 are not inconsistent due to the imposed
parametric specification of unobserved firm's heterogeneity (i.e. as a linear function of
firm-specific time average of the regressors), columns 1 to 4 in Table 4 report the estimated results
obtained from modelling the distribution of unobserved heterogeneity as a linear function of all
the leads and lags of the covariates instead of using their mean values. The main results from this
exercise are in line with the previous results presented in Table 3.
In addition, in order to allow firm's heterogeneity to be correlated with the regressors in
an unrestrictive way, columns 5 to 8 in Table 4 report the estimated results from a linear fixed
effect model. As before, these results show that the exports of Indian multinationals exert a
positive effect on the rate of technology investments at home, whereas the amount of overseas
investments acts as a substitute for such investments.
Overall, the previous results highlight the importance of taking the interaction between
exporting and multinational status into account and suggest that incurring the fixed cost of
investing in technology is only attractive for exporting firms that have become multinationals in
recent years, probably due to the larger sales in foreign markets that come with their overseas
investments. The lack of evidence of technology enhancing effects from exporting amongst
non-multinational firms suggests that possibly these firms were induced to invest in technology in the
past, when they started to export, but now, with less scope to improve foreign market access, they
have less incentive to continue to upgrade their technological base. This is an interesting result, as
the fundamental complementarity between exporting and investing abroad –in particular, the
increase in foreign market access that comes with overseas investments- has been absent from the
existing work on trade and technology investments.
Does the industry matter?
So far the analysis has focused on the pharmaceutical industry. As argued in the introduction, there
are good reasons for the choice of this industry, in particular its leadership in overseas investments
by Indian manufacturing firms; as well as the well-documented behaviour of firms from this
industry investing abroad with the purpose of acquiring global technologies to overcome their
limited capabilities. Nonetheless, it is interesting to consider another equally important global
oriented sector in India. Within the service sector, the Indian software industry is the top industry
in terms of Indian outward FDI. This industry offers an intriguing contrast to the pharmaceutical
industry, not only for being predominantly service-based, but also because firms in this industry
are considered to be technological leaders in a global scale. Therefore, the motivations behind their
overseas investments are more for technological diversification rather than for technological
acquisition (Pradhan, 2008). As such, there is not so much scope for further domestic
no effects from exporting and/or outward FDI on firms' domestic technology investments.11
These contrasting results highlight the importance of taking into account the sectoral heterogeneity
of exporting and OFDI performance when evaluating the effects of globalization on firms'
technological efforts.
5. Conclusion
Recent work in international economics has shown that improved access to foreign markets due
to trade liberalization encourages firms to undertake complementary technology investments.
Using firm-level data from the pharmaceutical industry in India, this paper contributes to this
literature by examining whether the increase in foreign market access that comes with overseas
investments also encourages indigenous firms to upgrade their technological capabilities at home.
The analysis accounts for unobserved firm heterogeneity and the endogeneity of the choice of
foreign market participation, and shows that the decision to invest abroad is crucial in determining
the technology-exporting link. While there is evidence of technology-enhancing effects from
exporting amongst Indian multinationals, this paper fails to find evidence that exporting
non-multinational firms invest more in technology than non-exporting ones. This finding is consistent
with the notion of market-seeking exporting Indian multinationals being encouraged to invest in
technology at home in order to take advantage of improved foreign market access and become
more competitive abroad. Another striking result from this paper is the negative relationship
between the level of overseas investment (OFDI) and firms’ domestic technology investments, a
result that is consistent with the notion of technology-seeking Indian multinational firms devoting
their scarce resources to accessing existing technology abroad.
Overall, this study contributes to academic efforts that seek to pin down the channels
through which the choice of foreign market participation shapes firms’ competitive advantages. In
particular, this paper informs existing economic theory by cautioning for the need to consider the
heterogeneous nature of the exporting-technology investment link and take explicit account of the
OFDI decision when examining this link.
From a policy perspective, this paper shows that although outward FDI has a negative
effect on firms' domestic technological efforts (a concern that has been raised amongst some
academics and policy makers), the potential increase in exports induced by overseas investments
creates an alternative opportunity for technological improvements at home. Policies aimed at
promoting export-oriented OFDI can therefore be conducive for technological upgrading in the
home economies. However, OFDI with the singular purpose of acquiring foreign technology
might help the investing firms to overcome their lack of state-of-the art technology, but that would
come at the cost of discouraging technology change in their home countries.
Overall, conclusions regarding the role of outward FDI for technology enhancing
investments should take into account the motivations behind such overseas investments. In the
case of Indian pharmaceutical firms it has been documented that outward FDI are mainly
motivated by the desire to improve foreign market access (market-seeking motivation) and acquire
foreign technology (technology-seeking motivation). As such, these effects are likely to operate in
Acknowledgements
The author would like to thank two anonymous reviewers for their comments and suggestions,
which greatly improved the quality of the article. Access to data and code used in this article are
available upon request.
Disclosure statement
No potential conflict of interest was reported by the author.
Notes
1
See Melitz and Redding (2012) for a general description of the modelling techniques used in the international trade literature to capture the complementarities between exporting and investing in technology.
2
Other related papers examining the relationship between productivity, exporting and innovation more generally include Aw et al. (2007); Aw et al. (2011); Baldwin and Gu (2004); and Girma et al. (2008). In the case of India, early studies have found positive spillovers from exporting on R&D expenditures in the context of the liberalization reforms implemented during the 1990s (i.e. Kumar and Aggarwal, 2005 and Pradhan, 2002).
3
See Amighni et al. (2015) for a recent literature review of academic work on emerging markets multinationals.
4
Data from the Directorate General of Commercial Intelligence and Statistics of the Indian Ministry of Commerce and Industry, available at: http://www.dgciskol.nic.in/
5
Figure 1 shows the sectoral distribution of Indian manufacturing overseas investments in the Prowess database.
6
Pradhan (2008) shows that more than 80 percent of Indian pharmaceutical outward FDI during the period 2000-07 was directed to developed countries, indicating a strong technology-seeking motivation behind such investments.
7 Detail of the construction of the variables used in the empirical analysis is discussed in the next section and
summarised in Table 1A in the Appendix.
8
Firms' age, group and state affiliation, and a set of time dummies are considered to be exogenous.
9 The technology enhancing effects from exporting amongst Indian MNEs is also found by estimating Equation 1
using a random effects Tobit model. However, a major disadvantage of this estimation technique is that it relies on the critical assumptions that the unobserved effects are uncorrelated with the explanatory variables and that, conditional on the regressors and unobserved heterogeneity, observations across time are independent. These assumptions are unlikely to hold.
10 As mentioned in Section 2, firm's size, liquidity, productivity, exporting and investing abroad are suspected to be
endogenous. The reduced form estimations for each of these hypothesised endogenous variables is carried out using pooled OLS. The results presented in column 4 of Table 3 are obtained by regressing each potential endogenous variable on their second and third lagged values and on a vector of exogenous regressors including firms' age, group affiliation, state ownership, and a set of time dummies. The choice of the control variables in these reduced form estimations was made by estimating an instrumental variables Tobit model using these variables as instruments and performing an Amemiya-Lee-Newey test for the validity of the instruments. The main results are, however, robust to alternative specifications of the reduce form estimations.
References
Amighni, A., Cozza, C., Giuliani, E., and Pavia, R., Scalera, V. (2015). Multinational enterprises
from emerging economies: what theories suggest, what evidence shows. A literature review.
Economia e Politica Industriale. 42 (3), 343-370.
Athreye, S. and Kapur, S. (2009). The internationalization of Chinese and Indian firms: trends,
motivations and strategy. Policy brief. 1. United Nations University, UNU-MERIT.
Atkeson, A., and Burstein, A. T. (2010). Innovation, Firm Dynamics, and International Trade.
Journal of Political Economy, 118, 433-84.
Aw, B.Y, Roberts, M.J and Winston, T (2007). “Export Market Participation, Investments in R&D
and Worker Training, and the Evolution of Firm Productivity.” The World Economy, 14(1), 83–104.
Aw, B.Y, Roberts, M.J and Xu, D. Y. (2011). R&D investment, exporting, and productivity
dynamics, American Economic Review. 101,1312-1344.
Baldwin, J. R. and Gu, W. (2004). Trade liberalization: Export-market participation, productivity
growth and innovation, Oxford Review of Economic Policy. 20, 372–392.
Bernard, A.B. and Jones, C.I., (1996). Comparing apples to oranges: Productivity convergence and
measurement across industries and countries, American Economic Review. 86, 1216–1238.
Bustos, Paula (2011). Trade Liberalization, Exports, and Technology Upgrading: Evidence on the
Impact of MERCOSUR on Argentinean Firms, American Economic Review. 101, 304-40.
Chen, K. and Yang, S. (2013). Impact of outward foreign direct investment on domestic R&D
activity: evidence from Taiwan's multinational enterprises in low-wage income. Asian Economic
Chuang, Y., and Lin, C. (1999). Foreign direct investment, R&D, and spillover efficiency: Evidence from Taiwan’s manufacturing firms. Journal of Development Studies 35 (4), 117–34.
Constantini, J.A. and Melitz, M.J. (2008). The Dynamics of Firm-Level Adjustment to Trade
Liberalization, in Helpman, E., D. Marin and T. Verdier Eds, The Organization of Firms in a Global
Economy. Harvard University Press.
Desai, M., Foley, F. Hines, J. (2005). Foreign direct investment and domestic economic activity. NBER Working Paper No. 11717.
Girma, S., Görg. H. and Hanley, A. (2008). R&D and Exporting: Comparison of British and Irish
firms, Review of World Economics. 144, 750-773.
Kumar, N. and Aggarwal, A. (2005). Liberalization, outward orientation and in-house R&D
activity of multinational and local firms: A quantitative exploration for Indian manufacturing,
Research Policy, 34, 441-460.
Lileeva, A. and Trefler, D. (2010). Improved Access to Foreign Markets Raises Plant-Level Productivity….For Some Plants, The Quarterly Journal of Economics. 125, 1051-1099.
Lin, H. and Yen, R. (2005). The interdependence between FDI and R&D: an application of
endogenous switching model to Taiwan's electronic industry. Applied Economics. 37, 1789-99.
Melitz, M. J. and Redding, S. (2012). Heterogeneous Firms and Trade.NBER Working Paper 18652.
Pradhan, J. and Alakshendra, A. (2006). Overseas Acquisition versus Greenfield Foreign
Investment: Which Internationalization Strategy is better for Indian Pharmaceutical Enterprises?
MPRA Paper No. 12339, available at http://mpra.ub.uni-muenchen.de/12339.
Pradhan, J. (2008). Overcoming innovation limits through outward FDI: the overseas acquisition strategy of Indian pharmaceutical firms. Institute for Studies in Industrial Development. New Delhi.
Pradhan, J. and Singh, N. (2009). Outward FDI and knowledge flows: a study of Indian automotive
sector. International Journal of Institutions and Economics 1 (1), 156-187.
Pradhan, J. (2010). R&D strategy of small and medium enterprises in India: trends and
determinants. MPRA Paper No. 20951, available at
https://mpra.ub.uni-muenchen.de/20951/1/MPRA_paper_20951.
Ramamurti, R. (2009). What have we learned about EMNEs? In Emerging Multinationals in Emerging Markets, Ramamurti, R. and Singh JV. (Eds), Cambridge University Press: Cambridge, UK, 399-.426.
Wooldridge, J (2008). Inference for partial effects in nonlinear panel-data models using Stata.
Presentation at Summer 2008 North American Stata User's Group Meetings. Chicago.
Wooldridge, J. (2009). Developments in Econometrics. Nonlinear Panel Data Models. Cemmap
Figure 1: Sectoral distribution of overseas investments by Indian manufacturing firms, 1999-2007
Source: Author’s analysis based on the Prowess dataset.
Figure 2: Distribution of firm-year observations and share of technology investment by global status
Source: Author’s analysis based on the Prowess dataset.
0% 10% 20% 30% 40%
Drugs & pharmaceuticals Fertilisers Plastic packaging goods Steel Dyes & pigments Organic chemicals Aluminium & aluminium products Gems & jewellery Automobile ancillaries Copper & copper products Commercial vehicles Prime movers Industrial construction Metal products Other 65 industries
Percentage
48.6%
41.7% .2%
9.5%
Share of firm-year observations
25.2%
7.8%
.1% 66.9%
Export only No Export
OFDI only OFDI and Export
[image:24.595.120.477.490.747.2]Table 1
Frequency distribution of pharmaceutical firms by year and global status
Year Domestic Exporter Exporter
Indian
MNE
Non
Exporter
Indian
MNE
Foreign
MNE
Total
1999 88 149 2 0 27 266
2000 108 145 4 0 29 286
2001 102 121 20 0 31 274
2002 103 109 24 1 29 266
2003 113 130 28 1 26 298
2004 130 130 31 0 27 318
2005 119 117 33 0 27 296
2006 102 102 37 1 37 279
2007 68 84 34 2 34 222
Total 933 1,087 213 5 267 2,505
[image:25.595.93.503.483.738.2]Source: Author’s analysis based on the Prowess dataset.
Table 2
Summary statistics of main variables of interest:
1999-2002 2003-2007
mean Std dev. mean Std dev.
Total technology investment (dummy) 0.58 0.49 0.59 0.49
Total technology investment intensity (investors) 0.04 0.26 0.04 0.15
Exports dummy 0.61 0.49 0.61 0.49
Export intensity (exporters) 0.24 0.28 0.28 0.27
OFDI dummy 0.05 0.21 0.14 0.34
OFDI intensity (Indian MNEs) 0.06 0.13 0.12 0.25
Size 3.33 1.56 3.30 1.99
Total factor productivity (log) -4.66 1.29 -4.23 1.54
Cash flow ratio 0.15 0.97 0.19 0.73
Age 21.76 17.72 24.36 17.51
Table 3: Technology investment, exporting and OFDI
Dependent variable: technology investment
Without controlling for
firm's heterogeneity Accounting for firm's heterogeneity (Models with FDI-export interaction) Baseline Model (1) Model with FDI-export interaction (2) (3)
Accounting for potential endogeneity Unbalanced Panel (4) Balanced panel (5) Unbalanced Panel (6) Balanced panel (7)
Exports 0.0054** 0.0036 0.0012 -0.0016 -0.0095 -0.0010 -0.0095
(0.0026) (0.0027) (0.0044) (0.0098) (0.0107) (0.0099) (0.0107)
OFDI 0.0056 -0.0111* -0.0143** -0.0366***
-0.0615***
-0.0161 -0.0403**
(0.0058) (0.0065) (0.0066) (0.0130) (0.0109) (0.0161) (0.0164)
Exports*Indian MNEs 0.0134*** 0.0123** 0.0109** 0.0141*
(0.0050) (0.0052) (0.0054) (0.0079) Exports of Indian MNEs interacted with quintiles of OFDI
Exports*Quintile 1 0.0152*** 0.0231***
(0.0055) (0.0070)
Exports*Quintile 2 0.0147* 0.0291**
(0.0083) (0.0129)
Exports*Quintile 3 0.0059 -0.0002
(0.0094) (0.0083)
Exports*Quintile 4 0.0046 0.0061
(0.0092) (0.0108)
Exports*Quintile 5 -0.0108 -0.0092
(0.0087) (0.0115)
Control variables yes yes yes yes yes yes yes
Average values of the control variables
no no yes yes yes yes yes
Residual terms from reduced-form
estimations of potential endogenous variables
no no no yes yes yes yes
Observations 1641 1641 1641 914 521 914 521
Notes:
a. All results based on a pooled Tobit model
b. Marginal effects on the expected amount of technology investments are calculated at the sample means of the regressors. c. Standard errors (clustered at firm level) in parentheses
d. *significant at 10%; ** significant at 5%; *** significant at 1% All specifications include the full set of time dummies.
Table 4: Technology investment, exporting and OFDI
Dependent variable: technology investment
Robustness checks
Modelling unobserved heterogeneity as a function of all the history of the covariates
Allowing for unobserved heterogeneity to be correlated with the regressors in an unrestrictive way Unbalanced panel (1) Balanced panel (2) Unbalanced panel (3) Balanced panel (4) Unbalanced panel (5) Balanced panel (6) Unbalanced panel (7) Balanced panel (8)
Exports -0.0059 -0.0059 -0.0054 -0.0054 0.0040 0.0110 0.0045 0.0119
(0.0096) (0.0096) (0.0095) (0.0095) (0.0059) (0.0103) (0.0059) (0.0102)
OFDI -0.0593***
-0.0593***
-0.0536** -0.0536** -0.0372**
-0.0480***
-0.0023 -0.0081
[image:26.595.40.556.663.784.2](0.0071) (0.0071) (0.0104) (0.0154) Exports of Indian MNEs by quintiles of overseas investments
Exports*Quintile 1 0.0203*** 0.0203*** 0.0334*** 0.0524***
(0.0067) (0.0067) (0.0106) (0.0181)
Exports*Quintile 2 0.0065 0.0065 0.0485*** 0.0583***
(0.0065) (0.0065) (0.0150) (0.0145)
Exports*Quintile 3 -0.0017 -0.0017 -0.0026 0.0010
(0.0078) (0.0078) (0.0172) (0.0178)
Exports*Quintile 4 0.0097 0.0097 0.0241 0.0287
(0.0091) (0.0091) (0.0158) (0.0173)
Exports*Quintile 5 0.0040 0.0040 -0.0051 -0.0069
(0.0128) (0.0128) (0.0214) (0.0259)
Residual terms from reduced-form
estimations of potential endogenous variables
yes yes yes yes no no no
Leads and lags of the regressors
yes yes yes yes no no no no
Obs 521 521 521 521 1641 689 1641 689
a. All results in the first four columns are based on a pooled Tobit model. Marginal effects on the expected amount of technology investments are calculated at the sample means of the regressors. Note that modelling firm's heterogeneity as a linear function of all the leads and lags of the covariates forces the panel to be balanced. Hence, results in column 2 (4) are identical to those in column 1 (3).
b. Results in the last fourth columns are obtained using a linear fixed effects model. c. Robust standard errors in parentheses
d. *significant at 10%; ** significant at 5%; *** significant at 1% All specifications include the full set of time dummies.
[image:27.595.40.563.83.288.2]Appendix
Table 1A
Variable Definition
Technology investment The sum of real expenditures on own R&D, computers, software, royalty fees and imports of capital goods normalized by total assets
Size Log of total sales
Total factor Productivity Log of total factor productivity estimated based on 3-input (labour cost, value of fixed capital and cost of intermediate material inputs) production function using the Levinshon-Petrin (2003) technique which accounts for the endogeneity of inputs.
Exports intensity Exports/total sales
Cashflow ratio Cash flow/tangible fixed assets
Outward foreign direct investment (OFDI)
Investment by Indian multinationals in their overseas subsidiaries normalized by total sales. Indigenous firms’ multinational status
(MNE)
[image:28.595.22.566.85.190.2]Dummy variable equal to one if the Indian firm is engage in overseas investment, zero otherwise.
Table 2A: Technology investment, exporting and OFDI
Dependent variable: technology investment
Without controlling for
firm's heterogeneity Accounting for firm's heterogeneity
(Models with FDI-export interaction) Baseline Model (1) Model with FDI-export interaction
(2) (3)
Accounting for potential endogeneity Unbalanced Panel (4) Balanced panel (5) Unbalanced Panel (6) Balanced panel (7)
Size 0.0039*** 0.0037*** 0.0037** 0.0023 0.0003 0.0024 0.0004
(0.0006) (0.0006) (0.0015) (0.0022) (0.0029) (0.0022) (0.0029)
Productivity -0.0006 -0.0003 0.0010 0.0017 0.0011 0.0013 0.0005
(0.0007) (0.0007) (0.0014) (0.0024) (0.0028) (0.0024) (0.0028)
Cash flow ratio 0.0005 0.0006 0.0000 0.0002 -0.0026 -0.0000 -0.0023
(0.0008) (0.0008) (0.0008) (0.0036) (0.0041) (0.0035) (0.0040)
Age 0.0001* 0.0001* -0.0010 0.0002 0.0000 0.0003 0.0000
(0.0001) (0.0001) (0.0008) (0.0011) (0.0001) (0.0011) (0.0001)
Private group -0.0001 -0.0001 0.0000 0.0005 0.0012 0.0004 0.0011
(0.0018) (0.0017) (0.0018) (0.0022) (0.0029) (0.0023) (0.0029)
State ownership -0.0119*** -0.0114*** -0.0114*** -0.0138*** -0.0191*** -0.0137*** -0.0189***
(0.0041) (0.0041) (0.0042) (0.0048) (0.0040) (0.0048) (0.0039)
Exports 0.0054** 0.0036 0.0012 -0.0016 -0.0095 -0.0010 -0.0095
(0.0026) (0.0027) (0.0044) (0.0098) (0.0107) (0.0099) (0.0107)
OFDI 0.0056 -0.0111* -0.0143** -0.0366*** -0.0615*** -0.0161 -0.0403**
(0.0058) (0.0065) (0.0066) (0.0130) (0.0109) (0.0161) (0.0164)
Exports*Indian MNEs
0.0134*** 0.0123** 0.0109** 0.0141*
(0.0050) (0.0052) (0.0054) (0.0079)
Exports of Indian MNEs by quintiles of overseas investments
Exports*Quintile 1 0.0152*** 0.0231***
(0.0055) (0.0070)
Exports*Quintile 2 0.0147* 0.0291**
(0.0083) (0.0129)
Exports*Quintile 3 0.0059 -0.0002
(0.0094) (0.0083)
Exports*Quintile 4 0.0046 0.0061
(0.0092) (0.0108)
Exports*Quintile 5 -0.0108 -0.0092
(0.0087) (0.0115)
Average values of the control variables
Size -0.0002 0.0016 0.0025 0.0015 0.0024
(0.0014) (0.0022) (0.0027) (0.0022) (0.0026)
Cashflow ratio 0.0018 0.0012 0.0031 0.0011 0.0031
(0.0025) (0.0028) (0.0047) (0.0028) (0.0047)
Age 0.0011 -0.0001 0.00001 -0.0002 0.00001
(0.0008) (0.0011) (0.0001) (0.0011) (0.0009)
Exports 0.0028 0.0059 0.0123 0.0053 0.0120
(0.0057) (0.0106) (0.0137) (0.0107) (0.0136)
OFDI 0.0085 0.0272 0.0563** 0.0478** 0.0772***
(0.0148) (0.0209) (0.0225) (0.0222) (0.0235)
Residual terms from reduced-form estimations of potential endogenous variables
Size 0.0048** 0.0049** 0.0048** 0.0050**
(0.0023) (0.0020) (0.0023) (0.0020)
Productivity -0.0056*** -0.0046* -0.0055*** -0.0045*
(0.0021) (0.0025) (0.0020) (0.0024)
Cashflow -0.0006 0.0011 -0.0005 0.0008
(0.0033) (0.0040) (0.0033) (0.0039)
Exports -0.0034 0.0029 -0.0038 0.0030
(0.0076) (0.0087) (0.0077) (0.0088)
OFDI 0.0268** 0.0451*** 0.0217* 0.0404***
(0.0130) (0.0112) (0.0127) (0.0100)
Observations 1641 1641 1641 914 521 914 521
Notes:
a. All results based on a pooled Tobit model