The Impact of Two Coupled Cirrus Microphysics–Radiation Parameterizations
on the Temperature and Specific Humidity Biases in the Tropical Tropopause
Layer in a Climate Model
ANTHONYJ. BARAN, PETERHILL,aDAVIDWALTERS, STEVENC. HARDIMAN,AND
KALLIFURTADO
Met Office, Exeter, United Kingdom
PAULR. FIELD
Met Office, Exeter, and University of Leeds, Leeds, United Kingdom
JAMESMANNERS
Met Office, Exeter, United Kingdom
(Manuscript received 18 November 2015, in final form 7 April 2016)
ABSTRACT
The impact of two different coupled cirrus microphysics–radiation parameterizations on the zonally averaged temperature and humidity biases in the tropical tropopause layer (TTL) of a Met Office climate model configuration is assessed. One parameterization is based on a linear coupling between a model prognostic variable, the ice mass mixing ratioqi, and the integral optical properties. The second is based on the integral optical properties being
parameterized as functions ofqiand temperature,Tc, where the mass coefficients (i.e., scattering and extinction) are
parameterized as nonlinear functions of the ratio betweenqiandTc. The cirrus microphysics parameterization is
based on a moment estimation parameterization of the particle size distribution (PSD), which relates the mass moment (i.e., second moment if mass is proportional to size raised to the power of 2) of the PSD to all other PSD moments through the magnitude of the second moment andTc. This same microphysics PSD parameterization is
applied to calculate the integral optical properties used in both radiation parameterizations and, thus, ensures PSD and mass consistency between the cirrus microphysics and radiation schemes. In this paper, the temperature-non-dependent and temperature-temperature-non-dependent parameterizations are shown to increase and decrease the zonally averaged temperature biases in the TTL by about 1 K, respectively. The temperature-dependent radiation parameterization is further demonstrated to have a positive impact on the specific humidity biases in the TTL, as well as decreasing the shortwave and longwave biases in the cloudy radiative effect. The temperature-dependent radiation parameteri-zation is shown to be more consistent with TTL and global radiation observations.
1. Introduction
It is well known that cirrus makes an important contribution to the radiative balance of the tropical tropopause layer (TTL) through its temperature,
spatial distributions, opacity, and composition. More-over, it influences the water vapor concentration in the stratosphere (Heymsfield 1986; Sassen et al. 1989;
McFarquhar et al. 2000;Corti et al. 2006;Wang and Dessler 2006; Stubenrauch et al. 2007; Jensen et al. 2008;Mace et al. 2009;Yang et al. 2010;Schwartz and Mace 2010;Taylor et al. 2011;Zhou et al. 2014;Hong and Liu 2015; Hardiman et al. 2015, and references therein).
aCurrent affiliation: Department of Meteorology, University of
Reading, Reading, United Kingdom.
Publisher’s Note: This article was revised on 9 August 2016 to correct the spelling of the fourth author’s name.
Corresponding author address: Dr. Anthony J. Baran, Met Of-fice, Cordouan 2, FitzRoy Road, Exeter, Devon EX1 3PB, United Kingdom.
E-mail: [email protected]
Typical TTL cirrus will efficiently trap outgoing longwave radiation from the surface and atmosphere, generally leading to a warming of the surface, and ab-sorb incoming shortwave radiation at near-infrared wavelengths, generally leading to a local heating of the upper troposphere (Liou 1986; Liou 2005;
Edwards et al. 2007;Baran 2009;Taylor et al. 2011;
Baran 2012;Yi et al. 2013;Zhou et al. 2014;Hong and Liu 2015; Yang et al. 2015; Hardiman et al. 2015). The balance between cirrus warming or cooling the upper troposphere depends on its visible optical depth, as shown by Hong and Liu (2015), who dem-onstrated that cirrus with visible optical depths less than unity leads to a net heating of the upper tropo-sphere, while optically thicker cirrus results in a net cool-ing of the upper troposphere. Moreover, subvisual cirrus occurs in the TTL, as found byLawson et al. (2008); also,
Lee et al. (2009)showed that these clouds may exert a net radiative effect on the order of about 1.1 W m22.
In general, the role of cirrus in either heating or cooling the TTL depends not only on the visible optical depth but also on the microphysics and the scattering and absorption properties of atmospheric ice (Baran et al. 2014a, hereinafter B014a; Yang et al. 2015, and refer-ences therein). There have been aircraft campaigns that have examined the ice microphysics composition of the TTL. In the study by Heymsfield (1986), the common occurrence of trigonal particles was reported but more recent studies by Lawson et al. (2008)have found few occurrences of trigonal ice particles. In the study by
McFarquhar et al. (2000), they found habit mixtures comprising 50% of hexagonal columns and trigonal ice crystals in the subvisual TTL cirrus they studied. Mean-while,Lawson et al. (2008)found the occurrence of quasi-spherical ice particles to be the most common particle type for all crystal sizes. However, it is uncertain as to whether these particles are actually quasi-spherical due to the limiting resolving power of the microphysics instru-mentation used at the time; therefore, the appearance of quasi-sphericity could be due to diffractive and optical effects, as noted by Cotton et al. (2010)and references therein. On the other hand, these particles could be quasi-spherical, but instruments are required that can ade-quately resolve these ice crystals of an uncertain shape, such as the small ice detector described inUlanowski et al. (2006). For crystal sizes greater than 65mm,Lawson et al. (2008)found habit mixtures comprising mostly hexagonal plates and irregular ice crystals. In the study byJensen et al. (2008)they noted the occurrence of hexagonal plate aspect ratios of 6:1 of nearly 100mm in size near the TTL, which were reported to be unassociated with deep tropical convection. The more recent Airborne Tropical Tropo-pause Experiment (ATTREX) reported byJensen et al.
(2016) found bullet rosettes to be commonly occurring with little evidence of aggregated ice crystals in the cirrus cases they sampled. The two particle size distributions shown in Jensen et al. (2016) extend to maximum di-mensions of about 50mm and almost 200mm, at temper-atures of ,195 K and between about 195 and less than 210 K, respectively. Meanwhile,Lawson et al. (2008) re-port particle distributions extending to 165mm in the subvisual TTL cirrus they sampled, which contrasts with the study ofMcFarquhar et al. (2000), who found that particle maximum dimensions did not extend to beyond 50mm. Determining the habit mixtures and particle dis-tributions in TTL cirrus is important, as the choice of assumed particle distributions in climate models will influence their predicted radiative effect of cirrus. For instance, in the study ofMitchell et al. (2008)they show that by assuming two different parameterizations of the small ice mode, the shortwave radiative effect differ-ences in the annual zonally averaged fluxes at the top of the atmosphere in the tropics can be up to about 225 W m22. They also show that the longwave differences in the tropics can be up to 20 W m22. Clearly, from the studies cited above, there is uncertainty as to the most general ice microphysics composition in the TTL to assume in models; in turn, this will affect climate model simulations of the TTL, as differing climate models assume dissimilar microphysics properties, which may lead to an excess in TTL warming or cooling (Hardiman et al. 2015). Further campaigns in the TTL are necessary if such uncertainties reported by Hardiman et al. (2015)are to be reduced in climate models. How-ever, recent TTL process studies by Hardiman et al. (2015) have shown that physically improved climate model parameterizations do not necessarily improve simulations of the TTL. For example, recent parame-terizations of cirrus microphysics and bulk optical properties by Furtado et al. (2015) and B014a, re-spectively, were shown to increase the temperature and specific humidity biases in the TTL in recent global configurations of the Met Office Unified Model (MetUM). In this paper, the physical reasons are explored as to why the parameterizations of Baran et al. (2014b, hereinafterB014b)increased the TTL temperature bias in the climate model. This paper also presents a new bulk optical property parameterization of cirrus that is demonstrated to provide a more accurate simulation of the TTL in the MetUM as well as an improved repre-sentation of MetUM simulations of the cloudy short-wave and longshort-wave radiative effects. The paper is organized as follows:Section 2describes the bulk op-tical property parameterization and its accuracy, and includes comparisons between the new and theB014b
MetUM configuration and compares the impact of the new and B014b parameterizations on this configuration against both observations and analyses.Section 4 dis-cusses the results.
2. The parameterization
The parameterization presented in this paper is based on the ensemble model of cirrus ice crystals fully described in Baran and Labonnote (2007), whereby the bulk optical properties are derived by averaging habit-dependent, single-scattering proper-ties over an assumed particle size distribution (PSD); a figure of the model is shown in Fig. 2 inB014b. A brief description of the model is given here. The en-semble model consists of six shapes, and these are a hexagonal ice column of an assumed aspect ratio (AR) of unity, the six-branched bullet rosette, and then hex-agonal monomers are randomly attached to build four ice aggregate models, which consist of 3-, 5-, 8-, and, finally, 10-branched hexagonal ice aggregates. The latter aggregate models can cover the largest ice crystal sizes found in the PSD, while the former members can pop-ulate the smaller end of the ice crystal PSD. Alterna-tively, weights can be assigned to each member of the ensemble model at each PSD bin size to compute the bulk optical properties. Here, use is also made of the same bulk ice optical property database that was used to develop theB014b parameterization. The da-tabase is composed of the following bulk optical prop-erties: the extinction and scattering coefficients, the single-scattering albedov0, and the asymmetry param-eterg. These bulk optical properties are defined by Eqs. (1)–(3) inB014b, and the same definitions are used in this paper. A full description of that database can be found inB014aandB014b. However, brief descriptions of the bulk optical property database and its experi-mental validation are given here. The database de-scribed inB014aconsists of 20 662 values of ice water content (IWC) and Tc, which were compiled from a
number of cirrus field campaigns described in Baran et al. (2011a), and these in situ campaigns were pre-dominantly located between northern Europe and the tropics. However, most of the in situ IWC values that were compiled byBaran et al. (2011a)were not obtained at temperatures colder than2608C. Because of this lack of in situ ice microphysics measurements down to tempera-tures as low as2808C, inB014a, IWC values were ran-domly selected from temperatures warmer than2608C and placed at temperatures between2608and2808C. In this way, the IWC and Tcspace was built up to 20 662
values, which ranged between about 3.0 3 1023 and about 1029kg m23, and between about 2808 and 08C,
respectively. This range in IWC and Tc is sufficient to
cover the range in IWC andTcvalues that are likely to be
predicted in the MetUM.
InB014aandB014b, the IWC andTcvalues were
related to the PSD through a moment estimation pa-rameterization of the PSD ascribed to Field et al. (2007, hereafter F07) and this parameterization is further described below. The IWC–Tc generated
PSDs were previously applied to the ensemble model single-scattering properties described in B014a to obtain the cirrus bulk optical properties used inB014b
at 145 wavelengths between 0.20 and 120mm. The same bulk ice optical properties utilized inB014bare used in this paper.
The coupled IWC–Tc bulk ice optical properties
used in this paper have been validated using a variety of aircraft- and space-based solar and infrared ra-diometric measurements. For instance, in B014athe ensemble model bulk ice optical properties were ap-plied to a fast radiative transfer model to simulate very high-resolution solar (between about 3.4 and 4.1mm) and infrared (between about 8.0 and 12.0mm) aircraft-based brightness temperature measurements obtained from directly above midlatitude cirrus of visible optical depth varying between about 0.03 and 0.06. It is shown in the paper that the solar and in-frared brightness temperature measurements were mostly simulated to within62 and61 K, respectively. Note also that the lower visible optical depth of 0.03 is generally taken as the upper limit for ‘‘subvisual’’ cirrus, as defined by Sassen and Cho (1992). More-over, B014a also showed that the same ensemble microphysical model could forward model deep frontal cirrus effective radar reflectivity at 35 GHz and microwave brightness temperatures at 190 GHz to generally within 62 dBZeand62 K, respectively.
Thus,B014ashowed that, in the case of the solar and infrared measurements, the same microphysical model can be consistently applied across the spectrum using a full set of optical properties (i.e., the scatter-ing phase function and integral optical properties) to simulate those observations. Meanwhile, Sourdeval et al. (2015) demonstrated that the same ensemble model bulk ice optical properties used in B014a
model’s predicted bulk optical properties have also been globally validated byVidot et al. (2015)andLetu et al. (2015).
InVidot et al. (2015)it is shown that an equivalent weighting of 0.30, 0.30, 0.10, 0.20, and 0.10 applied to each of the ensemble habit extinction and scattering coefficients at each bin size of the F07PSD parame-terization best simulated cirrus infrared brightness temperature measurements from the Imaging In-frared Radiometer (IIR) instrument at wavelengths of 8.65, 10.60, and 12.05mm. The combined mean brightness temperature bias using the weighted model optical properties was found to be only 0.43 K with a standard deviation of 6.85 K for visible opti-cal depths between 0.03 and 4.0. The IIR bright-ness temperature simulations were based on more than 26000 profiles of IWC from the Cloudsat and CALIPSO Ice Cloud Property Product (2C-ICE) and radar–lidar (DARDAR) products (Deng et al. 2010;
Delanoëand Hogan 2010). The IWC product profiles and atmospheric profiles (the latter profiles came from the European Centre for Medium-Range Weather Forecasts and were collocated with CALIOP) were lo-cated between the latitudes of about6608and at altitudes between about 440 and 50 hPa, thus covering the region of the TTL, and most of the profiles were located in the tropics. Meanwhile, Letu et al. (2015) used global ob-servations from the Polarization and Directionality of the Earth’s Reflectances-3 (POLDER-3) measurements on board the Polarization and Anisotropy of Reflectances for Atmospheric Sciences coupled with Observations from a Lidar (PARASOL) to show that the ensemble model’s predicted ice cloud solar optical depths at a wavelength of 0.865mm best minimized differences be-tween observations, with all ice crystal models consid-ered. The POLDER-3 analysis of Letu et al. (2015) is based on 589 246 pixels, with each pixel size being ap-proximately 6 km 36 km. In most pixels the scattering angle range covered is between 608and 1608, and in some pixels the scattering angle range covered is between 1608 and 1808. The pixels were located between the latitudes of about6908, but the vast majority of pixels were located at latitudes between about6608. The data cover the period between the 20th and 22nd of March, June, September, and December 2008. Therefore, all meteorological sea-sons are covered in the time period studied byLetu et al. (2015)and the study is, thus far, the most comprehensive and consistent analysis of POLDER-3 global data. Given the preceding evidence, the ensemble model bulk ice optical properties have been sufficiently validated glob-ally to apply to a parameterization of cirrus optical properties in a climate model. Such validation exercises described above are necessary to carry out to show that
the full set of optical properties is consistent with mea-surements from across the spectrum in order to provide confidence in their applicability to climate models. As a further example of this validation approach, see, for ex-ample, the paper byHolz et al. (2016).
The PSDs applied to the ensemble model single-scattering properties in the preceding literature as-sumed theF07moment estimation parameterization of the PSD. A full derivation of the PSD parameteri-zation is given inF07, but a brief description is given here. The F07 parameterization is based on 10 000 in situ measurements of the PSD and IWC, which were measured between the temperatures of 08and2608C during a number of cirrus field campaigns located in the midlatitudes and tropics. The parameterization is based on the moments of the PSD, given by the in-tegral product ofDnandf(D), where Dis the maxi-mum dimension of the ice crystal and f(D) is the PSD, which gives the particle number concentration at eachD, andn$0. Therefore, the zeroth moment (i.e.,
n50) is the total number concentration of particles per unit volume of cloudy air. The PSD parameteri-zation is related to the total IWC through some as-sumed relationship between mass andD, where in the case of aggregating ice crystals the mass of ice}D2
(Westbrook et al. 2004;Cotton et al. 2013, and refer-ences therein). The other moments of the PSD are related to the second moment (M2) through a re-lationship of the formMn5snM2bn, wheresnandbn
are functions of Tc. Therefore, given allMn, the full
PSD can be estimated from the IWC andTcvalues via
an assumed mass–dimensional relationship. It should be noted here that to reduce the impact of ice crystal shattering on the PSD parameterization, the in situ PSDs inF07were filtered by using the measured in-terarrival times of the ice crystals as described inF07
and Field et al. (2006), and ice crystals with D ,
from the best-estimated PSD occurs cannot as yet be determined due to insufficient statistical sampling of ice clouds. In other words, there are too few cirrus field campaigns on which to base firm conclusions. Therefore, it is currently unknown to what degree theF07 parame-terization has been affected by the shattering of ice. However, this parameterization is more representative of cirrus PSDs than theHouze et al. (1979)PSD parame-terization, which is the current assumption in the MetUM operational model. TheHouze et al. (1979) parameteri-zation is based on 37 in situ PSDs, 90% of which were measured at temperatures warmer than 2308C. Cur-rently, within the operational MetUM, theHouze et al. (1979)estimated PSD is kept constant at temperatures colder than2358C. This assumption means that at much colder temperatures, such as those that occur within the TTL region, there will be orders of magnitude more frequently occurring large ice crystals than there should be. This has clear implications for the assumed fall speed of ice crystals within the MetUM model, which must be artificially increased to several meters per second to accommodate space-based radiometric shortwave and outgoing longwave measurements of flux at the top of the atmosphere (TOA).
The F07 parameterization has been experimentally validated by Baran et al. (2011b) and Furtado et al. (2015). InBaran et al. (2011b) the moment estimated PSD was found to fit well to several cases of averaged in situ measured tropical PSDs. For several cases of midlatitude cirrusFurtado et al. (2015) compared the
F07moments to in situ measured moments, while ig-noring particles less than 100mm in size because of the current uncertainties in measuring the size of small ice at
D,100mm, and found good correlations between the parameterization and measurements for all cases con-sidered. However, poor correlations emerged in that study when the moments predicted by theHouze et al. (1979) parameterization were compared against the in situ derived moments. The study ofFurtado et al. (2015) emphasizes that the F07 parameterization is a better representation of the ice PSD to apply to climate models in general than theHouze et al. (1979) param-eterization. This last statement is especially true in the TTL, given the above description of the Houze et al. (1979)parameterization.
Given that the F07 PSDs are related to a model prognostic variable (i.e., the mass carrying momentM2) and this varies as a function ofTc, given that the
en-semble model single-scattering properties have been integrated over these PSDs, the bulk ice optical prop-erties can also be directly related to the climate model prognostic variable IWC [i.e.,m(D)5constant3D2, wheremis the mass (in kg)] andTcor just IWC (as is the
case inB014b). The behavior of the 20 662 bulk ice op-tical properties,v0 andg, inM2–Tcspace, is shown in
Figs. 1a and 1b, respectively, at a wavelength of 1.575mm. This wavelength is chosen as an example to show the variation of the bulk ice optical properties in the full space used for the later parameterizations. In
Fig. 1a, it is shown thatv0varies between the values of 0.7 and 1.0, at the coldest temperature values, down to about2808C andM2;1025m21, andv0is near unity. At these values ofM2andTc, the PSD is very narrow
and will be largely composed of small ice crystals with many fewer occurring large ice crystals; therefore at this wavelength the smaller ice crystals will efficiently scatter incident radiation. At much larger values ofM2and at much warmer temperatures, at 0.01 m21 and 2158C, respectively, the value of v0 decreases to a value of about 0.8. At suchM2andTcvalues, the PSD becomes
much broader than previously, with much more fre-quently occurring large ice crystals, which at this wave-length will absorb incident radiation, thereby decreasing
v0. The converse behavior is shown, at the same values of
M2andTc, forginFig. 1b, whereghas the corresponding
values of about 0.78 and 0.88. The reasons for these values are the same as those given for the behavior of v0.
Figures 1a and 1bshow that the spatial distribution ofv0 andgis physically to expectation and would be a similar distribution if the optical properties were plotted as a function of some characteristic size. Here, we demon-strate this using the characteristic size usually assumed in radiation schemes in climate models, which is the mean effective dimension,Deff, defined afterFoot (1988)as
Deff5masst
rAt , (1)
where in Eq. (1) masstand Atare the total mass and
orientation-averaged projected area of the PSD, re-spectively, and r is the density of solid ice. Here, we assume that r5 1000 kg m23 to keep units in Eq.(1)
consistent, hence the units of masstandAtbeing in SI.
First, we show that the momentM2can easily be related toDeff, as shown inFig. 2, where inFig. 2, as an example, we assume that the masstandAtare computed from the
first member of the ensemble model, which is the hex-agonal ice column of AR 51.0. As can be seen from
Fig. 2, the second moment or, equivalently, IWC (by assuming some mass–D relationship) could easily be related toDeffas a function ofTcor just by relating IWC
optical properties can also be easily parameterized as a function ofM2or IWC andTc, as is done inB014b(i.e.,
IWC alone) and in this paper (i.e., IWC and Tc). We
note that, for aggregating ice crystals both mass and diameter are proportional to D2, so Deff becomes in-dependent of IWC. A further characteristic size could also be defined, such as the ratio between the third and second moments of the PSD. If the second moment is the mass-carrying momentM2, this characteristic size is the mean mass-weighted size, Dmmw. The relationship be-tweenDeffandDmmwis characterized byFigs. 3a and 3b, respectively, which show the variation ofv0at a wave-length of 1.575mm as a function of the characteristic sizes andTcfor all 20 662F07PSDs. In the case ofDeff, in the
figures the same definitions are used as above. The figure shows thatDeffis simply some multiple ofDmmwand the spatial distribution of v0 in the spaces of characteristic size—Tcis exactly the same. Furthermore, the
distribu-tion ofv0shown inFigs. 3a and 3bis relatable toFig. 1a. That is, at the sameTcvalues of2808and2158C, small
and large characteristic sizes can be chosen to give the same values ofv0for the same values of M2 assumed above. The above figures illustrate that there is a choice to be made as to how the bulk ice optical properties are parameterized in climate models.
As is done inB014band in this paper, we avoid re-lating the bulk ice optical properties toDeffas is tradi-tionally done. Instead, our choice is to relate the optical
FIG. 1. The bulk optical properties (a)v0and (b)gas a function of the mass carrying moment
properties directly to climate model prognostic variables such asM2/IWC. This is because in climate modelsDeff is generally diagnosed in the radiation scheme and the
Deffin the radiation scheme is different from theDeffin the cloud physics scheme of a climate model because different PSDs are usually assumed. In the approach adopted byB014band in this paper, we ensure that the PSDs generated through the F07 parameterization in the cloud physics scheme in the climate model are the
sameas those used in the radiation scheme, thus pro-viding internal physical consistency within the climate model. In the traditional approach, this physical internal consistency is generally currently lost. Internal physical consistency could be satisfied using the traditional ap-proach ifDeffwere determined from the PSDs within the cloud physics scheme of the climate model and these values passed to the radiation scheme. In this way, the effective size then becomes consistent between the two schemes. However, this recovery of physical consistency requires an extra step within the climate model. Here, we prefer to avoid such an unnecessary step. It should also be noted that from Eq.(1), the integral over the mass re-quires some mass–Drelationship to be applied. However, this mass–Drelationship will obviously change depend-ing on the choice of habit models; as a consequence, this has the potential to change the spatial distribution ofv0 shown inFig. 3a. However, in the approach adopted here, the mass of ice predicted by the climate model cannot change and, thus, will always be the same mass of ice between the cloud physics and radiation schemes.
In this paper, to generate the PSDs, theF07moments are generated while assuming the recommendedFurtado et al. (2015)mass–dimensional prefactor and exponent
values of 0.0257 and 2.0, respectively, which were derived by Cotton et al. (2013), and by using the 20 662 IWC estimates and in-cloud temperature measurements compiled by B014a. Note that this mass–dimensional relationship is the same as that as-sumed byHardiman et al. (2015), and was used byVidot et al. (2015)to find the optimal ensemble model optical property parameterization that best simulated globally measured infrared radiometric brightness temperatures. Furthermore, in this paper, the weights assigned to each of the ensemble members at each F07 PSD bin size are the same as those assumed in experiment 4 of
B014b[i.e., Eq. (9) in that paper], which were 0.50, 0.20, and 0.30, respectively. This assignment of weights to the ensemble model is different from that found by
Vidot et al. (2015)to achieve radiometric equivalence between the model and measurements. However, ex-periment 4 of B014b gave the best comparisons be-tween the climate model runs and space-based shortwave and longwave radiation measurements. In contrast, the Vidot et al. (2015) analysis is based on measurements obtained at three wavelengths in the infrared. It is yet to be seen whether the weightings found in that paper would remain the same if more solar and infrared wavelengths were to be utilized. This will be the subject of a future paper; thus, we assume the same weightings as those used in experiment 4 ofB014b.
In the MetUM configuration of models, atmospheric particulates such as aerosol, ice, and water clouds are represented by vertical profiles of their mixing ratios with respect to air. In this paper and inB014b, the IWC becomes the ice mass mixing ratio,qi, that is, the ratio
between ice mass per unit volume and the mass of cloudy air per unit volume, and is in units of kg kg21. Likewise, the bulk optical properties, the volume ex-tinction, and scattering coefficients become the mass extinction, Kext, and mass scattering coefficients,Ksca, and both are in units of m2kg21(i.e., the extinction and scattering coefficients per unit mass of cloudy air).
In this paper, the bulk optical property database is first divided into the six shortwave and nine longwave Edwards–Slingo (Edwards and Slingo 1996, hereafter
ES96) bands; these bands are defined inTable 1. In each of theES96bands, a total of about 10 000qiandTcvalues
were randomly selected from the bulk optical property database ofB014a. Selected values ofqiandTcwere
be-tween 1.031028and 0.004 kg kg21and 2808and 08C, respectively. This randomly selected range inqi–Tcspace
is sufficient to capture the full range that might be gen-erated in an atmospheric model. In each of the ES96
bands, the bulk optical properties were parameterized as nonlinear and linear functions, dependent onqiandTc, by
FIG. 2. The mass carrying moment M(2) as a function of the mean effective dimension,Deff, and temperature,Tc, for all 20 662
values. The key on the right-hand side of the figure isTcin units
an iterative minimization procedure. That is, the forms of the parameterizations were first assumed and then the coefficients, for each of the parameterizations, were esti-mated by iterating through possible coefficient values. This was done until differences between the parameteri-zations and randomly selected 10 000 bulk optical prop-erties were within acceptable experimental limits (i.e., estimatedKextandKscavalues must be within650% of their true values for.90% of all possibleqi–Tcvalues).
The error of 650% in the mass coefficients is based on likely in situ errors in extinction estimates previously discussed inBaran et al. (2009). The errors resulting from this fitting procedure are discussed further below. The
above fitting procedure resulted in the following best-fit bulk optical property parameterizations of cirrus:
Kext(l,qi,Tc)5al(qi/T4
c) , (2)
v0(l,qi,Tc)5bl1clqiTc, (3)
g(l,qi,Tc)5dl1elqiTc, (4)
where the temperature, Tc, is in units of Kelvin. The
ES96estimated band-dependent coefficientsal,bl,cl,
dl, andelare listed inTable 1. It should be noted that to obtain the correct asymptotic behavior forv0(l,qi,Tc)
andg(l,qi,Tc), for the cases whereqi.1023kg kg21,
FIG. 3. The 20 662 calculated values ofv0as a function of (a)Deffand (b) M3/M2, the mean
mass-weighted size,Dmmw, of the PSD. The key on the right-hand side of the figures is the
the values ofv0andgshould assume the same values as
v0 and g when qi 5 1023kg kg21. If this condition is
applied,v0andgshould never attain unphysical values. In B014b the above bulk optical properties are ex-pressed as functions ofqionly [i.e., Eqs.(4)–(7) in that
paper]. This is possible to do, as shown byFig. 2, and is equivalent to the parameterization proposed by
McFarquhar et al. (2003). In that paper, as previously stated, the IWC is explicitly derived as a function ofreff; in turn, the bulk optical properties are derived as a function of reff. Thus, reff can be eliminated between relationships to leave the bulk optical properties ex-pressed as a function of IWC only, which is equivalent toB014b.
The difference between the above parameterization and that ofB014bis highlighted by the following ex-ample. If we assume thatTc5190 K andqi51.0 3
1023kg kg21, Eq.(3)atES96shortwave band 5 (1.19– 2.38mm) givesv050.9015, while Eq. (6) fromB014b givesv050.8663. The former calculation is about 5% greater than the latter calculation, which means that in the former case the cirrus is about 27% less absorbing (i.e.,;12v0) than in the latter case. With such a dif-ference in shortwave absorption between the two pa-rameterizations, theB014b parameterization is clearly more likely to result in an increase in TTL temperature than Eq.(3).
In the introduction to this paper, it was noted that trigonal ice crystals were observed by a number of studies in the TTL. Single-scattering calculations based on trigonal ice crystals using the anomalous diffraction approximation (ADT) have been reported byMurray et al. (2015). These calculations show that v0 values
computed assuming trigonal columns can be as much as 20% higher than their equivalent hexagonal column counterparts for a range of crystal sizes they considered at an absorbing wavelength. If the TTL were composed mostly of trigonal columns, then this would imply less solar absorption and, as a consequence, less in-cloud heating, due to generally largerv0values, relative to Eq.
(3). However, ADT is a soft particle approximation (i.e., assumes real refractive indices near unity), originally due tovan de Hulst (1957); by using this approximation,
v0 values presented in Murray et al. (2015) may be overestimated (due to the neglect of reflection, re-fraction, and particle edge effects, which all tend to in-crease absorption; see, e.g., Mitchell et al. 2006). The latter limitations of ADT were noted by Murray et al. (2015), who also called for more accurate computations of the single-scattering properties of trigonal particles. On the other hand, if the TTL were composed of quasi-spherical particles as reported in some studies cited in the introduction to this paper, the calculatedv0values of these particles would tend to be lower (due to geo-metrical considerations and edge effects; seeBaran and Havemann 1999;Mitchell et al. 2006;Bi and Yang 2014) than that calculated for the equivalent trigonal particles. This implies more absorption, and so greater in-cloud heating in the TTL, assuming equal microphysics as-sumptions. This range in potential TTL in-cloud heating is indicative of the current uncertainties in the micro-physics composition within the TTL. Reducing un-certainty in calculatedv0values requires observations of PSDs, ice particle shapes, and application of electro-magnetic methods and not gross approximations such as ADT to observed TTL microphysics measurements.
The accuracy of the new parameterizations was tested by selecting an independent set of about 10 000qiand
Tcvalues taken from the ice optical property database
ofB014a. As before, the bulk optical properties, as a function of qi and Tc, are grouped into their ES96
bands. The test of accuracy of the new parameteriza-tions is based on the relative percent error,«(l), which is given by
«l5truel2estimatedl
truel 3100% , (5)
where in Eq.(5)trueland estimatedlare the actual bulk optical properties in the B014b database consisting of 2.986 3 106 values (i.e., 20 662 qi–Tc values 3 145
wavelengths210 000 randomly selected values) and the estimated values using Eqs.(2)–(4), respectively. Here, the accuracy of the parameterizations is illustrated using onlyES96shortwave band 5 (1.19–2.38mm), as all other bands have similar accuracies, and this band is important
TABLE1. The derived values of the band-dependent coefficients for each of theES96shortwave and longwave bands. The first six entries in the table are the shortwave bands and the following nine entries are the longwave bands.
Bandmm al bl cl dl el
0.20–0.32 1.6431011 1.0000 6.5310215 0.7560 0.0378
0.32–0.69 1.6631011 1.0000 21.431026 0.7804 0.0419
0.32–0.69 1.6431011 0.9999 26.431025 0.7860 0.0434
0.69–1.19 1.6431011 0.9996 20.0031 0.7897 0.0468
1.19–2.38 1.6531011 0.9817 20.4218 0.8208 0.1351
2.38–10.0 1.6031011 0.7500 20.2353 0.9130 0.1240
25.0–104 1.5031011 0.6300 20.2500 0.7129 0.6568
18.18–25.0 1.7531011 0.7700 20.2866 0.8356 0.3085
for the shortwave heating of cirrus in the TTL. The calculated normalized PDFs of «(l) are shown for
Kext(l,qi,Tc),Ksca(l,qi,Tc), andginFigs. 4a–c,
re-spectively.Figures 4a and 4bshow that«(l) in the mass parameterizations is within650% for about 90% and 94% of the independently selected database, re-spectively. Typically, the in situ measurement error in
Kext(l,qi,Tc) is usually650% (Baran et al. 2009), so the
relative error distribution shown in Figs. 4a and 4b is acceptable. Figure 4c shows«(l) for gand, as can be seen from the figure, «(l) is within 62.5% for about 83% of the database, which is also acceptable. Theo-retical and in situ uncertainty in the asymmetry param-eter value is far greater than the error in the g
parameterization (Ulanowski et al. 2006; Fu 2007;
Garrett 2008;Baran 2012;van Diedenhoven et al. 2014). We compare our parameterization ofgto theg param-eterization developed byFu (2007)by assumingqiand
Tcvalues of 1.031024kg kg21and 190 K, respectively.
In Fu (2007), g is parameterized in the shortwave by assuming hexagonal columns and hexagonal plates as a function of an effective AR by using either rough or smooth collections of particles. The range in the effec-tive aspect ratio given byFu (2007)represents the aspect ratios of monomer ice crystals that make up more complex ice crystals. Indeed, the effective AR of the ensemble model members assumed in this paper are 1.0, 0.42, and 0.42 (the first being the hexagonal ice column of AR51.0, and the latter two being the AR and av-eraged AR values found for the six-branched bullet rosette and the three monomer hexagonal ice aggregate, respectively), and the following weights of 0.50, 0.20, and 0.30 are assigned to the three ensemble members, respectively. The comparison is made by using the co-efficientsdlandeltabulated inTable 1atES96 short-wave band 1 (i.e., 0.20–0.32mm) and atES96shortwave band 3 (0.32–0.69mm). These two shortwave bands cover the wavelength range given in Fu (2007) for shortwave band 1 (i.e., 0.25–0.70mm) given in that pa-per. Although the comparison is not exact in terms of the wavelength range and assumed ice microphysics, it is considered sufficiently accurate for the purposes of this paper. Applying the above three effective AR ratios for each of the ensemble models to Eqs. (3.2) and (2.2) given inFu (2007), and weighting the calculated asym-metry parameter values by the three weights given above, we find a weighted value of 0.765 forg(i.e., 0.53 0.7310.2030.8010.330.80). ThisFu (2007) asym-metry parameter value compares to the values of 0.757 and 0.787 found forES96shortwave bands 1 and 3, re-spectively, and the average of these two values is 0.772. The averaged value is within about 1% of theFu (2007)
calculation, and the values calculated at the two ES96
shortwave bands are within about62% ofFu (2007). If we takeg50.765 andg50.787 (i.e., the most extreme difference) and assume that the cirrus is located over a dark ocean and conservative scattering, then the back-ward solar reflection is about 23.5% and 21.3%, re-spectively, where backward reflection ;(1 2 g). The difference in reflected shortwave flux is at most about 7 W m22, assuming an area-averaged incident solar flux of 330 W m22, at least for the case considered here. These differences found for thegparameterizations are far less than the range in g found by several studies (Ulanowski et al. 2006;Fu 2007;Garrett 2008;Baran 2012;van Diedenhoven et al. 2014;Yang et al. 2015). Indeed, in the case ofUlanowski et al. (2006), experi-mentally derivedgvalues were found to vary between 0.8060.04 and 0.6360.05 for smooth and rough ice analog rosettes, respectively, and this difference results in a shortwave flux uncertainty of about 256 W m22. Furthermore, the calculated asymmetry parameter values using the two parameterizations compare well against radiometrically derived asymmetry parame-ter values using POLDER observations from van Diedenhoven et al. (2014). The observations from POLDER were located over the north coast of Aus-tralia. In that paper, at aTcvalue of about2858C, the
asymmetry parameter values are shown to vary between about 0.7460.02 and 0.7960.04, which encompass the values ofg, derived using the two completely different parameterizations. These experimental results obtained at 0.865mm were roughly coincident with the three as-sumed shortwave bands used in the comparisons, and the imaginary index of ice is very weakly absorbing at all of the chosen shortwave bands as shown inB014b. At least at TTL temperatures, the parameterizedgvalues derived in this paper appear representative of other in-dependent derivations of g. However,g is one of the bulk ice optical properties that is important to constrain in climate models, as noted byStephens et al. (1990). In this paper, we are concerned about TTL heating and specific humidity errors in a climate model, and these errors are more associated with the parameterizations found forKext(l,qi,Tc) andv0(l,qi,Tc).
Equations (2) and (3) are now compared against the equivalent parameterizations developed byB014b. The parameterizations ofgare not compared here as the results are not sufficiently different. In comparing the parameterizations a constant value ofqiis assumed, with
its value being 1.031025kg kg21, while the temperature is allowed to vary between2808and 08C. The compar-isons are shown inFigs. 5a–catES96shortwave band 5 forKext(l,qi,Tc), the coalbedo [i.e., 12v0(l,qi,Tc)],
andKabs(l,qi,Tc) [i.e.,Kabs(l,qi,Tc)5Kext(l,qi,Tc)2
FIG. 4. The normalized PDFs of the relative percent error in the parameteri-zation of (a)Kext(l,qi,Tc), (b)Ksca(l,qi,Tc), and (c)g(l,qi,Tc). Relative percent
similar results to Figs. 5a–c and are not shown here for reasons of brevity.Figure 5ashows that atTcvalues
of about 2808C, the nonlinear parameterization of
Kext(l,qi,Tc) is about a factor of 2.5 greater than that
predicted by B014b. This means that at typical TTL temperatures, the new parameterization, relative to
B014b, will transmit less longwave terrestrial radiation to space through the cirrus, which will result in less longwave absorption by trace gases above the TTL cirrus, conse-quently lowering TTL temperatures through emission at cold temperatures. Also critical to the TTL temperature is the coalbedo. The coalbedo comparisons are shown in
Fig. 5b; again, the figure shows that atTc5 2808C, the
new parameterization coalbedo is less than B014b by almost a factor of 7. This change in absorption between the parameterizations is shown clearly inFig. 5c, which showsKabs(l,qi,Tc), and at Tc5 2808C, the new
pa-rameterization is almost 3 times less absorbing than
B014b. The comparisons show that the temperature-dependent parameterization in the TTL should result in less cirrus heating relative to B014b. The next section presents the impact of these different heating profiles on the simulation of the TTL in an atmosphere-only climate integration using the MetUM.
3. The impact of the parameterizations on the simulation of the TTL
To assess the fidelity of the TTL simulation in models using theB014bparameterization and the parameteriza-tion described in section 2, we perform a pair of 20-yr atmosphere-only climate simulations using each parame-terization. Apart from the formulation of the ice cloud optical properties, these simulations each use an identical baseline of the Global Atmosphere 6.0 (GA6.0) configu-ration of the MetUM. GA6.0 is the atmospheric compo-nent of the global coupled model 2.0 configuration as described byWilliams et al. (2015), so a description is not repeated here. The simulations are performed at a hori-zontal resolution of N96 (;135 km in the midlatitudes) and use a vertical level set with spacings of between 500 and 700 m in the TTL region with a model ‘‘lid’’ at 85 km from the surface. The simulations run from December 1988 to November 2008 and use prescribed (but time varying) sea surface temperatures, greenhouse gas con-centrations, and aerosol emissions while roughly following the protocol of the Atmospheric Model Intercomparison Project (AMIP;Taylor et al. 2012). Results are presented for the meteorological season December–February (DJF), as this season represents the period during which cirrus occurrence in the tropics is at a maximum (Sassen et al. 2008). The climate model predictions are compared against the ERA-Interim reanalysis temperature product
(Dee et al. 2011) and the Modern-ERA Retrospective Analysis for Research and Applications (MERRA) specific humidity product (Rienecker et al. 2011). The impacts of the parameterizations on the 20-yr averaged DJF cloudy shortwave and longwave radiative effects at TOA are compared against the Loeb et al. (2009) re-analysis of the Clouds and the Earth’s Radiant Energy System (CERES) product.
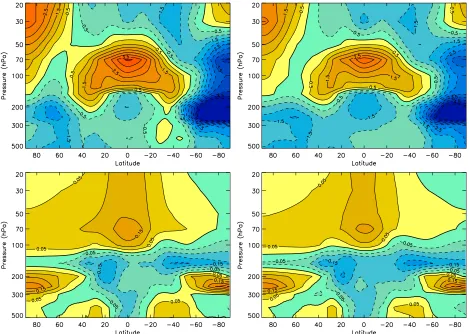
First, the DJF zonally averaged temperature differ-ences between the B014b parameterization and the ERA-Interim reanalysis are shown inFig. 6 (top left), while the same differences are shown inFig. 6(top right) but for the new parameterizations. It is clear fromFig. 6
(top right), relative to Fig. 6 (top left), that the new parameterizations have reduced the TTL temperature by about 1 K, and generally throughout the tropics, which is consistent with the discussion surrounding
Figs. 5a and 5b. In addition, the new parameterization has also removed the warming in the southern sub-tropical troposphere region by about 1–2 K, and reduced cooling and warming over the South and North Poles, respectively. On the negative side, the new parameter-izations lead to a cooling of the tropical troposphere by about 1 K, and to a similar cooling at altitudes between about 15 and 30 hPa, which occurs near the equator.
The impact of the new parameterizations on the model bias of zonally averaged log10(specific humidity), relative to MERRA, is shown inFig. 6(bottom right). The figures show that the impact of the new parame-terizations on the log10(specific humidity) model bias in the TTL is to reduce it, and its distribution throughout the TTL, especially around the equatorial region. Rel-ative to the B014b parameterization, shown in Fig. 6
(bottom left), the new parameterization reduces the log10(specific humidity) model bias in the TTL by about 0.1 log10(kg kg21) and generally reduces the extent of this bias in the subtropics. For each panel shown inFig. 6, the grid point root-mean-square (RMS) errors were calculated over the region between 208S and 208N, and between 150 and 70 hPa. The resulting RMS errors were found to be 2.52, 1.90 K, and 0.13 and 0.12 log10(kg kg21), respectively. Therefore, in the TTL region, the new pa-rameterization reduces the zonally averaged temperature and specific humidity biases in the model.
shown by the reduction in the area-weighted RMS error by 1.08 W m22, and this improvement is especially evident in the tropics. Note also the reduction in bias brought about by the new parameterization throughout the Southern Ocean. The longwave biases in the climate model are also reduced by the new parameterizations as shown inFigs. 7c and 7d, where it can be seen that the area-averaged RMS error is reduced by 0.41 W m22. The significant longwave negative biases around the warm pool shown inFig. 7chave been reduced by the new pa-rameterizations by up to about 20 W m22, as demon-strated byFig. 7d.
Table 2shows a comparison between theStephens et al. (2012)estimated CERES global means for seven variables together with their estimated standard deviation6s, and theB014band temperature-dependent parameterizations. The table shows that the temperature-dependent param-eterization is within the estimated uncertainty for six out of seven of the global mean variables shown inTable 2. This improves on theB014bparameterization, which has
four out of seven variables within the estimated un-certainty. In particular, the B014b parameterization significantly underestimates the reflected shortwave flux at TOA. As a result of this underestimation, the predicted shortwave radiative effect is too low relative to the CERES estimated mean. The temperature-dependent parameterization does predict adequate reflected short-wave flux at TOA, but the prediction of the shortshort-wave radiative effect is just over 1sfrom the CERES estimated mean. This compares to about 13/4s from the estimated
mean found for theB014bparameterization. The reason for this discrepancy between the parameterizations and the CERES observations for this variable is probably due to, in the case ofB014b, the mass extinction coefficient being underestimated at about temperatures, 2408C, as can be seen fromFig. 5a, relative to the temperature-dependent parameterization. In the case of the temperature-dependent parameterization, the physical reasons for this underestimation could be that 1) there is too little ice mass being predicted by the model cloud
FIG. 6. The 20-yr DJF zonally averaged (top) temperature and (bottom) log10(specific humidity) differences. The differences are
[image:14.567.49.518.61.395.2]scheme and/or 2) the model asymmetry parameter is too large. It is yet to be seen which of these reasons might account for the discrepancy in the shortwave radiative effect. However, in general, the new parameterization presented within this paper improves the model perfor-mance, relative toB014b, in terms of the shortwave and longwave cloudy radiative effect as can be seen from
Figs. 7b–d, but also the predictions of model global mean fluxes.
4. Conclusions
A cirrus bulk optical property parameterization has been presented, and it has been demonstrated that the parameterization reduces zonally averaged temperature biases in the TTL of GA 6.0 by about 1–2 K relative to theB014b parameterizations. The parameterization of the asymmetry parameter was compared against an in-dependent parameterization and was shown to be within about 1% and62% of the latter parameterization at
ES96shortwave bands 1 and 2, respectively. Moreover, the asymmetry parameters predicted by both parame-terizations were shown to encompass space-based esti-mations ofgfrom observations from around the north
FIG. 7. The annual 20-yr TOA cloud radiative effect differences between MetUM configuration 6.0 and the CERES products. Results are shown for the shortwave while assuming the (a)B014bparameterization and (b) new parameterization. The longwave results are shown while assuming the (c)B014bparameterization and (d) new parameterization. The area-averaged root-mean-square difference is shown in each of the panels, and differences are in units of W m22.
TABLE2. CERES means obtained fromStephens et al. (2012)
compared against the MetUM configuration 6.0 means predicted using theB014bparameterization and the temperature-dependent parameterization. All flux units [shortwave (SW) and longwave (LW)] are in W m22. Asterisks denote that the predicted variable is
within the current CERES measurement uncertainty, CF denotes cloud forcing.
Variable Observation B014b Temperature-dependent
Outgoing SW 10062 97.58 99.66* Outgoing LW 239.763.3 240.53* 239.52* Absorbed SW 240.262 242.80 240.73* Albedo TOA 29.4161 28.67* 29.28* SW CF 247.563 242.18 244.23
LW CF 26.764 23.88* 24.74*
coast of Australia at TTL cirrus temperatures of2858C. The reason for this improvement in climate model per-formance is through coupling the bulk optical properties toqiandTc. At the low temperatures in the TTL, the
B014b parameterization will underpredict the single-scattering albedo, resulting in TTL warming due, in part, to the absorption of shortwave radiation, highlighting the importance of wavelengths in the near-infrared. The new temperature-dependent parameterization also im-proves, relative toB014b, on representing the model’s prediction of the shortwave and longwave cloudy radi-ative effect as well as global flux means. To improve climate model representations of the TTL, more careful consideration should be given to the calculation of ice optical properties, especially the mass extinction co-efficients and single-scattering albedo, which are the bulk ice optical properties that principally determine the temperature and specific humidity distributions in our simulations of TTL cirrus. Further observations of cirrus PSDs, IWCs, habits (in addition to humidity and tem-perature measurements), and solar and infrared radia-tive properties in the TTL should be considered a priority.
Acknowledgments.The work of Steven C. Hardiman was supported by the joint DECC/Defra Met Office Hadley Centre Climate Programme (GA01101). Three reviewers are thanked for their contributions to this paper.
REFERENCES
Baran, A. J., 2009: A review of the light scattering properties of cirrus.J. Quant. Spectrosc. Radiat. Transfer,110, 1239–1260, doi:10.1016/j.jqsrt.2009.02.026.
——, 2012: From the single-scattering properties of ice crystals to climate prediction: A way forward.Atmos. Res.,112, 45–69, doi:10.1016/j.atmosres.2012.04.010.
——, and S. Havemann, 1999: Rapid computation of the optical properties of hexagonal columns using complex angular mo-mentum theory.J. Quant. Spectrosc. Radiat. Transfer,63, 499– 519, doi:10.1016/S0022-4073(99)00035-7.
——, and L.-C. Labonnote, 2007: A self-consistent scattering model for cirrus. 1: The solar region.Quart. J. Roy. Meteor. Soc.,133, 1899–1912, doi:10.1002/qj.164.
——, P. J. Connolly, and C. Lee, 2009: Testing an ensemble model of cirrus ice crystals using mid-latitude in situ estimates of ice water content, volume extinction coefficient, and the total solar optical depth.J. Quant. Spectrosc. Radiat. Transfer,110, 1579–1598, doi:10.1016/j.jqsrt.2009.02.021.
——, A. Bodas-Salcedo, R. J. Cotton, and C. Lee, 2011a: Simu-lating the equivalent radar reflectivity of cirrus at 94 GHz using an ensemble model of cirrus ice crystals: A test of the Met Office global numerical weather prediction model.Quart. J. Roy. Meteor. Soc.,137, 1547–1560, doi:10.1002/qj.870. ——, P. J. Connolly, A. J. Heymsfield, and A. Bansemer, 2011b:
Using in situ estimates of ice water content, volume extinction coefficient, and the total solar optical depth obtained during
the tropical ACTIVE campaign to test an ensemble model of cirrus ice crystals.Quart. J. Roy. Meteor. Soc.,137, 199–218, doi:10.1002/qj.731.
——, R. Cotton, K. Furtado, S. Havemann, L.-C. Labonnote, F. Marenco, A. J. Smith, and J.-C. Thelen, 2014a: A self-consistent scattering model for cirrus. Part II: The high and low frequencies.Quart. J. Roy. Meteor. Soc.,140, 1039–1057, doi:10.1002/qj.2193.
——, P. Hill, K. Furtado, P. Field, and J. Manners, 2014b: A cou-pled cloud physics–radiation parameterization of the bulk optical properties of cirrus and its impact on the Met Office Unified Model Global Atmosphere 5.0 configuration.
J. Climate,27, 7725–7752, doi:10.1175/JCLI-D-13-00700.1. Bi, L., and P. Yang, 2014: High-frequency extinction efficiencies of
spheroids: Rigorous T-matrix solutions and semi-empirical approximations.Opt. Express,22, 10 270–10 293, doi:10.1364/ OE.22.010270.
Corti, T., B. P. Luo, Q. Fu, H. Vömel, and T. Peter, 2006: The impact of cirrus clouds on tropical troposphere-to-stratosphere transport. Atmos. Chem. Phys., 6, 2539–2547, doi:10.5194/acp-6-2539-2006.
Cotton, R., S. Osborne, Z. Ulanowski, E. Hirst, P. H. Kaye, and R. S. Greenaway, 2010: The ability of the Small Ice Detector (SID-2) to characterize cloud particle and aerosol morphol-ogies obtained during flights of the FAAM BAe-146 research aircraft.J. Atmos. Oceanic Technol.,27, 290–303, doi:10.1175/ 2009JTECHA1282.1.
——, and Coauthors, 2013: The effective density of small ice par-ticles obtained from in situ aircraft observations of mid-latitude cirrus.Quart. J. Roy. Meteor. Soc.,139, 1923–1934, doi:10.1002/qj.2058.
Dee, D. P., and Coauthors, 2011: The ERA-Interim reanalysis: Configuration and performance of the data assimilation system.
Quart. J. Roy. Meteor. Soc.,137, 553–597, doi:10.1002/qj.828. Delanoë, J., and R. J. Hogan, 2010: Combined
CloudSat-CALIPSO-MODIS retrievals of the properties of ice clouds.
J. Geophys. Res.,115, D00H29, doi:10.1029/2009JD012346. Deng, M., G. G. Mace, Z. Wang, and H. Okamoto, 2010: Tropical
Composition, Cloud and Climate Coupling Experiment vali-dation for cirrus cloud profiling retrieval using CloudSat radar and CALIPSO lidar. J. Geophys. Res., 115, D00J15, doi:10.1029/2009JD013104.
Edwards, J. M., and A. Slingo, 1996: Studies with a flexible new radiation code. I: Choosing a configuration for a large-scale model.Quart. J. Roy. Meteor. Soc.,122, 689–719, doi:10.1002/ qj.49712253107.
——, S. Havemann, J.-C. Thelen, and A. J. Baran, 2007: A new parameterization for the radiative properties of ice crystals: Comparison with existing schemes and impact in a GCM.
Atmos. Res.,83, 19–35, doi:10.1016/j.atmosres.2006.03.002. Field, P. R., and A. J. Heymsfield, 2003: Aggregation and scaling of
ice crystal size distributions. J. Atmos. Sci., 60, 544–560, doi:10.1175/1520-0469(2003)060,0544:AASOIC.2.0.CO;2. ——, ——, and A. Bansemer, 2006: Shattering and particle
inter-arrival times measured by optical array probes in ice clouds.
J. Atmos. Oceanic Technol., 23, 1357–1371, doi:10.1175/ JTECH1922.1.
——, ——, and ——, 2007: Snow size distribution parameterization for midlatitude and tropical ice clouds.J. Atmos. Sci.,64, 4346– 4365, doi:10.1175/2007JAS2344.1.
Fu, Q., 2007: A new parameterization of an asymmetry factor of cirrus clouds for climate models.J. Atmos. Sci.,64, 4140–4150, doi:10.1175/2007JAS2289.1.
Furtado, K., P. R. Field, R. Cotton, and A. J. Baran, 2015: The sensitivity of simulated high clouds to ice crystal fall speed, shape and size distribution.Quart. J. Roy. Meteor. Soc.,141, 1546–1559, doi:10.1002/qj.2457.
Garrett, T., 2008: Observational quantification of the optical properties of cirrus cloud. Light Scattering Reviews 3, A. Kokhanovsky, Ed., Springer, 3–26.
Hardiman, S. C., and Coauthors, 2015: Processes controlling tropical tropopause temperature and stratospheric water va-por in climate models.J. Climate,28, 6516–6535, doi:10.1175/ JCLI-D-15-0075.1.
Heymsfield, A. J., 1986: Ice particles observed in a cirriform cloud at 2838C and implications for polar stratospheric clouds.
J. Atmos. Sci.,43, 851–855, doi:10.1175/1520-0469(1986)043,0851: IPOIAC.2.0.CO;2.
Holz, R. E., and Coauthors, 2016: Resolving ice cloud optical thickness biases between CALIOP and MODIS using infrared retrievals.Atmos. Chem. Phys.,16, 5075–5090, doi:10.5194/ acp-16-5075-2016.
Hong, Y., and G. Liu, 2015: The characteristics of ice cloud prop-erties derived fromCloudSatandCALIPSOmeasurements.
J. Climate,28, 3880–3901, doi:10.1175/JCLI-D-14-00666.1. Houze, R. A., P. V. Hobbs, P. H. Herzegh, and D. B. Parsons, 1979:
Size distributions of precipitation particles in frontal clouds.
J. Atmos. Sci.,36, 156–162, doi:10.1175/1520-0469(1979)036,0156: SDOPPI.2.0.CO;2.
Jensen, E. J., and Coauthors, 2008: Formation of large (;100mm) ice crystals near the tropical tropopause.Atmos. Chem. Phys.,
8, 1621–1633, doi:10.5194/acp-8-1621-2008.
——, and Coauthors, 2016: The NASA Airborne Tropical Tro-popause Experiment (ATTREX): High-altitude aircraft measurements in the tropical western Pacific.Bull. Amer. Meteor. Soc., doi:10.1175/BAMS-D-14-00263.1, in press. Korolev, A. V., E. F. Emery, J. W. Strapp, S. G. Cober, and G. A.
Isaac, 2013: Quantification of the effects of shattering on air-borne ice particle measurements.J. Atmos. Oceanic Technol.,
30, 2527–2553, doi:10.1175/JTECH-D-13-00115.1.
Lawson, R. P., B. Pilson, B. Baker, Q. Mo, E. Jensen, L. Pfister, and P. Bui, 2008: Aircraft measurements of microphysical properties of subvisible cirrus in the tropical tropopause layer. Atmos. Chem. Phys., 8, 1609–1620, doi:10.5194/ acp-8-1609-2008.
Lee, J., P. Yang, A. E. Dessler, B.-C. Gao, and S. Platnick, 2009: Distribution and radiative forcing of tropical thin cirrus clouds.
J. Atmos. Sci.,66, 3721–3731, doi:10.1175/2009JAS3183.1. Letu, H., H. Ishimoto, J. Riedi, T. Y. Nakajima, C.-L. Labonnote,
A. J. Baran, T. M. Nagao, and M. Skiguchi, 2015: Investigation of ice particle habits to be used for ice cloud remote sensing for the GCOM-C satellite mission.Atmos. Chem. Phys. Discuss.,
15, 31 665–31 703, doi:10.5194/acpd-15-31665-2015.
Liou, K. N., 1986: Influence of cirrus clouds on weather and climate processes: A global perspective.Mon. Wea. Rev.,
114, 1167–1199, doi:10.1175/1520-0493(1986)114,1167: IOCCOW.2.0.CO;2.
——, 2005: Cirrus clouds and climate.McGraw-Hill 2005 Yearbook of Science & Technology, McGraw-Hill, 51–53.
Loeb, N. G., B. A. Wielicki, D. R. Doelling, G. L. Smith, D. F. Keyes, S. Kato, N. Manalo-Smith, and T. Wong, 2009: Toward optimal closure of the Earth’s top-of-atmosphere radiation budget.J. Climate,22, 748–766, doi:10.1175/2008JCLI2637.1.
Mace, G. G., Q. Zhang, M. Vaughan, R. Marchand, G. Stephens, C. Trepte, and D. Winker, 2009: A description of hydrometeor layer occurrence statistics derived from the first year of merged CloudSat and CALIPSO data.J. Geophys. Res.,114, D00A26, doi:10.1029/2007JD009755.
McFarquhar, G. M., A. J. Heymsfield, J. Spinhirne, and B. Hart, 2000: Thin and subvisual tropopause tropical cirrus: Obser-vations and radiative impacts.J. Atmos. Sci.,57, 1841–1853, doi:10.1175/1520-0469(2000)057,1841:TASTTC.2.0.CO;2. ——, S. Iacobellis, and R. C. J. Somerville, 2003: SCM simulations
of tropical ice clouds using observationally based parameter-izations of microphysics. J. Climate, 16, 1643–1664, doi:10.1175/1520-0442(2003)016,1643:SSOTIC.2.0.CO;2. Mitchell, D. L., A. J. Baran, W. P. Arnott, and C. Schmitt, 2006:
Testing and comparing the modified anomalous diffraction approximation. J. Atmos. Sci., 63, 2948–2962, doi:10.1175/ JAS3775.1.
——, P. Rasch, D. Ivanova, G. M. McFarquar, and T. Nousiainen, 2008: Impact of small ice crystal assumptions on ice sedi-mentation rates in cirrus clouds and GCM simulations. Geo-phys. Res. Lett.,35, L09806, doi:10.1029/2008GL033552. Murray, B. J., C. G. Salzmann, A. J. Heymsfield, S. Dobbie, R. R.
Neely III, and C. J. Cox, 2015: Trigonal ice crystals in Earth’s atmosphere. Bull. Amer. Meteor. Soc., 96, 1519–1531, doi:10.1175/BAMS-D-13-00128.1.
Rienecker, M. M., and Coauthors, 2011: MERRA: NASA’s Modern-Era Retrospective Analysis for Research and Applications. J. Climate, 24, 3624–3648, doi:10.1175/ JCLI-D-11-00015.1.
Sassen, K., and B. S. Cho, 1992: Subvisual-thin cirrus lidar dataset for satellite verification and climatological re-search. J. Appl. Meteor., 31, 1275–1285, doi:10.1175/ 1520-0450(1992)031,1275:STCLDF.2.0.CO;2.
——, M. K. Griffin, and G. C. Dodd, 1989: Optical scattering and microphysical properties of subvisual cirrus clouds, and cli-matic implications.J. Appl. Meteor.,28, 91–98, doi:10.1175/ 1520-0450(1989)028,0091:OSAMPO.2.0.CO;2.
——, Z. Wang, and D. Liu, 2008: Global distribution of cirrus clouds from CloudSat/Cloud-Aerosol Lidar and Infrared Pathfinder Satellite Observations (CALIPSO) measurements.
J. Geophys. Res.,113, D00A12, doi:10.1029/2008JD009972. Schwartz, M. C., and G. G. Mace, 2010: Co-occurrence statistics of
tropical tropopause layer cirrus with lower cloud layers as derived from CloudSat and CALIPSO data.J. Geophys. Res.,
115, D20215, doi:10.1029/2009JD012778.
Sourdeval, O., C.-L. Labonnote, A. J. Baran, and G. Brogniez, 2015: A methodology for simultaneous retrieval of ice and liquid water cloud properties. Part I: Information content and case study. Quart. J. Roy. Meteor. Soc., 141, 870–882, doi:10.1002/qj.2405.
Stephens, G. L., S.-C. Tsay, P. W. Stackhouse Jr., and P. J. Flatau, 1990: The relevance of the microphysical and radiative properties of cirrus clouds to climatic feedback.J. Atmos. Sci., 47, 1742–1753, doi:10.1175/1520-0469(1990)047,1742: TROTMA.2.0.CO;2.
——, and Coauthors, 2012: An update on Earth’s energy balance in light of the latest global observations.Nat. Geosci.,5, 691–696, doi:10.1038/ngeo1580.
Taylor, J., W. Randel, and E. J. Jensen, 2011: Cirrus cloud–temperature interactions in the tropical tropopause layer: A case study.Atmos. Chem. Phys.,11, 10 085–10 095, doi:10.5194/acp-11-10085-2011. Taylor, K. E., R. J. Stouffer, and G. A. Meehl, 2012: An overview of
CMIP5 and the experiment design.Bull. Amer. Meteor. Soc.,
93, 485–498, doi:10.1175/BAMS-D-11-00094.1.
Ulanowski, Z., E. Hesse, P. H. Kaye, and A. J. Baran, 2006: Light scattering by complex ice-analogue crystals.J. Quant. Spectrosc. Radiat. Transfer,100, 382–392, doi:10.1016/j.jqsrt.2005.11.052. van de Hulst, H. C., 1957:Light Scattering by Small Particles.Wiley,
544 pp.
van Diedenhoven, B., A. M. Fridlind, B. Cairns, and A. S. Ackerman, 2014: Variation of ice crystal size, shape, and asymmetry pa-rameter in tops of tropical deep convective clouds.J. Geophys. Res. Atmos.,119, 11 809–11 825, doi:10.1002/2014JD022385. Vidot, J., A. J. Baran, and P. Brunel, 2015: A new ice cloud
pa-rameterization for infrared radiative transfer simulation of cloudy radiances: Evaluation and optimization with IIR ob-servations and ice cloud profile retrieval products.J. Geophys. Res. Atmos.,120, 6937–6951, doi:10.1002/2015JD023462. Wang, L., and A. E. Dessler, 2006: Instantaneous cloud overlap
statistics in the tropical area revealed by ICESat/GLAS data.
Geophys. Res. Lett.,33, L15804, doi:10.1029/2005GL024350.
Westbrook, C. D., R. C. Ball, P. R. Field, and A. J. Heymsfield, 2004: Theory of growth by differential sedimentation, with application to snowflake formation.Phys. Rev. E,70, 021403, doi:10.1103/PhysRevE.70.021403.
Williams, K. D., and Coauthors, 2015: The Met Office global coupled model 2.0 (GC2) configuration.Geosci. Model Dev.,
8, 1509–1524, doi:10.5194/gmd-8-1509-2015.
Yang, P., K.-N. Liou, L. Bi, C. Liu, B. Q. Yi, and B. A. Baum, 2015: On the radiative properties of ice clouds: Light scattering, remote sensing, and radiation parameterization.Adv. Atmos. Sci.,32, 32–63, doi:10.1007/s00376-014-0011-z.
Yang, Q., Q. Fu, and Y. Hu, 2010: Radiative impacts of clouds in the tropical tropopause layer.J. Geophys. Res.,115, D00H12, doi:10.1029/2009JD012393.
Yi, B., P. Yang, B. A. Baum, T. L’Ecuyer, L. Oreopoulos, E. J. Mlawer, A. J. Heymsfield, and K.-N. Liou, 2013: Influence of ice particle surface roughness on the global cloud radi-ative effect. J. Atmos. Sci., 70, 2794–2807, doi:10.1175/ JAS-D-13-020.1.