Abstract— Data mining plays an essential role in the cropproduction. It is a major field for forecasting and analyzing the crop. The vital role of the cultivator is to know about the production of the crop. In the years before, forecasting was carried out by taking into account the cultivator’s previous experience on the selected area. The forecasting was the important criteria which should be solved by considering the data on hand. By using Data mining method, the enhanced selection can be done. Various Data Mining methods have been used for calculating the upcoming year's production. This investigation helps to recommend a model for forecasting the yield from the earlier data. For accomplishing and forecasting the yield association rule mining in data mining has been used. This helps to focus on implementing a system which may be used for forecasting the yield in the upcoming years. This research aims at presenting a detailed study by forecasting the yield using association rules in data mining technique for the chosen area in India. The results haveshown that the anticipated work done is working well in order to predict the production of the yield.
Keywords – Association rule mining, Data Mining, Agriculture, Forecasting production
I. INTRODUCTION
From the ancient days, agriculture was one of the important area. In Olden days, individuals develop their harvests from their own property and they fulfilled their requirements. Since each and everybody harvests and it is used by all living beings. The foods which are taken from the land helps to provide strong life. Because of the different inventions day by day, this agricultural growth is difficult. Nowadays there is lot of new inventions, so many artificial products got into the market and made the life less healthy. Present folks do not have any consciousness about harvesting the crops at particular time and place.
After making the detailed analysis of all these problems like weather forecast, temperature condition and considering many other factors, proper solution has not been found out for the technologies to overcome the situation. There are numerous ways in agricultural field in India for increasing the growth. Multiple ways has been found to raise as well as to expand the cultivation crop yield to find the crop quality.
Data mining supportsboth analyzing the data with different aspects as well as to consolidate it into valuable information. Data mining provides a investigating tool to evaluate data from various dimensions and to check the similarity already known. Data mining helps to find the relations among many fields in the form of huge databases.
Revised Manuscript Received on August 05, 2019.
Ms. M.C.S. Geetha, Assistant Professor, Department of Computer Applications, Kumaraguru College of Technology, Coimbatore, Tamilnadu, India.
(E-mail: [email protected])
The Information which is provided by the patterns and associations is transformed into knowledge. This final information about the crop production helps the farmers to recognize the crop losses and thus helps to prevent the losses in the upcoming years.
Currently the prediction of the Crop helps to solve the agricultural problem. All the farmers generally has to know the expectation of the yield based on his experience. In the initial days during forecasting the crop, the calculation was done after investigating farmer's previous experience on one particular crop. The Agricultural production always depends on forecasting weather conditions as well as by scheduling the harvest operation. Thisexamination emphases on the progress of the crop forecasting with the help of the association rule in data mining.
II. LITERATURE REVIEW 2.1. Some of the applications in Agriculture
2.1.1 Selection and Prediction of the Crop
In order to increase the production, suitable crop selection has to be made to decide which crop gives better yield. It can be determined by several factors such as the soil types and its structure, weather condition, layout of the district, crop forecasting, marketplace and other factors. Data Mining Methods such as Decision Trees and K-nearest neighbors helped the farmers to select the crop based on various factors. Selection the particular crop is based on the outcome of natural disasters such as starvations are made in the machine learning [20]. The researchers suggests how to make use of the artificial neural networks to make the crop selection with respect to the soil types and also climate conditions [9]. A plant nutrient management system has been constructed to meet the requirements of the soil and also to maintain productivity. It is built on the techniques of the machine learning to raise the crop yield[18]. Crop selection methods have been suggested to do crop selection with respect to forecasting[6].
2.1.2 Weather Forecasting
Agriculture generally depends on frequent rains for the purpose of cultivation. Therefore, an exact conditions of weather prediction can decrease the work done by farmers. Since the farmers do not have knowledge to access to the Internet, they have to depend on the tiny information existing with regard to weather reports. Latest weather
Constructing Model for Forecasting the
Production using the Classification Technique in
Data Mining for the District of Tamil Nadu
information is not accessible since the weather deviations happens over time. Researchers are functioning for the improvement of the correctness of climate forecasting by using a various types of algorithms. Mostly Artificial Neural networks are used for this cases. Likewise, for climate forecasting Support Vector Machines algorithm which is based on machine learning technique has been proposed [7]. These are few algorithms that haveexposedgood results compared to the conventional algorithms.
2.1.3 Smart Irrigation System
In India, rural sector occupies an enormous percentage of the water. The water in the ground level are reducing frequently and thereby global warming has made more changes in the climatic conditions. The water from the river is a big problem among different states all over India. Sensor based technology have been used in lot of companies for smart farming where it uses instruments to observe the level of water, content of nutrient, prediction of weather reports and also to forecast soil temperature. EDYN Garden sensor provides an example for absorbing the water [2]. Therefore, the minor land owners could not afford to such devices since it is of huge cost to use them. The machine learning principles are used for designing such smart devices. Smart irrigation system helps to record the nutrient content of soil by using the sensors and so it can be used for supplying fertilizers to the soil. Thus the labor cost can be reduced by the Indian farmers nowadays.
2.2. Related Work
Farming administration requests humble and exactvaluation techniques in order to forecast the yield of the rice in the preparation process [5]. The current study were to: [20] detect the artificial neural network (ANN) models which could effectively predict theyield of the rice for distinctconditions of the weather, [8] estimate the ANN model helps to show the relative deviations of developing parameters and [18] associate the usefulness of techniques of multiple linear regression by using the ANN.
Forecasting the crop on maize is prepared by using the multilayered feed forward network of Artificial Neural Network [10]. The maize data was taken as response variable and also for the power of the farm, consumption of pesticide and fertilizer forms the total human labour as predictors.The technique of Generalized Regression Neural Networks (GRNN) has been used for finding the agricultural crop production results [1]. It was found that this method was a noble technique for forecasting of the production of grain in the countryside areas. It was stated that this model is appropriate for the prediction of multivariate, multi-objectives and non-linear.
The model for forecasting the Crop framework was recognized and it was decided that the variables related to climatic conditions was not the important reasons of the yield of the corn, the harvest to some extent was extremely affected by embedding the practices, mostly by putting the right quantity of conception [17].The researcher estimatedthe improved k-Means clustering algorithm for forecasting the crop. [19]. Their outcomes and valuation revealed the association of improved k-Means over k-Means clustering algorithm and it was recognized that the improved
k-Means has attained the greater number of excellence clusters, right forecasting of the crop and maximum accurateness count.
A prototype was established for forecasting the harvest conditions of the sugarcane for the district of Coimbatore by means of reviewing conditions of the climate variable with respect to average daily high and low temperature, comparative humidity in the forenoon as well as in the afternoon and the total periodical rain occurred and the data being produced [11].
There are many varieties of rice in Bangladesh that are having various season for harvesting the crop[12]. We should have previous knowledge of the rainfall and temperature about how to produce the rice and get good yield. After that regression technique has to be educated in order to predict correct solution. Then there is temperature which provides undesirable outcome in producing the crop. The data in use tells that
Bangladesh agricultural research center provides seven attributes such as high and low temperature, humidity, rainfall, cloud coverage, speed of wind and sunlight. In earlier stage of processing the data, it was found that almost all the datasets was partitioned into three phases. The normal calculation by associating with different attributes is taken. For all the different varieties of rice is also considered.
The datasets related to agriculture field of soil has been examined in this paper and a group has been forecasted [13]. From the forecasting of the soil in the form of group has been recognized with the help of the Classification rule. In this paper, K-Nearest Neighbor and the Naïve Bayes algorithms are used for forecasting the production of the crop. In the upcoming work it was declared to generate better models by means of different classification techniques such as principal component analysis,etc.
In this paper [14] it was declared about the importance of producing the crop and forecasting it to help the nation to make decision in agricultural field. Here a structure called extensible crop yield prediction framework was developed. This framework provides easily including all the different techniques for the purpose of crop yield forecasting. An implementation for the forecasting of the yield was developed to help the people by using dependant and independent variables.
In this paper, Machine Learning was given the importance in the field of artificial intelligence which paves way for the vast collection of fields with respect to the predicting the weather conditions and pattern recognition, [15] Agriculture is mainly used by considering all these techniques which has been largely used. Crop infection and forecasting the yield and weather and also smart irrigation system are the various fields of agriculture where the machine learning techniques has been used and it is proved to be of massive help if it is applied properly.
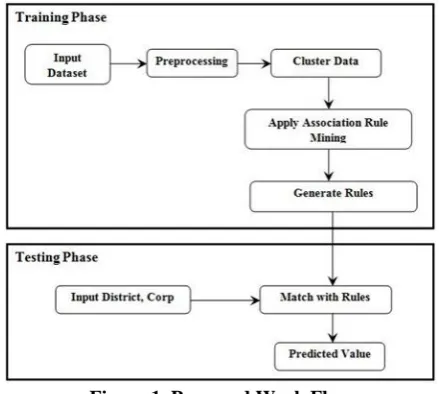
agricultural field. Data Mining helps to investigate wide variety of data sets and also found functional classifications and patterns from the data sets. The general objective of this procedure is to take the data from the large data set and thereby translating it into logical organization for future use. In this paper, the crop productionare evaluated by considering the already existing data. The various data mining techniques have been used in order to estimate the crop yield and thereby increasing the crop productivity. The following figure 1 shows the proposed work flow for forecasting the crop yield.
Figure 1. Proposed Work Flow 3.1 Overview of Dataset
First and foremost step is to bring all the together. The data from 2010 to 2016 are taken for the Tamil Nadu district in India. After the data is collected, each area is recognized by their individual position of the region.
The following dataset have nine different input variables. The variables are District, Year, Area, Crop, Yield, Production, Open Wells, Bore Wells and Tanks. Table 1 displaysdescription of the data set of the different variables.
Variable Description
District The 25 districtsdata is collected
Year
The data has been taken for the years 2010-2016
Area Area in Hectares.
Crop
Plants like a Kambu, Ragi, Paddy and Cholam etc.
Yield Kilogram per hectare Productio
n Year in Metric Tons Open
Wells Number in particular district Bore
Wells No of Bore Wells in particular district Tanks No of Tanks in a particular district
Table : 1 Data Set Description 3.2 Methodology
This paper consists of 2 different phases such as thephase for Training as well as the phase for testing. In the first training phase, the necessary data from different area have
been collected and after which preprocessing has to be done. Later when the pre-processing is done, all the collected data has been put together by means of k-means clustering technique. There is association rule mining method applied on the grouped data in order to locate the rules. Many rules are generated after the application of the association rules. In the testing phase, when the district is given as the input, the yield of the crop has been estimatedwith respect to the rules generated.
The work always starts from the preprocessing step by keeping the necessary data and removing the unwanted data which is not suitable for the production of the crop.
3.3 Data Clustering
In this technique, the data which is preprocessed has been grouped by means of k-means clustering algorithm. This technique is one of the common clustering algorithm that is very useful for combining the data. The value of khere tells that the entire number of clusters used for partitioned data. Generally the clusters can be denoted with the centers for each cluster. In this clustering technique, each and every sample is verified whether it is nearer to the center of its cluster. If it is not nearer, then the partitioning is to be changed till the sample data becomes nearer to the center. The distance function among the sample data helps to know a sample data transferred from one cluster to another cluster which depends on the values provided.
3.4 Data Conversion
The data after clustering has been changed to 0 and 1 in the association rule mining. The different data variables such as yield, area, open wells, production, bore wells and tanks are changed to High, Medium and Low. The outcome of the clustering will be changed for each variables such as area, open wells etc. High, Medium and Low are specified for all the variables. Eg: tank Low, tank Medium, tank High, etc.
3.5 Association Rule Mining
After the data is collected and made convertion on the data,this technique is used. Here rules has beenformedby considering frequent pattern mining. This rules is used to classify the relationship among dissimilarset of items in a database [19].The association rule mining helps to reduce the frequent items. This mining techniqueconsists of twosteps:
First to find out all the common items as determined with the minimum support.
Second is to producesolid association rules that satisfy minimum support and minimum confidence.
Figure 2. Data Conversion of Cluster-1 IVEXPERIMENTAL RESULTS
This work which is proposed is verifiedwith various collected data of agriculture which is attained from 2010 to 2016. The data is from 25 district all over Tamil Nadu. It has 11000 records. Table 1 display the explanation for the data set of agriculture. Table 2 explains about the model dataset.
Yea
r District Crop Area
Tan ks
Bore Wells
Open Wells
Product ion
Yiel d 201
0 Ariyalur Paddy
1328 54
7795
2 10267 46445 435498
327 7 201
1 Tiruchy
Chola m
3367
1 4945 4117 44052 19289 572
201 2
Kancheepu ram
Cumb u
2729 3
1424
5 38472 75240 10773 394
201
3 Namakkal Ragi 4494
1023
0 146 82024 6906
153 6 201
4
Dharmapur
i Maize
1378
4 235 9102 70063 25638
185 9 201
5
Kanyakum ari
RedGr
am 364 554 19607 96355 196 539
201
6 Krishnagiri Chillie
s 2132 7052 18806 31766 3604
168 9 Table 2: Sample Data Set
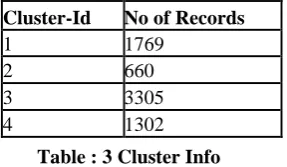
The data collected was pre-processed after removing the outliers. Hence the data only has 9000 records. First pre-processing step is made, then the data set it will be clustered with respect to the water level such as Bore Well, Tanks and Open Well by means of k-means clustering algorithm. Here the k value has been set as four. The data set has been grouped into 4 different clusters. Table 3 displays the cluster number along with the record count of each cluster.
Table : 3 Cluster Info
The data from various clusters aretransformed into dual values. Here the Figure 2 displays the data after convertion of cluster-1. Then for each different cluster, the frequent pattern has been mined with the help of minimum support
[image:4.595.315.536.92.332.2]of 0.3. Then the Table4 displays the frequent pattern numbers for separate cluster.
Table 4 Frequent Pattern in Each Cluster
Frequen
t_n Frequent Pattern Support
1 arMed 0.992
2 arMed, prMed 0.981
3 arMed, prMed, yMed 0.962
4 arMed, boMed, prMed, yMed 0.815
5
arMed, taMed, boMed,
prMed, yMed 0.680
6
arMed, taMed, boMed,
weMed, prMed, yMed 0.548
Table : 5 Frequent Pattern with High Support Table 5 displays the support count which is high with frequent patterns. Hence there are nearly 148 dissimilar frequent patterns which is recognizedwith respect from all the differentform of clusters and these frequent patterns produce 191 dissimilar association rules consideringthe minimum support count of 0.3 and the minimum confidence of 0.7.
Rule No Rule 1
[image:4.595.45.294.334.524.2]2 3 4 5 6 7
Table 6 Rules
Figure 3. Overall Accuracy and Error Rate Cluster-Id No of Records
1 1769
2 660
3 3305
4 1302
Cluster -Id
Number of
Frequent Pattern
Average Support
1 62 0.689
2 70 0.557
3 86 0.572
[image:4.595.313.542.449.693.2] [image:4.595.109.253.632.715.2]The crop yield prediction was done with respect to the generated rules. Generally the crop and the district wasgiven as input to the prediction model. Hence the Figure 3 displays the generalaccurateness and mistakes of the prediction result.
V CONCLUSION
The forecasting of the crop is still a stimulatingmatter for the agriculturalists. This research purposesis to recommend and produce a rule based system in order to forecast the yield of the crop with the help of past data collection. This has been attained by relating association rule mining on the data which is from 2010 to 2016.
VI. REFERENCES
1. Chaochong, J. M. (2008). Forecasting Agricultural Production via Generalized Regression Neural Network, IEEE.
2. Gupta, A. S. (2016). Need Of Smart Water Systems In India. International Journal of Applied Engineering Research, 2216-2223.
3. Hong-Ying L, Y.-L. H.-J.-M. (2012). Z.Crop yield forecasted model based on time series techniques. Journal of Northeast Agricultural University (English Edition).
4. J. Khazaei, M. R. (2008). Yield estimation and clustering of chickpea genotypes using soft computing techniques. Agron J 2008.
5. Ji, B. S., & Wan, J. (2007). Artificial neutral networks for rice yield prediction in mountainous regions. Journal of Agricultural science.
6. Kumar, R. M. (2009). Crop Selection Method to Maximize Crop Yield Rate Using Machine Learning
Technique. International Conference on Smart
Technologies and Management for Computing,
Communication, Controls, Energy and Materials, 1 (1). 7. M.Shashi, Y. a. (2009). Atmospheric Temperature
Prediction using Support Vector Machines. International Journal of Computer Theory and Engineering, 1 (1). 8. Miss.Snehal, S. D. (2014). Agricultural Crop Yield
Prediction Using Artificial. International Journal of Innovative Research in Electrical,Electronic, 1 (1). 9. Obua, W. O. (2011). Machine Learning Classification
Technique for Famine Prediction. Proceedings of the World Congress on Engineering, 2.
10. Prajneshu, R. K. (2008). Artificial Neural Network
Methodology for Modelling and Forecasting.
Agricultural Economics Research Review, 21, 5-10. 11. Priya SRK, S. K. (2009). A study on pre-harvest forecast
of sugarcane yield using climatic variables,Statistics and Applications. 1-8.
12. MotiurRahman M, Haq N, Rahman RM. (2014).
Application of data mining tools for rice yield prediction on clustered regions of Bangladesh. IEEE, 8–13. 13. Nisi, K., B. Nagaraj, and A. Agalya. "Tuning of a PID
controller using evolutionary multi objective
optimization methodologies and application to the pulp and paper industry." International Journal of Machine Learning and Cybernetics (2018): 1-11.
14. Monali Paul, Santosh K. Vishwakarma, AshokVerma (2015), ‘Analysis of Soil Behaviour andPrediction of Crop Yield using Data MiningApproach’, International
Conference on Computational Intelligence and
Communication Networks.
15. Aakunuri Manjula, Narsimha G.,(2015), ‘XCYPF: A Flexible and ExtensibleFramework for Agricultural Crop YieldPrediction’, Conference on Intelligent Systemsand Control (ISCO).
16. Karandeep Kaur, (2016),”Machine Learning
Applications in Indian Agriculture, International Journal of Advanced Research in Computer and Communication Engineering.
17. Agrawal, R. J. (1999). Mining the most interesting rules, in: Proceedings of the 1999. SIGKDD International Conference on Knowledge Discovery and Data Mining, 145-154.
18. Rossana MC, L. D. (2013). A Prediction Model
Framework for Crop Yield Prediction. Asia Pacific
Industrial Engineering and Management Society
Conference Proceedings Cebu, Phillipines, 185.
19. Shivnath Ghosh, S. K. (2014). Machine Learning for Soil Fertility and Plant Nutrient Management. International Journal on Recent and Innovation Trends in Computing, 2 (2), 292-297.
20. Utkarsha P, N. N.(2014). Evaluation of
Modified K-Means Clustering Algorithm in Crop prediction. International Journal of Advanced Computer Research., 1–1.
21. Washington Okori, J. O.(2011)
Machine Learning ClassificationTechniquefor Famine Prediction. Proceedings of the World Congress on Engineering.