1-1-1980
A mathematical model of the absorption,
distribution metabolism, and elimination of
benzene in the human body
Yung Ping Chin
Iowa State University
Follow this and additional works at:
https://lib.dr.iastate.edu/rtd
Part of the
Engineering Commons
This Thesis is brought to you for free and open access by the Iowa State University Capstones, Theses and Dissertations at Iowa State University Digital Repository. It has been accepted for inclusion in Retrospective Theses and Dissertations by an authorized administrator of Iowa State University Digital Repository. For more information, please contactdigirep@iastate.edu.
Recommended Citation
Chin, Yung Ping, "A mathematical model of the absorption, distribution metabolism, and elimination of benzene in the human body" (1980).Retrospective Theses and Dissertations. 18069.
---•
distribution, metabolism, and elimination of benzene
.£SJ/
;
9r,:;
q_.."f/'"';/
I
e,y
in the human body
by
Yung Ping· Chin
A Thesis Submitted to the
Graduate Faculty in Partial Fulfillment of the Requirements for the Degree of
MASTER OF SCIENCE
Major: Biomedical Engineering
Signatures have been redacted for privacy
Iowa State University Ames, Iowa
1980
TABLE OF CONTENTS
NOMENCLATURE iv
I. INTRODUCTION l
II. LITERATURE REVIEW 5
A. Absorp tion , Distribution and Elimination 5
B. Metabolism 10
C. Analytical Methods 13
D. Toxicology 14
E. Mathematical Model 16
III. MODEL DEVELOPMENT 20
A. Theoretical Basis 20
B. Model Equations 21
C. Data Used in the Model 25
IV. RESULTS AND DISCUSSION 28
A. Absorption, Distribution and Elimination of Benzene
in the Blood and Tissues for a Sing l e Exposur e 28
B. Repeated Exposure 42
C. Response of Metabolites in the Body 46
V. CONCLUSIONS AND RECOMMENDATIONS 54
VI. LITERATURE CITED 56
VII. ACKNOWLEDGMENTS 59
VIII. APPENDIX A. KINETICS OF METABOLISM OF BENZENE 60
IX. APPENDIX B. FORTRAN PROGRAM ON THE VAX- 11/ 780 SYSTEM 63
X. APPENDIX C. TRANSIENT RESPONSE OF BENZENE IN THE HUMAN
A.
Transient Response of Benzene (100 ppm) in a NormalPerson 67
B. Transient Response of Benzene (100 ppm) in " Working
Person 69
c.
Transient Response of Benzene (100 ppm) in an ObesePerson 70
D. Trapsient Response of Benzene (25 ppm) in a Normal
\
I
NOMENCLATURE
Rate constant of the reaction benzene ~ phenol
Rate constant of the reaction phenol ~ catechol
Rate constant of the reaction catechol ~ hydroxyquinol
Rate constant of the reaction phenol ~ quinol
Flow rate (,/,/min)
QA .Alveolar ventilation (,/,/min)
QB Blood flow rate out of mixed venous pool (£/min)
t Time (min)
VA Alveolar volume of lung compartment ( £)
VB Blood volume (,/,)
VT Tissue volume (,/,)
x Concentration in liquid phase (ppm)
y Goncentration in gaseous phase (ppm)
A Partition coefficient
cr Lung shunt factor
Subscripts:
1 Denotes compartment of vessel rich group
2 Denotes comp?rtment of muscle group (MG)
3 Denotes compartment of fat group (FG)
a Denotes arterial
a' Denotes alveolar
ca Denotes metabolite catechol
hq Denotes metabolite hydroxyquinol
i, Denotes liver compartment
p Denotes lung compartment
ph Denotes me tabolite phenol
qu Denotes metabolite quinol
v Denotes venous pool
I. INTRODUCTION
Benzene,
c
6H6, i s a volatile, colorless, flannnable aromatichydro-carbon, which possesses a very characteristic odor. It is used principally as a chemical raw material in the synthesis of compounds
such as styrene (employed to manufacture the most widely used type of
synthetic rubber), phenol, dodecylbenzene (used in the preparation of
alkylarene-sulfonate detergent), nitrobenzene (for the synthesis of
aniline), cyclohexane (for the manufacture of adipic acid and caprolactam), nonylphenol and other products used in the preparation of nonionic
detergents, dichlorodiphenyltrichloroethane (D.D.T.), chlorobenzene, benzene hexachloride and maleic anhydride. Benzene is also
exten-sively used as a solvent in the preparation of paints and coatings,
particularly where good penetration and rapid evaporation or setting
are desired. Benzene is an excellent solvent for rubber, and therefore finds its way into numerous preparations such as rubber cement.
Inhalation of benzene vapor may r esult in acute or chronic poi-soning, depending upon the concentration of the vapor and the length of the exposure. The maximum acceptable concentration (MAC) of benzene
in air varies with both time and location. For the standard of the American Conference of Governmental Industrial Hygienists, the MAC of
benzene in air for an 8-hour day is set at 10 ppm. The body develops
no tolerance to benzene and any damage can be ct.m1Ulative and permanent. There is wide variation in the susceptibilities of individuals. Women
a concentration of 20,000 ppm causes death within a few minutes;
concentrations of 7 ,500 ppm are dangerous to life in onP-half t o onP hour.
Chronic benzene poisoning usually results from daily exposure to
an unsafe concentration of vapor over a prolonged period. If chronic
benze ne poisoning has begun, the effect may be indicated by a decrease
in the number of red blood corpuscl es, white blood corpuscles and
plat e l ets. Chronic benzene poisoning affects the blood-forming function
of the bone marrow. If bone marrow damage is sli ght , complete recovery
usually occurs after r emoval of the indi vidual from exposure to benzene . If the damage is severe, the poisoning is usually fata l, since no
method is known for restoring the ability of bone marrow t o
manufac-ture the necessary blood constituents.
Benzene enters the circulation system primarily through the
respiratory tract. The compound is distributed in the body organs and
varies with time elapsed after exposure . Approximate ly 50% of absorbed
benzene is excreted through the lung. The remainder is oxidized for the most part to phenol and polyphenols, which are then excr e ted as
conjugated products with sulfuric and glucuronic acid. Consequently,
the amount of ester sulfates in the urine, expressed as a percentage of the total amount of sulfate, increases with the inhalation of benzene
vapor and the concentration of urinary sulfate, has been used as an
index of exposure. The concentration of urinary phenols has been
The problem of the absorption and elimination of benzene in the human body was studied for the first time by Lehmann and his co-workers
in 1910. But up to the present, the majority of literature on this subject was limited to the empirical method, to interpret the response
from the experimental data, or to get a model by curve - fitting techniques.
Recently, mathematical phenomenological models have been adopted in research on anesthetic agents in the human body. However, simulation
research on benzene, which is widely used, is still lacking. The metabolic reaction of benzene in the human body is very complex. Due
to the toxicity of benzene, m:>st previous research on its metabolism is restricted to experimental animals, or to the pathological study of
poisoned humans . Kinetic studies on this reaction are still lacking.
The object of this research project is the development and refine-ment of a mathematical model for the absorption, distribution, metabolism
and elimination of benzene in the human body, using a digital computer
to simulate the transient response of benzene and its metabolites in
the various organs and tissues. The metabolic reaction is simulated under several assumptions. The kinetics of the metabolic reaction are also derived in the analytical method. In this research, we simulate
the case of exposure to a benzene concentration of 100 ppm. We have compared absorption and elimination of benzene for a hard- working
person and a resting person. We also compared the cases of an obese
person and a normal person under benzene exposure. The situation of repeated exposure, which is likely to happen in industry, has also been studied in this research. From the results derived from this
paper s , but also a prediction of the time necessary for benzene to be practically eliminated from the body. This is of importance in deter-mining the degree of work hazard and in reconmending working periods
II. LITERATURE REVIEW
Benzene has been recognized since 1897 as a toxic chemical which causes chronic poisoning, and over the years a very comprehensive
litera-ture on its industrial toxicology has deve loped. Published information
on human exposure is principally restricted to pathological studies on
poisoned humans, though metabolism and toxicology has been extensively
studied in experimental animals.
A. Absorption, Distribution and Elimination
Benzene vapor gains access to the circulation through the respira-tory tract. The absorption of benzene through the lungs is dependent on the solubility in blood, the permeability and volume of the lung,
the volumetric rate of ventilation, the volume and flow rate of blood
in the lung, the speed of absorption and the difference in concentration
of the vapors in the inhaled gas and in the blood. The concentration gradient determines the exchange in regard to direction and speed. The
greater the partial pressure of the vapor in the air, the more rapidly
the content in the blood increases. The speed of absorption and the degree of solubility are of great practical interest in the evaluation
of the toxic effect.
Schrenk, et al. (1941) studied the absorption, distribution and
elimination of benzene by body tissues and fluids, using dogs as
experimental subjects. They found that the initial rate of absorption
of benzene by the blood was extremely rapid, but final values were
concentration of benzene in air and the equilibrium blood concentra-tion of exposed animals. The coefficient of distribuconcentra-tion was reported as 6 .58 . As for the distribution of benzene throughout the body, it occurred rapidly, but equilibrium values were dependent on blood supply. The fat, bone marrow and urine contained approximately 20 times as much
benzene as blood, while benzene concentrations in muscle and vital
organs were about 1 to 3 times the blood concentration. The
elimina-tion occurred rapidly at first, but owing to the large amount of benzene
stored in the fat and the poor blood supply to the fat, elimination was not complete until about 137 hours after termination of exposure.
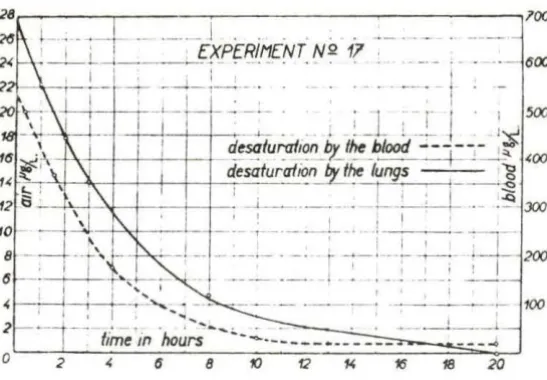
Srbova, et al. (1950) worked with 23 human subjects and got similar
results as those of Schrenk. The human subjects inhaled a mixture of
air and benzene vapor in concentrations of 150 to 350 µg per liter (47
to 110 ppm). They stated that the rate of absorption of benzene was
highest in the first few minutes of inhalation; afterwards it dropped
quickly (Fig . 1). During the test period, an equilibrium between blood and air level of benzene was not achieved. In the desaturation period,
30%-50% of the absorbed benzene was eliminated by the lungs, while the
quantity of benzene eliminated by the kidneys was insignificant (0.1-0.2%) and the elimination continued for a long time. Benzene which
was not excreted by the lungs or the kidneys remained in the body and
was metabolized.
Parke and Williams (1950, 1952) administered a single dose of 0 . 34-14
0.50 g/kg of C -benzene orally to rabbits. They discovered 84-89%
l 0
I '
8 10
· - 600
. · l .
-18 10
Fig. 1 . Average rates at which inhaled benzene is eliminated from the blood and the lungs
benzene and 1.5% as
c
14o
2. The elimination of the C 14o
2 began 12-18hours after administration of the benzene, and continued for several
days. The urine contained 34.5% of the original radioactivity, phenol accounting for 23.5%, quinol for 4.8%, catechol for 2.2%, hydroxyquinol
for 0.3% and trans-trans-muconic acid for 0.5%. These determinations
were based on samples collected over a 3-day period. After 3 days
5-10% of the original dose was still in the animal, distributed through-out the tissues.
Parke and Williams (1954) also applied radioactive l abeled
c
14-benzene to study the distribution of 14-benzene in rabbit tissues. A
total of 16% of the initial dose was recovered from the tissue one day after administration. The majority of the radioactivity was detected in
the voluntary muscle (57%) , the involuntary muscle (9%) and the blood
[image:13.582.148.422.72.262.2]Hunter (1968) reported that a steady rate of absorption of benzene
occurs quickl y after the start of an exposure, the time to attain this state and the proportion of the exposure dose absorbed being a re-flection of the individual and the energy expenditure. When exposure
ceased, there was a rapid fall in the concentration of benzene, but benzene could still be detected in exhalations up to 24 hours after
3 exposure with an instrument sensitive to 0.02 mg/m .
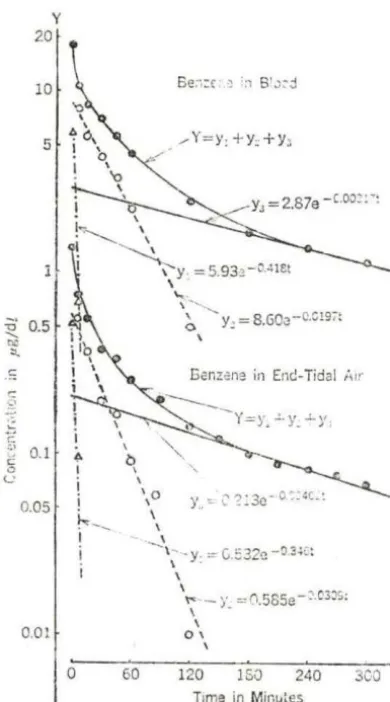
Sato, et al. (1975a, b) described the experimental human exposure of three male subjects inhaling 25 ppm of benzene. The results were
graphically resolved into a sum of three exponential components; that is for benzene in the blood:
y
=
5.93 e-0.418t + 8.60 e-0.0238t + 2.87for benzene in the end-tidal air:
-0 .00317t
e
Y
=
0.532 e-0 · 346 t+
0.585 e-0.0309t+
0.213 -0.00402t eFor this reason, they suggested an empirical three-compartment model for the absorption, distribution and elimination of benzene in the human body (Fig. 2).
Sato, et al. (1975a, b) also studied sex differences in the
susceptibility to chronic benzene intoxication with special reference
to body fat content. In an experiment with rats, they found that the rate of elimination of benzene was significantly lower in the fat males
than in the lean males (p
< 0.01) and also in the fat females than in
the lean females (p
<
0.05). In the experimental human exposure, theyy 20
10
5
~
c
~ 0.1
0
<.: 0.05
0.01
\
!.,..._ \
I ~
I \ y =5.93~ -CA!et
'
\., . \ ... .._.' n
r19-~ Y. = 8.GQr19-~--.v- ,:
\
Eanzcna in Ent!-Tidal ,;ir
"'
I0
\ 1
~--I
60
\
~
'; -y
"'C::32c-O::~c:
\
'~ -y =!'.l.585e-:'.C3:1S:
\
-\
0 \
\
120 15() 240 3CO t
Time in Min11tes
Fig. 2. Desaturation curves obtained from the human experimental expo-sure. Average concentrations in 3 subjects are plotted on a logarithmic scale against time (from Sato, et al., 1974)
in ma les than in females (p
<
0.005). After the cessation ofinhala-tion, the concentrations of benzene in both blood and end-tidal air began to decrease rapidly, with different rates between males and
females; the concentration was higher in males than in females after
the first 3 hours, and after 3 hours it was higher in females than in males (Fig. 3). TI\ey reasoned that since the human fat content is
much greater in females than in males (Keys and Brozek, 1953), that
[image:15.587.169.364.78.429.2]c
<.1
Ci i
..
v c ~
~o Y
O·S
O·I --.-Molt -·-c>- ·f ~m Ol l'
l' • . 1. ;000l'l8t
li1•00044ll
---.o
~-- l·/"1-'-l' s lb~o oomt
l11: 000••bl
~~~~~ ... ~~~~~~~~~~~~'
0
M 1nut~ 1 bO 1fol bO 120 l&Q H O JOO
I• lnholal!Oft I•
Fig . 3. Saturation and desaturation curves of benzene obtained from a human experimental exposure . The vertical line represents the
mean value
±
SD (s2=
mean square of deviation from linearregression)
volume which is much greater in females than in males, and that the
amount of absorbed benzene was not smaller in females than in males.
B. Metabolism
For many years studies have indicated a direct relationship between the level of benzene exposure and the level of total phenol excretion in the urine (Walkley, et al. , 1961). Roush and Ott (1977)
indicated that the urinary phenol levels of 52 employees exposed to
benzene vapor of less than
5
ppm showed a positive statisticallysignificant correlation with benzene exposure. Radojicia (1975)
was proportional to benzene exposure, and the correlation coefficient
of benzene exposure and urine phenol content was 0.78 .
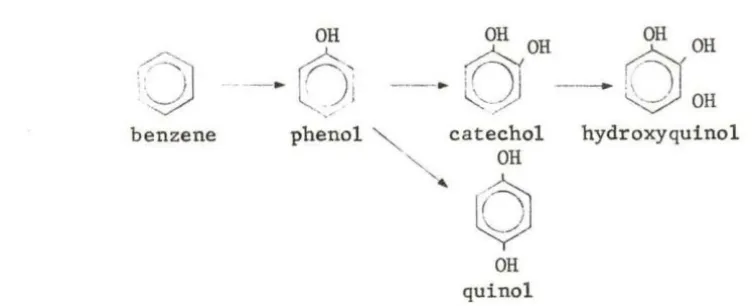
In other words, benzene, in part, is apparently converted to other forms of metabolites and is eliminated with urine. Tiie ma jor site of
conversion appears to be t he liver. The first major series of studies
on the metabolic fate of benzene in animal s was initiated in 1949 by Garton and Williams. They found that, following or a l administration of benzene in rabbits, 21% of the dose was excreted as phenols. Tiiis
con-sisted of a mixture of phenol, ca techol , quinol and hydroxyquinol. A small amount of nonaromatic material trans-trans-muconic acid, was a lso found
(Parke and Williams, 1952). Virtually all of the excreted phenols were conjugated either a s glucuronides or as e ther eal sulfates. Over 95% of
the phenol was elimina t ed during the first 2 days. During same period , only 60% of the dihydroxyphenols , catechol and quinol were eliminated . Tiie
hydroquinol elimination did not reach a maximum unti l the third day. It
was, therefor e , suggested that the dihydroxyphenols were subsequent tion products of phenol and that the trihydroxyphenol was an even later
oxida-tion product (Garton and Williams, 1949a, b) .
Ina series of experiments by Garton and Williams (1948, 1949a, b), phenol , catechol, resorcinol and quinol were administered to r abbits
via a stomach tube . Tiie urine was then examined for these compounds
and for other possible metabolites. In all cases, the major metabolites were conjugated monoglucuronides. Ethereal sulfates were a lso formed .
Only the urine of r abbits treated with catechol contained detectable
amount s of hydroxyquinol, even though it cou ld have been formed frrnn
e v ldenc<:, Porleo11H and Williams ( 1949) proposed the metabolic scheme
shown in Fig. 4.
OH OH OH
drOH
·~
-·
o~
., ,--·
0 -
~ OHbenzene phenol catechol hydroxyquinol
OH
'
0
JOH quinol
Fig. 4. Proposed in vivo benzene metabolic scheme
The metabolism in humans is apparently essentially the same as
that in other animals. Teisinger, et al. (1952) exposed human subjects to approximately 100 ppm (340 mg/l) level of benzene for 5 hours daily. It was observed that the average retention of inhaled vapor was 46.3%.
Of the retained benzene, approximately 12% was subsequently expired
unchanged and approximately 0.1-0.2% was excreted in urine. The
re-mainder was metabolized to various phenolic compounds previously described for animals.
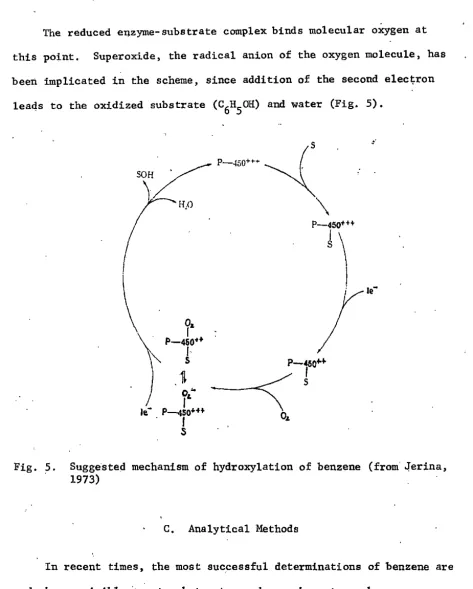
From the biochemistry viewpoint, the suggested mechanism of
hydroxylation of benzene is considered as follows (Jerina, 1973) :
The mono-oxygenases enzymes are found in the endoplasmic reticulum
of hepatic cells, the cytochrome P-450 system. Cytochrome P- 450 is the electron transport chain from liver . In essence, the oxidized form of
[image:18.583.63.441.125.278.2]The reduced enzyme-substrate complex binds molecular oxygen at this point. Superoxide, the radical anion of the oxygen molecule, has
been implicated in the scheme, since addition of the second elec~ron
leads to the oxidized substrate (C6H50H) and water (Fig. 5).
o.
I
P-450••I
s
,.
Fig. 5. Suggested mechanism of hydroxylation of benzene (from' o!erina, 1973)
C, Analytical Methods
In recent times, the most suc.cessful determinations of benzene are made by nonvisible ·spectropho.tometry and gas chromatography,
[image:19.589.47.520.53.642.2]offers the advantage of fewer steps in sample preparation and therefore fewer chances for anomalous results.
'
The usefulness of gas chromatography lies in its ability to separate components in a mixture before analysis. It is a technique of choice for determining benzene in the blood and tissues.and phenol in the urine, Benzene and other volatile compounds have been determined
in blood (Sato, et al., 1972, 1974) and in other fluids with this method,
Hunter (19~8) also used this method to distinguish phenol from cresols
during controlled exposures to· benzene vapor.
D.. Toxicology (Hamilton and Hardy, 1974)
1. Acute toxicity
The inhalation of a high concentration of benzene. vapor may cause exhilaration followed by drowsiness, 'fatigue, dizziness, headache and nausea. The pulse rate increases, there may be a sensation of tight-ness in the chest accompanied by breathlesstight-ness, and ultimately the victim may lose consciousness. Convulsions and tremors occur
fre-quently ·and death may follow in a few minutes or in several hours fol-lowing severe exposure. From experiments on animals exposed to high concentrations of benzene, epinephrine is known to sensitize the myo-cardium to the action ·of benzene, and ventricular fibrillation may be induced. Post-mortem finding in case of acute benzene exposure in-.·
Recovery from an acute exposure to benzene depends on the severity of the exposure. Breathlessness, nervous irritability and
unsteadi-ness in walking may persist in severe cases for two or three weeks. Chronic effects of acute benzene intoxication may arise and persist
long after the acute incident.
2. Chronic toxicity
The effects of inhaling small quantities of benzene vapor over a
prolonged period of time are of the greatest importance in the industrial
use of this hydrocarbon. These effects are probably due to the insidious injury to the blood-forming tissue at atmospheric concentrations which
may not cause irritation of mucous membranes or any unpleasant sensory effects.
Early symptoms of chronic exposure to benzene vapors are varied and vague and not specific for benzene exposure. They may consist of
headache, fatigue, dizziness, and loss of appetite. As the condition progresses, more specific signs of benzene intoxication become
mani-fest , such as bleeding from the nose, the gum and mucous membranes and
the development of purpuric spots and ecchymoses of the skin at the site of injury. The individual may complain of shortness of breath and
appear to be anemic. In addition, there may be a slight elevation in
temperature, a rapid pulse and a low blood pressure.
The most connnon persistent abnormalities in the blood of workers exposed to benzene are anemia and leukopenia. Many people believed leukopenia to be the earliest sign of chronic benzene intoxication.
poisoning., The bone marrow may be aplastic or hyperplastic and does not always correlate with peripheral blood findings indicating
hypo-or"hyperactivit:Y of the blood-forming tissue.
Chronic benzene intoxication may appear after a few weeks or many years of exposure, or even many years after the actual exposure
to benzene has ceased, and may prove fatal.
3. Therapy and control
The prevention of acute ail.d chronic benzene poisoning is based on control of levels of. benzene in .air. Convenient survey detector .tubes and other physicai instruments are available for measuring benzene
in ambient atmospheres. The recommended threshold limit value for benzene has dropped repeatedly in the last several decades, and a
concentration of ·10 ppm is now considered acceptable for eight-hour exposures at the work place. It is possible to measure metabolites of benzene in the urine of workers and thereby establish an index of exposure. The urinary sulfate ratio has been used for years to ex-press that portion of urinary sulfate, normally at least 80%. In
benzene exposure, the excre.tion of phenol sulfate increases so that the proportion of inorganic sulfate :drops to less than 80%. . Inorganic sulfate ratios of less than 80% are therefore considered indicative of excessive exposure.
E. Mathematical Model
studying the characteristics of toxic effects induced by them.
The h a zards of ingesting or inhaling radioactive substances have been primarily assessed from the construction of a mathematical model.
Such a technique has been extensively used to estimate uptake and
elimination of anesthetic gases (Papper and Kitz, 1963).
Riley, et al. (1966) described the occupational exposure to methylene chloride with a compartment model. DiVincenzo, et al. (1972) applied
the curve-fitting method to the experimental da ta of methylene chloride vapor exposure on human and canine and derived an empirical
two-compartment model in that system. Peterson (1978) also modeled the
uptake , metabolism and excretion of dichloromethane by man using the empirical regression method.
As industrial exposure to benzene vapor is typically highly
variable, estimation of the burden of benzene in the body is enhanced when computer techniques are employed.
The process of uptake and washout of organic solvent vapors in humans has recently been studied using an analog (Fiserova-Bergerova,
et a l., 1974) or mathema tica l model (Fernandez , e t a l., 1977) to simulate the processes and gives an adequate prediction.
Such calculations require information on the uptake and release
of benzene from body tissues which is not readily available. However,
estimates can be made from a knowledge of the blood perfusion of the organs, and the partition coefficients for benzene in blood and the various tissues.
The partition coefficients of benzene for various body fluids
(1974) as shown in Table 1. The coefficient of the vapor for fat is much higher than that for other tissues. The high solubility of ben"
Table 1. Partition coefficients of benzene for body fluids and t issue homogenates
A
a BloodPlasma
Liver Kidney
Brain, whole Lung
Heart
Muscle, femoral Bone marrow
Fat, retroperitoneal
Lecithin, from egg Triolein
Cholesterol
Cholesterol oleate Human fat, peri toneald Human bloode
- ---
m10.70 5.46 1. 61 1.13 1. 93 1. 25 1.44 1. 08 16.18 58.53 196.42 535.68 20.95 83.65 406.22 7.82
11<'1\ Z t'llC
s 1. 35 0.33 0.18 0.28 0.50 0.31 0.38 0.17 2.45 11.87 9.30 31.14 0.85 4.49 10. 10 1. 31
aA
=
Fluid-air partition coefficient. The figures are mean (m) andstandard deviation (s) of 5 rabbits.
bB
=
Tissue-blood partition coefficient. The figures are mean (m)and standard deviation (s) of 5 rabbits.
cc
=
Material-air partition coefficient. The figures are mean (m)and standard deviation (s) of 5 determinations.
d.The material was obtained from a 7-year-old boy who died of acute leukamia.
III. MODEL DEVELOPMENT
A multi-compa.rtment model is used in thh study. To simulate the absorption and distribution, the whole body system is divided into the lung compartment and tissue compartment. Furthermore, the tissue com-par·tment is divided into three 11roups of tissue according to Mapleson
(1973). The first of these is the vessel-rich group (VRG), which is
composed of those tissues most profusely supplied with blood vessels. These include heart, brai.n and spinal cord, hepatoportal system, kidney, and endocrine glands. The second group of tissues is the muscle group (MG), which is composed' of muscle and skin. The third group of tissues is. the fat group (FG), which is composed of adipose tissue. The fat. group is very important in this study because benzene is a_highly fat-soluble solvent, and has a very significantly high value of the
tissue-blood P?rtitio~ coefficient. In addition, it is considered that benzene
is quantitatively transformed in the liver to.phenol, catechol, quinol and hydroxyquinol. Hence, the liver is separated in the model from the vessel-rich group. In the lung compartment, the shunting effect is included. To make up the concentrations in the various compartments, arterial and yenous pools are included.
A. Theoretical Basis
The principal hypotheses used in this model are the same as those
discussed by Mapleson (1973) and Cowles, et al. (1971):
1. The cardiac output and alveolar ventilation are considered. to
2. Alveolar ventilation , blood flow r ates and other physiological
or physical parameters are constant;
3 . Benzene diffuses freely through the entire sur face of lh~
capillary and alveolar walls;
4. All compartments are considered to be well-stirred , i.e.,
concentration within each compartment or tissue group is uniform;
S. The arterial blood concentra tion out of the lung compartment
is in equilibrium with that of a lveolar gas ;
6 . The concentra tion of benzene in venous blood is in equilibrium
with tha t dissolved in t he correspondi ng drai ned t issue;
7. For a ll tissues , the gas-ti ssue partition coefficient which
determines the equilibrium between blood and tissue is independent of
the solvent concentration;
8. All the rate constants of the metabolic reaction shown in
Fig. 4 are considered to be first order for the concentration occurring
during industrial exposure.
B. Model Equations
1 . Absorption, distribution, and elimination of benzene
The equations describing this multi-compartment model are easily written by considering a material balance around each compartment
rate of accumulation
=
input rate - output rate1 . Lung compartment
MODEL CONFIGURATION
.
v:.
QA . Y,· . I
LUNG
X,\
.. QalXv COMPARTMENT
l
VENOUS ARTERIAL
POOL POOL
.
t Xi I - I I XA
I VRG I
..
X2 I MG I
I •
X3 I FG I
I •
XL I L IYER I
I •
By a ssumption t hat the arteri al blood concentra t i on out of the
lung compartment is in equilibrium with that of alveolar ga s ,
i. e. '
Let
Tii.e model equation of lung compartment b ecomes: dy '
v ~
peq dt (1)
2. Tissue compartments
a. VRG compartment
Let
Tii.e model equation of VRG compartment becomes :
V dxl
leq dt (2)
b. MG compartment
Let
dx2
V 2eq dt -
=
Q2(xa - x2)c. FG compartment
Let
dx3 _ dt
-The model equation of FG compartment becomes:
3. Arterial pool
dx a
dt
=
4. Venous pool
dx
. VBv dtv
-=
Ql~+
Q2xi
+ Q3x3 +Qf,xf,
-
QBxv2. "Metabolism of benzene
(3)
(4)
(5)
(6)
Assume -the metabolic reaction takes· place in the liver compartment
after e·quilibrium ·according to partition coefficient:
(7)
Assume the metabolic pathway is as proposed by Porteous and Williams
The differential equations expressing the rate of disappearance
of benzene and each metabolite are then:
dx,e
dt = - Klx.t
dx h
~
= Klx.t - (K2 + K4)xphdx ca
dt
= K2xphdx
~-K !it - 4xph
dxhg
'-'· dt - K3xca
- K 3 ca x,
C, Data Psed in the Model
(8)
(9)
(10)
(11)
'(12)
For a standard man with a body weight of 70 kg., body surface
. 2
area of 1. 8 m ' the volume of various tissues' as well as the
volume of blood in equilibrium with them are shown in Table 2 (Cowles, et al. , 1971). The volume of alveolar air is,. determined by the func-tional residual capacity (2.43 1) plus half the tidal volume (0.25 1).
The partition coeffi<:ient between gas and human blood are taken
from the data of Sato, et al. (1972). The partition coefficients,
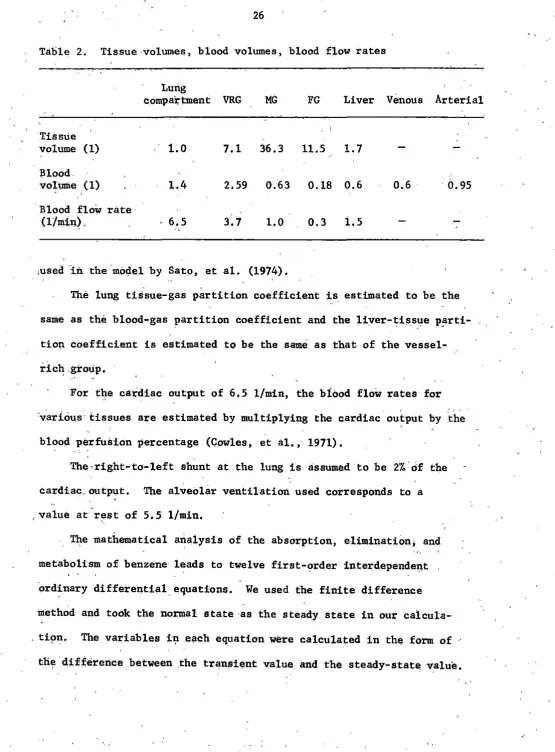
Table 2. Tissue ·volumes, blood volumes, blood flow rates
Lung
c 0mpa'rtment
VRG
MG
FG
Liver Venous Arterial"Tissue
volume (l) 1.0 7.1 36.3 11.5 1. 7
Blood
volultle (1) 1.4 2.59 0.63 0.18 0.6 0.6
. il.
95Blood flow rate·
(l/min~. 6,5 3.7 1.0 0.3 1.5
,used
in
the moc:lel by Sato, et al. (1974).The lung tis.sue-gas partition coefficient is estimated to be the
same as the blood-gas partition coefficient and the liver-tissue parti-- . .
.
:· ' ~tio'!l coefficient is estimated to be the same as that of the vessel-rich .group.
For the cardiac output of 6.5 l/min, the bfood flow rates for ·var:i.ous tissues are estimated by multiplying the cardiac output by the
blood perfus:l.on percentage (Cowles, et al., 1971).
The-right-to-left shunt at the lung is assumed to be 2%.of the
cardiac .. output. The alveolar ventilation used corresponds to a .,
value at rest of 5.5 l/min.
The mathematical analysis of the absorption, elimination, and
metabolism of benzene· leads to twelve first-order interdependeI\t ·ordinary differential equations. We used the finite difference
method and took the normal e.tate ·as the steady state in our
ca'l.cula-. ti~n. The variables i'!l each equation were calculated in the form of
[image:32.579.23.578.34.786.2]From the twelve equations and those variables at time
t,
we calculatedthe differences of the concentration between time t and t
+
1'.t. Byadding the concentrations at time t and the differences of concentration
between t and l'.t, the transient concentrations at time t
+
./'.t were ob"·tained.
The time increment was taken to be 0.01 minute in our calculation. Once the initial condition was given, the digital computer provides us an efficient service to calculate the condition at any time.
Our program was written in FORTRAN IV to solve this problem on a VAX-11/780 system.
IV. RESULTS AND DISCUSSION
A, Absorption, Distribution and Elimination of Benzene in the Blood and Tissues for a Single Exposure
The kinetics of the saturation and desaturation of the tissues depends on their blood perfusion and apparent volumes of distribution.
The predicted copcentrations of benzene in alveolar gas, mixed venous pool and various body tissues during and after 8 hours exposure were plotted on semi-log paper against time (Fig. 7).
The concentration in alveolar gas increases very fast during the first hour and approaches saturation in the later period of exposure; This indicates that benzene in alveolar gas is absorbed by the pulmonary ca,pillary blood and transported to the body tissues very easily at
first; but when the tissues become more concentrated with benzene, .the .concentration. in alveolar gas approaches an equilibrium state, During the post-exposure period, the elimination rate of benzene in
alveolar gas is very rapid at first and decreases gradually as time goes on. It appears that due to the ,amount of benzene still remaining in the tissues, the elimination of benzene conti,nues even after
24 hours.
Among ·the body tissues, the group of very vascular tissues, VRG, is almost always in equilibrium with the arterial blood, and has nearly the samE'. concentration level as the alveolar gas both.in exposure aI)d in post-exposure periods. Contrarily, the concentration of benzene in adipose tissue, FG, which has the least blood perfusion is the lowest
icf
~
~
0... 0...
"-'
z
0-....
~
t-z
LIJ
u
10
z
0(.)
J
1
EXPOSURE
0.20
5
t
10
0
ALVEOLAR GAS• VENOUS POOL
A
VRGA
MGD
FGPOST- EXPOSURE
•
15
20
24
TIME (HOURS)
reaches the equilibrium state. The concentration in the group of
muscle and skin tissues, MG, which has average physiological parameters
_ iS indicated as being intermediate between VRG and 1''G, but being more
like the former.
· For the whole body, the absorption of benzene by the blood was ·very rapid at first and reached equilibrium in the later exposure period. Similarly, tb,e elimination in the post-exposure period occurs rapidly at first, and the rate decreases as time goes on, but due .to the amount of benzene stored in adipose tissue, elimination continues even at the
end of
24
hours.It is also remarkable to find that the adipose tissue has only a minor .effect on the alveolar gas concentration during exposure and the
first few hours after exposure.
On
the other hand, the alveolarconcentration 6 hours after the end of exposure shows variation directly proporttonal to the·be11zene concentration in FG. Consequently, the measurement of the concentration in alveolar gas during' the first few hours after post-exposure mainly reflects the retention of the VRG and MG, but 6 hours after post-exposure, it reflects the retention of FG,
For the hard-working people in a benzene environment, the absorption and elimination of benzene in alveolar gas and in blood are shown in Fig, 8 and Fig. 9. We simulate this case by doublirig the volumes of alveolar ventilation and cardiac output during the exposure period. We find that_ the concentrations of benzene both in alveolar gas and in blood for the hard-working person are higher than those for the
resting person. It also shows that the absorption rate of benzene in
[image:37.586.38.520.62.491.2]THE ALVEOLAR GASES OF RESTING PERSON AND
1-0 •
0
RESTllllQ • EXERCllllHl10
-
:i.
ll.ll.
-
0z
~
a: .
,....
.z
I.LI
0
z
0 01
EXPOSURE POST-EXPOSURE
..
0·20::--·
----=s---=1"='0---1::-i::s:---:2~0---:2~4..,..
THE VENOUS POOLS OF REST I NG PERSON AND
' I
-
:E
a.
a.
"'
0...
1
._
z
0-~·
!z
LI.I
0
~
(,J
0.1
EXPOSURE POST•EXPOSURE
•
0
5
10
15
20
24
and then decreases with time. It becomes nearly the same for both cases after 3 hours of exposure. In the post-exposure period, the elimination
rate is almost the same for th~ hard-working person and the resting
person.
For the case ·of ari obese person, the absorption and elimination of benzene in alveolar gas, blood and fat tissue are shown in.Figs •. 10-12. We simulate this case simply by doubling the volume of FG. We find that
there is no significant difference between the concentrations of benzene in alveolar gas (Fig. 10) or in blood (Fig. 11) for the obese person and tpose for the normal person during the' exposure period. The absorption rates are rapid in the first hour and then gradually approach an
equilibrium state. When we examine the FG (Fig. 12), we can find that the benzene concentration in FG is consistently lower for the obese person than that for the normal person; we also see that the
concentra-tions are far from saturation for both cases. The lower concentration
in FG of the obese person can be easily explained by the larger fat tissue volume.
Throughout the whole post-exposure period, the concentration of benzene both in the alveolar gas and in blood is lower for the obese person than for the normal person. It seems inconsistent with the
conclusion made by Sato, et al. (1975a, b). But if we examine the
elimina-tion curve of benzene in FG, we find that the slope of the curve for the normal person will be higher than that for the obese person. It is reasonable because the concentration gradient between the fat tissue
.and the capillary blood is higher for the normal person. Hence, the
~
10
:!:
c.
c.
-1
0.20
EXPOSURE
5
10
Q NORMAL
• OBESE
~
•
POST-EXPOSURE
15
TIME
<HOURS
>•
•
...
•
z
0
~
1-
z
w
u
z
8
10
0.1
0.02
EXPOSURE
s
10Q NORMAL • OBESE
POST-EXPOSURE
1S
TIME
<HOURS>
• • •
...
7
--
:E
Cl.Cl.
-
z
0~
~
LI.I (,)z
0 (,). ..~••••••••m•••••••••~••aaaaaaaawaa-.wwamwaawaaaaa .. .• I
10
·• I ·• I .• I
.• I
• I
.• I
... I
•
...
•
•
•
•
•
•
•
•
•
.
-•
•
•
•
• • •
•
•
• • •
• • •
•
•
•
•
• • •
~EXPOSURE
..,
I..
NORMAL
08EllE
lo
5
10
15
20
TIME (HOURS)
Fio.12.
CoMPAlllON OP llNZINi DITWllN THI '"' TllllUll°' '
NOIMAI. .Pl HON o\fllD 09111 PHION
..
other words, benzene is difficult to eliminate from the fat tissue of the obese person and tends.to accumulate in FG in case of repeated ex-posure. This explains the lower concentration in alveolar gas and blood of the obese person.
B. Repeated Exposure
In industry, exposure often occurs Monday through Friday and 8 hours per day. Figure 13 and Fig. 14 show the alveolar and venous blood
concentrations obtained under repeated exposure of 100 ppm for five
days and
·s
hours per day. It can be seen that the concentrations ofbenzene.in both alveolar gas and venous blood at the end of exposure vary only slightly from one day to another. As stated before, benzene levels in VRG and MG are practically in equilibrium with that in arterial blood at the end of e:Kposure, the burden of benzene in these tissues
in-creases very slightly.
On the·other hand, due to the slow release of benzene during the elimination period, the quantity of benzene in adipose tis.sue increases progressively as shown· in Fig. 15.
In Fig. 15, we also compare the concentration of benzene in obese persons with that in noi;mal persons under repeated exposure. We find
that during a five-day expos.ure, benzene concentration in FG of an
·obese person is. consistently, lower than that in a normal person, but
.
.
'
because o~ the different elimination rates between FG of an obese
[image:48.582.41.527.65.769.2]:!:
a.
a.
...
30"
z
0
ti
~
20w
.P. l~
"'!"
8
10'TIME ( HOURS )
f
IG. 13. PREDICTED" CONCENTRATION OF BENZENE IN ALVEOLAR GAS UNDER RlltP!!ATED EXPOSURE-....
:IE
a.
a.
...
0
1.5-._
z
0
_,
'<
a::
1.0....
~·~
z
~8
o.s
0
8. 16 0 B 16 0 8 16
o· s
16 0 8 • 16 0 B 16..
TIME <HOURS>
f1G.14.
PREDICTED CONCENTRAT.ION OF BENZENE IN VENOUS BLOOD UNDER REPEATED EXPOSURE-...
:E
11. 11.
..
0-~
z
2
~
lZ
UJ(.)
z
8
0.8
0.6
0.4
-
NORMAL••••••OBESE
OJI
-
-0
-
-0 8 16 0 8 16 0 8 16 0 ' 8 16 0 8 16 0 8 16
TIME (HOURS)
f1G.
15.
COMPARISON OF BENZENE CONCENTRATION BETWEEN ADIPOSE ·TISSUES OF NORMAL PERSONAND OBESE PERSON UNDER REPEATED EXPOSURE
In human beings , the body fat content is larger on the average in females
than in males (Keys and Brozek, 1953). Accordingly, our r esul t can ex-plain the general belief that females have a higher degr ee of suscepti-bility than males t o haematopoietic disorders induced by benzene.
C. Response of Metabolites in the Body
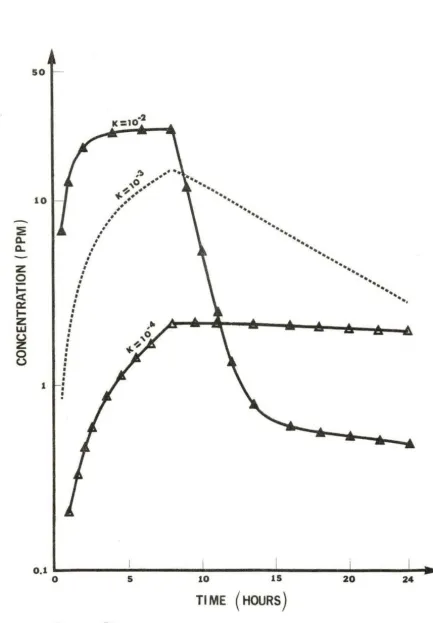
Figures 16-19 illustrate the concentrations of phenol, catechol,
quinol, and hydroxyquinol in the body during and after 8 hours of ex-posure to 100 ppm of benzene . We assume that the rate constants of
this consecutive reaction are the same and of the order of 10- 2, 10- 3 ,
10-4 with the uni t s of [rnin. - 1 ) .
The concentration of each metabolite depends on the r ate constan t
of each metabolic reaction, respectively. For the r ate constant of
- 2
the order of 10 , the concentra tions of all the metabolites increase with time during the exposure period. Furthermore, since the
decom-posing rates of phenol and catechol are a lso increasing , the concentra-tions of these two species approach an equilibrium state before the cessation of exposure . During the postexposure period, t he concentra
-tions of phenol and catechol drop continuously, while those of quinol and hydroxyquinol increase slowly to attain the equilibrium state .
-3
If the rate constants are of the order of 10 , the concentration of all metabolites will become lower in the exposure period. But due to the lower decomposing r a te of phenol and catechol, their
so
10
-
n..
:En..
z
Q
~
a::
t-z
UJ (.)z
0 (.) 1 0,1 0 ,')..
-
.
,o •••
~
...
~..
••
••
••
•
•
•
•
•
•
•
I•
•
•
•
I•
•
•
•
I I•
•
•
I•
•
•
•
• • •
•
• • •
•
•
•
.
s
..
..
...
••
10...
•• •• ••
••
••
••
•• ••
Tl ME (HOURS)
..
.
....
..
..
..
..
...
..
.
..
..
.. ..
20.
..
...
.. ..
..
..
..
.. ..
...
24 [image:53.583.57.491.55.679.2]z
0~
a:
1-
z:
w
(,)
z
0 (,)10
TIME <nOURS>
100
--
:iE0.. 0.. 10
--
z
0lei: .
a:
I-z
w
(.Jz
0 (.J 0.1 0••
• •
••
••
••
••
••
..
----K: 10...20-3 ... .
K :I
••••••
•••••...
•••
••
...
••
/
...
:
...
•
:
..
•
•
•
•
•
•
•
•
•
•
•
•
•
•
•
•
•
•
•
•
•
•
•
•
•
•
•
5 10 15 20 24
TIME (HOURS)
D.. D..
---
z
0i~
Cl:
I-z
w
(.)
z
8
100
10
-2
K: 10
'
...
....1i ••••,o -··
.
~··
""
••
..
••
••
••
••
••
••
..
••
.
//'
...
•••
...
····•'
l:
o.2'u ____
i...:;, _ _ _ ....1 _ _ _ _ ... _ _ _ _ _._ _ _ _ ..._.,...0 5 10 15 20 24
TIME (HOURS)
f1G. 19. PREDICTED CONCINTIATION OF HYDROXYQUINOL IN THE HUMAN
phenol concentration decreases constantly with a slow elimination rate, catechol concentration continues to increase until 7 hours after cessation of exposure. Tile concentrations of quinol and
hydroxy-quinol increase consistently through the whole post-exposure period. -4 If the rate constants are even smaller, on the order of 10 ,
the concentration of all metabolites are obviously low. All metabolites
except phenol increase in the body with time. Phenol concentration
decreases very slowly during the pos t -exposure period.
In order to compare the results calculated from our model with
those of previous measurements by Sa to , et al. (Fig. 2), we simulated
the same condition by using 25 ppm benzene in the inhaling gas. Tile result is shown in Appendix C. We also converted the unit of concentra-tion from ppm to µg/d i by multiplying the conversion factor of 3.19,
and plotted in Fig. 20. In this figure, both our data and those of
Sato, et al. are included. It is remarkable that the curves from this
model are very close to those from the experiment of Sato, et al. Hence, we confirmed that our multi-compartment model can properly explain the
ALVEOLAR GAS ( FOR THE EXPOSURE OF 25 PPM
--
...
...-
..
::i...._
z
0
-
~
Iii=
""
z
Illu
z
0
u
105
~
• •
\
0.5
0.1
0.05
-0
•
\
•....
·~•• •
••
•••
•• •• ••
60
•• ••
••
••
••
•• ••
•••
....
120
···-....
••
·--.
...
....
180
VENOUS BLOOD ALVEOLAR GAS
....
•••••••
••••••••••••••••
240 300
V. CONCLUSIONS AND RECOMMENDATIONS
The mathematical model developed in this research provides a quantitative prediction of the absorption, distribution, metabolism and elimination of benzene in the human body . The results agree
well with those of previous investigators .
During an industrial exposure of benzene, the calculated rate of absorption by blood is very fast during the first few minutes and
de-creases as the benzene concentration in the blood inde-creases. Similarly,
during the post-exposure period, the elimination rate by the blood is also very fast right after cessation of exposure and decrease as the
concentration gradient drops.
For a standard person with constant blood flow rate, ventilation
and other physical and physiological values, the computed distribution
of benzene throughout the body depends mainly on the partition
coeffi-cients of the various tissues. The tissues of vessel-rich groups absorb and eliminate benzene most efficiently. Even for repeated
exposure, the accumulation of benzene in these tissues is not of im-portance. Contrarily, the adipose tissue absorbs and eliminates benzene
very slowly . The accumulation is very obvious in the case of repeated exposure.
For a hard-working person, both the absorption and elimination rates are faster than that of a normal person.
It is remarkable from this research that the elimination of ben-zene from alveolar gas or from the blood is faster for the obese
decreases in later periods. The concentration of benzene in the fat group is lower for obese persons, but due' to its slower elimination rate, the concentration of benzene will become higher for the obese person from the 6th day of repeated exposure.
Although previous research is lacking in the kinetic study of the metabolic reactions, we have tried to simulate the reaction under the assumption of a consecutive reaction and different rate constants. From the results, we find that the concentration curves of the metabolites vary with the relative values of the rate constants. When the rate
constants are higher, the conversion reaction is facilitated, the
concentration of phenol and catecholdecreases,while quinol and hydroxy-quinol tend to be accumulated. Contrarily, if the rate constants are lower, the conversion.reaction is depressed, and phenol and catechol tend to be a'ccumulated in the body as well. We could further investigate the reaction rate by designing experiments. to compare the experimental result with the coniputed resuit.
In addition to benzene, we suggest the simulation by similar. methods of the response of other solvents or chemical species in the .body. This will be helpful in environmental control and in.establishing
VI. LITERATURE CITED
Berlin, M., S. Ho1m, P. Knutsson, and A. Tunek. 1979. Biological threshold limits for benzene based on pharmacokinetics of inhaled be.nzene in man. Mechanism of Toxic Action on Some Target Organs. Arch. Toxicol., Suppl. 2: 305-310.
Cowles, A, L., H. H. Borgstedt, and A. J, Gillies, 1971. Tissue weights and rates of blood flow in man for the prediction of anesthetic uptake and distribution. Anesthesiology 35: 523-526.
DiVincenzo,' G, D., F. J, Yanno, and B. D. Astill. 1972. Human and canine exposure to methylene chloride vapor. Am. Ind. Hyg. Assoc. J. 33: 125-135. Fernandez, J, G,, P. 0, Droz, B. E. Humbert, and J. R. Caperos.
Trichroloethylene exposure. Simulation of uptake, excre.tion metabolism using a mathematical model. Br, J, Ind. Med. 34:
1977. and
43-55.
Fiserova-Bergerova, V., J, Vlash, and K. Singhal. 1974. Simulation and prediction of uptake, distribution and exhalation of organic so1vents. Br; J. Ind. Med, 3l: 45-52.
Garton, G, A., and R. T. Williams. 1948. , Studies in detoxication XVII. Fate of catechol in the rabbit and characterization of catechol' monoglucuronide. Biochem. J. 43: 206-211.
Garton, ·G. A., and R. T. Williams. 1949a. The fate of quinol and resorcinol in the metabolism of benzene. Biochem. J, ·44:
Studies in detoxication. rabbit in relation to the
234-238.
Garton, G. A., and R. T. Williams. 1949b. Studies in detoxication, The fates of phenol, phenylsulphuric acid and pheny1glucuronides in !:he rabbit, in relation to the metabolism of benzene. Biochem. J. 45: 158-163.
Hamilton, A., and H. L. Hardy. 1974. Industrial Toxicology. 3rd ed. Publishing Sciences Group, Inc., Acton, Mass.
Hunter.," C. G. 1968. Solvents with reference to studies on the pharmaco-dynamics of benzene.. Proc. R. Soc. Med. 61: 913-915.
Jerina, D. M. 1973. Hydroxylation of aromatics. Chemical models for the biological processes, Chemtechnology 2: 120-127.
Keys, A., and J, Brozek. 1953. Body fat ·in adult man. Physiological Reviews 33: 245-298.
Mapleson, W. W. 1973. anesthetics and data 319-334 .•
Papper, E. M .. , and R. J. Kitz. 1963. Uptake and Distribution of Anesthetic Agents. McGraw-Hill, New York.
Parke, D. V., and R. T. Williams. 1950, Detoxication XXVI, Metabolism of benzene. (a) Determination of benzene. (b) Elimination of un-changed benzene by rabbits. Biochem. J. 46: 236-243.
Parke, D. V., and R. T. Williams. 1952. Detoxication XLIV. Metabolism of benzene. The muconic acid excreted by rabbits receiving benzene .• Determination of the isomeric muconic acids. Biochem. J. 51:
339-348.
Parke, D. V., and R. T. Williams. 1954. Detoxication XLIX. Metabolism of benzene containing (cl4)benzene. Biochem. J. 54: 231-238.
Peterson, J. E. 1978. Modeling the uptake, metabolism and excretion of
dichloromethane by man.
Am.
Ind. Hyg. Assoc. J. 39: 41-47.Porteous, J., W., and R. T. Williams. 1949. Studies in detoxication. The metabolism of benzene. The isolation of phenol, catechol, quinol .and hydroxyl:quinol from the ethereal sulphate fraction of the urine
of rabbits receiving benzene orally. Biochem. J. 44: 56-61. Radojicia, B. 1975. Determination of phenol irt urine in a group of
workers exposed to benzene. Arh. Rig. Rad. Toksikol. 26(3): 209-212.
Riley, E.
c .. ,
D. W. Fassett, and W. L. Sutton. 1966. Methylene chloridevapor in expired air of human subjects.
Am.
Ind. Hyg. Assoc. J.27: 341.
Roush, G. J., and M. G. Ott. 1977. A study of benzene exposure versus
~rinary phenol levels.
Am.
Ind. Hyg. Assoc. J. 38(2): 67-75.Sato; A. 1972. Elimination of inhaled benzene and toluene in man. Jpn. J. Ind. Health 14: 224-225.
Sato, A., Y. Fujiwara, artd K. Hirosawa. ·1972. Solubility of benzene, toluene and m-xylene in blood. Jpn. J. Ind. Health 14: 3-8.
Sato, A,, Y. Fujiwara, and T. Nakajima. soluene, and m-xylene in various body Sangyo Igaku 16(1): 30-31.
1974. Solubility of benzene, fluids and tissues of rabbits.
Sato, A., T. Nakajima; and Y. Fujiwara. 1975a. Determination of benzene and toluene in blood by means of a syringe-equilibrium method using a small amount of blood. Br. J. Ind. Med. 32: 210-214.
Schrenk, H. H., W. P. Yant, S, J, Pearce, F. A. Patty, and R.R. Sayers. 1941. Absorption, distribution and elimination of benzene by body
tissues and fluids of dogs exposed to benzene vapor. J, Ind. Hyg.
Toxicol. 23: 20-34.
Sherwood, R. J, 1972. Benzene:
sults. Ann. Occup. Hyg. 15: 409-421. The interpretation of monitoring
re-Sherwood, R. J,, and F, W. G, Carter. 1970. The measurement of
oc-cupational exposure to benzene vapor. Ann. Occup. Hyg. 13: 125-146. Srbova, J., T. Teisinger, and S. Skramonsky. 1950. Absorption and
elimination of inhaled benzene in·man. Arch. Ind. Hyg. 2: 1-8.
Teisinger, J,, V. Fiserova-Bergerova, and J, Kudrna. 1952, The
metabolism of benzene in man. Proc. Lek. 4: 175-188.
Wagner, J. G, 1967. Method for estimating rate constants for
absorp-tion, metabolism, and elimination from urinary excretion data. J, '
Pharmacol. Sci. 56: 489-494.
Walkley, J, E., L. D, Pagnotto, and H. B, Elkins. 1961. The
measure-ment of phenol in urine as an index of benzene exposure. Ann. Ind.