Abstract: In social media, the users share their ideas, opinions to their neighbours and friends. Spammers send spam information to the genuine users to mislead them. This spam data is a very serious problem in social media sites. To detect spam messages in social media various spam detection methodologies are developed by researchers. The researchers used more number of features to construct the models. Generally the original dataset contains many irrelevant and redundant features. Such large amount of features reduces the spam detection accuracy. To improve the spam detection accuracy in social media networks, we have to reduce the meaningless attributes from high dimensional social media dataset. In order to reduce dimensionality of dataset, we have used one of the dimensionality reduction approach, called principal component analysis (PCA). After reducing the dimensionality of the dataset, the dataset samples are classified using Decision Tree Induction classifier algorithm and K Nearest Neighbour algorithm. In our proposed work these algorithms are used to check data samples are spam samples or ham samples. In this methodology, we have used Twitter dataset for testing proposed approach. Experimental results shows that KNN classifier outperforms compared to Decision tree classifier.
Keywords: Social media, Dimensionality, PCA, Decision Tree, KNN algorithm.
I. INTRODUCTION
Social media networking sites like as Twitter, Facebook, MySpace, Instagram and LinkedIn have been gaining huge popularity in the recent era. Twitter is the one of popular and largest networking sites compare to other social media sites. Twitter has been allows social media networking users to post latest news and share messages. The size of the posted messages is no more than 280 characters; such messages are called tweets in Twitter network. Generally online networking sites are being often used by people to express opinions on any product, emotions and beliefs on persons. To post feedback and reviews on purchased products, these networking sites can act as best platforms for users. Now a days 0.13% of messages advertised on Twitter are clicked, whenever users click on these links they accessed into spam data, which are higher than that of email spam [1]. Twitter and other online social networks are mainly used for sharing valuable information, huge user base have made them main target for cybercriminals and socialbots. In social networking sites, we can call spambots as socialbots.
Revised Manuscript Received on July 05, 2019
K Subba Reddy, Research Scholar, Anucet, ANU, Guntur, AP, India Srinivasa Reddy, Dean, Anucet, ANU, Guntur, AP, India
These socialbots can act as a genuine user in social network to get trust in a network. Once the users get faith on these bots and then these bots are used for malicious activities [2]. Generally spammers count in social media networks are less than genuine users count, but these spammers has capability to affect the structure of social network.. The spammers always use Twitter as a channel to spread malicious links and to post irrelevant messages to genuine users. The spammers also capture the trending news and can create fake accounts to access genuine users and lead them. For the identification of illegal activities in social media many challenges are involved. Some of the challenges are finding of the suspicious contents, messages posted by users and study the user’s behaviour, characteristics in the social media, etc [3]. Many approaches have been developed for spam detection in social media. These approaches include various concepts like machine learning algorithms such as supervised and unsupervised algorithms and statistical methods. The various developed methodologies to detect spam have been applied on dataset without any dimension reduction technique. The dimensionality of dataset can be considered as one of the major issues to degrade the spam detection accuracy. Our proposed approach can reduce dimensionality of dataset by extracting irrelevant information from dataset. Principal Component Analysis (PCA) is one of linear dimensionality reduction mechanisms [4]. To handle non linear structure data most researchers use KPCA.
our paper is organized as : in Section II presents some related spam detection work done by various researchers to detect spam in social media. Section III describes our proposed approach for Spam detection. In section IV and V we describe experimental results and future work.
II. RELATED WORK
In recent years of technical era social networking sites have become very popular. Spam detection in social media networking sites is very crucial. M. McCord et al [5] describes an approach to detect spam in Twitter data using traditional Classifiers. These authors propose a methodology to detect spam in Twitter data using user based features and content based features. The content based features include count of URLs in tweet, the count of replies/Mentions, the word weight, retweets and hashtags. Their spam detection scheme by randomforest gives the best performance. Gianluca et al [6] proposed a
methodology to detect spam in social media using social
Using Reduced Set of Features to Detect Spam
in Twitter Data with Decision Tree and KNN
Classifier Algorithms
honey pots. These social honey pots are manually constructed with features like age, gender, name, surname, etc. For three different social network communities these honey profiles are assigned. In this approach they have used random forest algorithm to classify spammers. In [7], the authors build a model with features like content based and graph based features to detect spam messages in Twitter. With these features the authors studied and evaluated various classification algorithms. Out of all classifiers Bayesian belief network classifier has a better performance. In [8], the authors propose a methodology to detect spam in social network using content based features. In this approach they have used machine learning algorithms and compression algorithms to detect spam. In [9], the authors describe the one of dimensionality reduction approach, such as Principal Component Analysis to reduce the dimensions of dataset. They have been also studied various dimension reduction approaches like DF, CF-DF, (TF- IDF) and Latent semantic Analysis (LSA). They studied and tested the dimension reduction of textual documents using principal component analysis. PCA performs better dimensionality reduction compared to other. Z. Elkhadir et al [10], studied intrusion detection methods using PCA approach and Kernel PCA. In this methodology they used KNN classifier. In [11], Mohd Fazil et al. used metadata features, content features, interaction features and community based features to filter spammers. They have used random forest classification algorithm, decision tree classification algorithm and Bayesian classification algorithm to build their spam detection approach. In [12], the authors describe an approach to detect spam messages. They have proposed flat and hierarchical classification approaches with user features and data features. To evaluate their approach they have used disaster dataset. Surendra Sedhai et al. [13] proposed a semi supervised spam detection framework to detect spam in twitter data. They have used four light weight detectors, such as blacklisted domain detector, near duplicate detector, reliable ham detector and multiclassifier based detector. To implement proposed approach to detect spam messages, they have used various features. Zakia Zaman et al. [14] proposed a machine learning approach to detect spam messages with Naive bayes, KNN, SVM and Bagging classifiers. To select appropriate features to develop a model they have used stop word removal feature selection method. In [15], the authors propose a spam detection technique using SVM. Their approach is divided into two phases, such as training phase of SVM classifier with email dataset and testing phase of low quality URLs with trained SVM classifier. In [16], the authors describe a methodology to detect spam images. To reduce dimensionality of dataset, they have used Principal Component Analysis algorithm. They evaluate proposed approach using SVM classifier and KNN classifier and have achieved 98.7% accuracy. Zahra Mashayekhi et al. [17] studied a spam detection methodology with decision tree algorithm and neural network. They have used merits of these two classifiers to develop a hybrid approach to detect spam. They have been proved that the proposed methodology has 4% improvement in terms of accuracy compared to other methods. M. Ramya et al. [18], studied feature selection approach for text classification. They had described various feature selection strategies and dimension reduction strategies to select appropriate features. They had compared the performance of KNN and SVM classifiers. In [19], authors proposed several
features which were capable of distinguishing genuine messages from the spam messages. The extracted features are used to construct a model with KNN and decision tree induction algorithms. The performance evaluating metrics stated that KNN algorithm is better than decision tree algorithm. Chen Liu et al. [20], proposed new methodology to detect spam accounts in efficiently in social media. They have used extreme learning machine (ELM) algorithm with different features.
III. PROPOSED METHODOLOGY
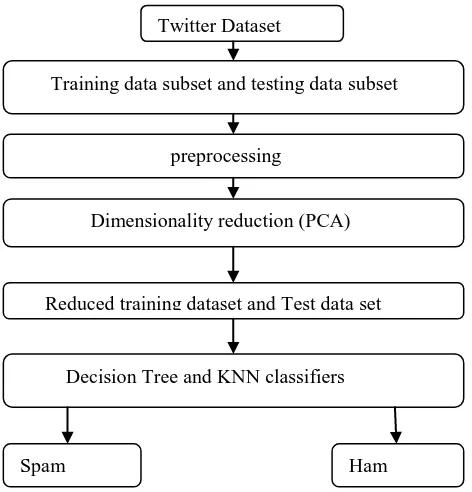
The framework of our spam detection approach shown in Fig 1. In our proposed approach we used various steps for efficient spam detection in Twitter. Initially, required Twitter dataset is selected from various repositories. In second step of methodology, we randomly split the Twitter dataset into two parts. One part is used for training the model and other part is used for testing the model. These two parts of datasets are preprocessed to get standard features.
[image:2.595.318.554.383.629.2]In training phase of model, we extract minimum set of features from high dimensional data with one of feature reduction method called PCA. With using these minimal set of features, we get a new training dataset to train the model. With new set of features we obtain new test dataset samples. the classification phase of model will decide whether the testing tweets are spam or ham tweets.
Fig 1: The frame work of proposed spam detection
3.1 Selection of Dataset:
Twitter dataset has been used in the spam detection system. Here we used various datasets, such as product review dataset, political dataset, Entertainment dataset, sports dataset and disaster datasets. All these datasets are collected from various users. Table 1 describes the details of used datasets in our approach.
Twitter Dataset
Training data subset and testing data subset
preprocessing
Dimensionality reduction (PCA)
Reduced training dataset and Test data set
Decision Tree and KNN classifiers
Table 1. Used datasets in our methodology
Datasets Number of Tweets
Product Review 2000
Political 1800
Entertainment 1900
Sports 1900
Disaster 1500
3.2 Preprocessing Step
In this step, each tweet is represented as a feature vector. In this representation each tweet is separated into words. In the proposed model, the tweets are considered as transactions. In the preprocessing step selection of best keywords is the major criteria to indexing tweets. It is very important to select the suitable keywords that represent the meaning of tweets and in preprocessing step discard the words that do not contribute to differentiate the tweets. The datasets are generally defined by discrete and continuous attribute values. Transformation functions are used to transform the discrete attribute values into continuous values, such as discrete cosine transforms or wavelet transform functions. The discrete to continuous value transformation procedure is as follows: if the discrete attribute d have n values, then we correspond d to n coordinates composed of ones and zeros. In most of the spam detection models, it is necessary to remove words which appear too frequently and those words don’t support any information for the task of spam detection. To remove these irrelevant and frequent words from tweets, we used stop word removal approach.
3.3 Feature Selection
In our proposed approach we used the content based, user based and graph based features along with above methodology features. Using only stop word removal and stemming method feature selection, we are unable to detect spam messages in efficient manner. Spammers will use different techniques to spread spam messages to the genuine users. These features characterize the tweets send by the various users to their neighbours. In existing spam detection methodologies, quality of content is taken one of the measures for spam detection in social media. Spammers have various techniques to incorporate their information into social media to mislead traditional spam detection methodologies. Tweet quality is a measure to know the intention of user, based on intention of the user we can check out the tweet ass spam or non spam. In our proposed approach we used a set of content based features.
3.4 Content based features
Mention Ratio: Using @ symbol Twitter social media network users can be tagged.This feature is also used by spammers to misguide the genuine users. The spammers motivate and tempting the benign users to know the sender. The mention ratio for the user is calculated as the ratio between number of mentions in the tweets and total number of tweets posted by user. Naturally the ratio is less for genuine users and more for spammers.
URL ratio: users generally post their ideas, opinions about a topic and share views through tweets. The sender tweets include URLs, these refer source pages that contain detailed information. Some of the users include much number of URLs into tweets continuously, so we can suspect them as spammers. The URL ratio of the user is the ratio between number of URLs available in user tweets and number of tweets posted by that user. Generally more number of URLs are used by spammers in the tweets to share their intention to users. Spammers use the more number of URLs where as legitimate users use the less number of URLs in tweets. The spammers URL ratio is nearer to one or more than one where as for benign users the URL ratio is very small or closer to zero.
Unique mention ratio: Generally benign users contact with friends and colleagues and at the time of sending tweets they can use this group of the people or set of the people regularly but spammers tag the unknown persons randomly within their tweets. Generally the unique mention ratio is very less for genuine users and more for spammers.
Unique URL ratio: Generally the spammers use many number of URLs in the tweets to fulfil their intention but at the same time some of the spammers use the same URL for number of times for the same user. The genuine user seen the same URL number of times and tempted him to click on URL. The unique URL ratio is the ratio between the number of unique URLs and number of URLs used in the tweets.
Content and hashtag similarity: Generally on users wall twitter post the most frequent hashtags and trending topics. Spammers include these hashtags and trending topics into their malicious tweets to attract the genuine users. The trending hashtags are injected into tweets by spammers. but these injected hashtags and content in the tweet has no relation.
3.5 Metadata Features
Retweet ratio (RR): The ratio between retweeted tweets to number of tweets.
Tweet time standard deviation (TSD): This is used to detect various tweet times of a user.
3.6 Interaction Features
Follower ratio (FR): This feature describes the ratio between number of followers to total number of users associated him.
Mean followers following to follower ratio(MFR) : This feature defines ratio between mean of the followers following to total number of followers.
Followers based reputation (FBR): This feature defines average reputation of followers of a user..
Reputation (R): The reputation of a user is directly proportion to reputation of his followers.
3.7 Community Features
Community based reputation (CBR): This feature describes reputation of user in network and reputation of communities in network that user belongs.
Community based clustering coefficient (CBCC): This feature describes how frequently one group users are frequently connected to each other.
3.8 Feature Selection
Tweet frequency (TF): This approach measures in how many tweets the word appears. The word count is computed over total dataset. We need to select frequent words from dataset to improve accuracy of model.
TF
Mutual Information (MI): This method describes the relation between random variables within dataset. If the variables are not depend on each other then we say two variables are independent.
Information gain (IG): This method measures importance of particular term in dataset. Based on class membership of term we can measure importance of term. With these variables can compute how much of information can be gained. The information gain is considered as term goodness.
X2 statistics: This statistical method is used to test dependency between two random variables. This method can help us to identify independent variables from a set of variables.
NGL coefficient: This is the variant of chi square measure. This is only used for selecting positive class membership variables.
3.9 Dimensionality Reduction Methods
3.9.1 Principal Component Analysis (PCA)
This is one of the mathematical techniques is used to convert correlated attributes into uncorrelated attributes. These uncorrelated attributes are called principal components. The number of derived principal components of a dataset are less than original dataset variables. PCA is used to reduce the dimensionality of initial dataset and retaining the originality of dataset. The general procedure to generate the principal components of dataset is as follows: Consider a training set of X vectors a1, a2,....,am each vector
contains Y features. To get principal components of dataset. Calculate mean, of the set: Mean, =
Subtract mean from Wi and get i : i= Wi – mean()
The covariance matrix (C), C y × y= =AAT and
Ay×X = i
Let Uk be the k th
eigenvector and Un×n1 = {U1, ...Un1} the
matrix of these eigenvectors, so we have CUk = kUk
Sort the Eigen values and select corresponding eigenvectors. The resultant eigen vectors are called principal components. Total number of principal components of dataset depends on precision.
To generalize PCA to non linear reduction, we can use kernel PCA. In our approach we implement PCA to reduce the dimensions of the Twitter dataset.
3.9.2 Linear Discreminant Analysis (LDA)
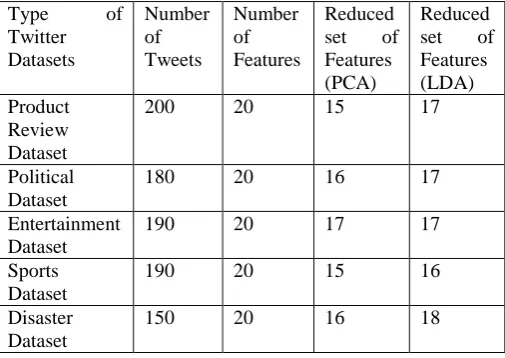
This is another dimensionality reduction methodology is used to reduce the dimensionality of dataset. In our approach we have been applied principal component analysis(PCA) and linear discriminant analysis (LCA) on our proposed datasets for dimensionality reduction. Table 2 describe the comparison between two dimensionality reduction methodologies. PCA out performs compare to LDA dimension reduction methodology.
Table 2.Comparison of PCA and LDA for dimensionality reduction of datasets
Type of
Twitter Datasets
Number of Tweets
Number of Features
Reduced set of Features (PCA)
Reduced set of Features (LDA) Product
Review Dataset
200 20 15 17
Political Dataset
180 20 16 17
Entertainment Dataset
190 20 17 17
Sports Dataset
190 20 15 16
Disaster Dataset
150 20 16 18
In Twitter social network day to day user interactions are increased. On line social network users send vast amount of data into the network to share others in the network. With the rapid growth of
[image:4.595.301.554.516.695.2]data and also maintain spam detection methodology. Spammers send malicious information to the benign users to mislead them. Automated tweet categorization is one of the supervised machine learning tasks. This task automatically assigning spam or ham category labels to the new tweets.
3.10 K Nearest Neighbour Classifier Algorithm
This is very popular algorithm for classification of data. This algorithm is used for categorize dataset samples based on nearest training samples. To classify the test tweet, KNN algorithm identifies, k closest samples that are similar to test sample. The k nearest neighbours are identified by similarities of data sample. The data sample similarities are computed with some set of similarity measures. Euclidean distance measure is one of familiar similarity computing approach. The distance between two data samples can be found using Euclidean distance formula. The performance of classification model is improved using cross validation technique. The cross validation approach is used to validate the classification model performance and accuracy.
D(X,Y)=
After k nearest neighbours is found, various strategies are used to predict the class label of the test tweet. A fixed k value is used for all classes in these methods.
3.11 Decision Tree classifier algorithm
This is one of the supervised machine learning algorithms. This algorithm is used to solve the classification problems. The decision tree is used to create a classification model based on training data, that model can be used to predict the class label of test data sample. The algorithm uses tree representation structure to solve classification problem. Every internal node of decision tree belongs to an attribute of the dataset and leaf node belngs to class label of the test sample, such as spam or ham. In decision tree classification algorithm to predict class label of a record we start from the root of the tree. We compare the root node value with test record attribute value. We continuously compare test sample feature values with other internal node values of the tree. This process continuous until we reach the leaf node with predicted class label.
IV. EXPERIMENTS AND RESULT
This section presents results of our proposed methodology. Our experimental results are obtained on various Twitter datasets. To measure the performance of proposed system we have used three measures: Precision, Recall, F measure. Precision is defined as ratio of correct predictions of model by total number of predictions. Recall is the ratio of correct predictions of model to the total number of correct predictions.
Where TP is true positive correspond to spam tweets correctly predicted. FN is False negatives correspond to spam tweets wrongly predicted. False positive (FP) are normal tweets wrongly classified and True Negatives (TN) indicate normal tweets correctly predicted.
In this experiment, first we have performed dimensionality reduction on given training samples and we have obtained the principal components (PCs). The obtained number of the principal components are used to construct new original training dataset.. The new test tweets are also building with obtained principal components. The goal of PCA is to seek the optimal number of PCs which increase the spam detection rate. With these Principal Components, we train the Decision tree classifier and KNN classifier. The classifiers are tested with test dataset tweets.
Table 3. Performance of two classifiers on product review dataset
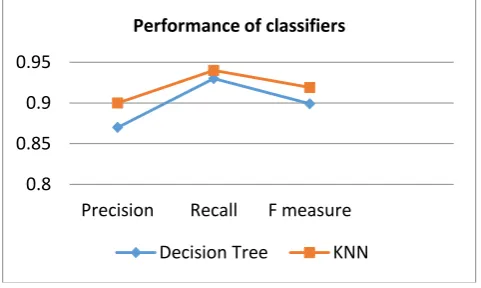
Classifier Precision Recall F Measure
Decision Tree
0.87 0.93 0.899
KNN 0.90 0.94 0.919
The KNN classifier has high precision and has the closer recall compared to decision tree algorithm. A comparison of performance of KNN and decision tree classifiers on different datasets with PCA is summarized in Table 8, and it is also plotted in Fig 2.
[image:5.595.305.546.413.557.2]
Fig 2. Measure of performance metrics of classifiers on review dataset
Table 4. Performance of two classifiers on Political Dataset
Classifier Precision Recall F
Measure Decision
Tree
0.90 0.92 0.909
KNN 0.91 0.93 0.919
The KNN classifier has high precision and Decision tree has the some more high Recall compared to KNN. A comparison of performance of KNN and decision tree classifiers on different datasets with PCA is summarized in Table 8, and it is also plotted in
Fig 3. 0.8 0.85 0.9 0.95
Precision Recall F measure Performance of classifiers
[image:5.595.297.544.634.697.2]Fig 3. Measure of performance metrics of classifiers on political dataset
Table 5. performance of two classifiers on Entertainment Dataset
The above table describes the Decision tree classifier has high precision and recall compared to KNN classifier. A comparison of performance of KNN and decision tree classifiers on different datasets with PCA is summarized in Table 5, and it is also plotted in Fig 4.
Fig 4. Measure of performance metrics of classifiers on entertainment dataset
Table 6. performance of two classifiers on Sports Dataset
Above table describes the KNN classifier has high precision and recall compared to Decision tree classifier.A
comparison of performance of KNN and decision tree. classifiers on different datasets with PCA is summarized in Table 6, and it is also plotted in Fig 4.
Fig 5. Measure of performance metrics of classifiers on entertainment dataset
Table 7. Performance of two classifiers on Disaster Dataset
Table 6 describes the KNN classifier has high precision and recall compared to decision tree classifier. A comparison of performance of KNN and decision tree classifiers on different datasets with PCA is summarized in Table 7, and it is also plotted in Fig 6.
Fig 6. Measure of performance metrics of classifiers on Disaster Dataset.
0.88 0.89 0.9 0.91 0.92 0.93 0.94
Precision Recall F measure performance of classifers
Decision tree KNN
0.89 0.9 0.91 0.92 0.93 0.94 0.95
Precision Recall F measure performance of classifiers
Decision Tree KNN
0.88 0.9 0.92 0.94 0.96
Precision Recall F measure Performance of classifiers
Decision Tree KNN
Classifier Precision Recall F Measure
Decision Tree
0.91 0.93 0.919
KNN 0.92 0.94 0.929
Classifier Precision Recall F Measure
Decision Tree
0.92 0.94 0.929
KNN 0.93 0.95 0.939
Classifier Precision Recall F Measure
Decision Tree
0.91 0.95 0.929
KNN 0.93 0.95 0.939
0.9 0.92 0.94 0.96
Precision Recall F measure Performance of classifiers
Table 8. Comparision of two classifiers performance on different datasets.
A comparison of performance of KNN and decision tree classifiers on different datasets with PCA is summarized in Table 8.On all datasets KNN classifier with PCA has out performs compare to decision tree classifier with PCA.
V. CONCLUSION
Social media networks are widely used communication channels to exchange information all over the world. Along with the benefits of social media networks, some of spammers spread unwanted information into network. This data misguide the genuine users. In this paper, we used PCA algorithm to reduce the dimensionality of dataset. In this paper, we proposed decision tree classifier and KNN classifiers for binary classification different twitter datasets. In this paper, we work on precision, recall and F measure for all datasets. In this work, feature extraction has been performed using principal component analysis. It is observed that dimensionality reduction with PCA using KNN classifier gives better performance on all proposed datasets compared to Decision tree classifier. To further improve the spam detection accuracy in Twitter data in future work we will use integrated approach. In future work, we will also use advanced dimensionality reduction methodologies and machine learning algorithms to detect spam messages.
REFERENCES
1. C. Grier, K. Thomas, V. Paxson, and M. Zhang, “@spam: The underground on 140 characters or less,” in proc. ACM conf. Computer communication security, 2010, pp. 27-37.
2. Y Boshmaf, I.Muslukhov, K Beznoson, and M. Ripeanu, “ design and analysis of social botnet,” computer networks, vol. 57, no. 2, pp. 556-578, 2013.
3. Arora, Harsha, Govinda Murali Upadhyay, “A framework for the detection of Suspicious Discussion on online forum using integrated approach of support vector machine and particle Swarm Optimization”, international Journal of Advanced research in computer science, 2017.
4. M. Kirby, L. Sirovich, “Application of the Karhunen loeve Procedure for the Characterization of Human Faces”, IEEE Transactions on Pattern analysis and Machine Intelligence, vol. 12, no. 1. Pp. 103-107, 1990.
5. M. McCord, M. Chuah, “Spam Detection on Twitter Using Traditional Classifiers”, pp. 175-186, Springer, 2011.
6. Gianluca Stringhini, Christopher Kruegel, Giovanni Vigna, “Detecting Spammers on Social Networks”, Proceedings of Annual Computer Security Applications Conference, 2010.
7. Alex Hai Wang, “ Machine Learning for the detection of Spam in Twitter Networks”, pp. 319-333, Springer, 2012.
8. Igor Santos, Igor minambres Marcos, Carlos Laorden, Patxi Galan Garcia, Aitor Santamaria Ibirika and Pablo Garcia Bringas, “Twitter Content based Spam Filtering”, international Joint conference SOCO, Advances in intelligent systems and computing, springer.,2014. 9. Jaffali Soufience, jamoussi salma, “Text document dimension
reduction using Principal Component Analysis”
10. Z. Elkhadir, K. Chougdali, M. Benatton, “ Intrusion Detection System Using PCA and Kernel PCA Methods”,IAENG International Journal of Computer science, 43:1, 2016.
11. Mohd Fazil, Muhammad abulaish, “ A hybrid approach for detecting automated spammers in Twitter”, IEEE, 2018.
12. Meet Rajdev, Kyumin Lee, “ Fake and spam Messages: Detecting misinformation during natural disasters on social media”, ACM international conferences on web intelligence and intelligent agent technology, IEEE, 2015.
13. surendra Sedhai, Aixin sun, “Semi supervised spam detection in twitter stream”, IEEE Tranactions on computational Social systems, IEEE, 2017.
14. Zakia Zaman, Sadia Sharmin, “ Spam detection in social media employing machine learning tool for text mining”, 13th International conference on signal image technology & internet based systems, IEEE, 2017.
15. Sumaiya Pathan, R. H. Goudar, “Detection of spam messages in social networks based on SVM”, International Journal of Computer Applications, Vol. 145, No. 10, 2016.
16. Sheela. N, L. Basavaraj, “Analysis of gabor filter based features with PCA and GA for the detection of drusen in fundus images”, International journal of Engineering &technology, 7(1), 2018. 17. Zahra Mashayekhi, Ali HarounAbadi, “ a hybrid approach for spam
detection based on decision tree algorithm and neural network”, International journal of mechatronics, electrical and computer technology (IJMEC), vol. 7(25), jul. 2017.
18. M.Ramya, J.Alwin Pinakas, “Different type of feature selection for text classification”, International journal of computer trends and technology(IJCTT), vol. 10, number 2, 2014.
19. Saumya Goyal, R. K. Chauhan, Shabnam Parveen, “Spam detection using KNN and Decision tree mechanism in social network”, Fourth international conference on parallel, Distributed and Grid computing, IEEE, 2016.
20. Chen Liu, Genying Wang, “ Analysis and detection of spam accounts in social networks”, 2nd IEEE international conference on computer and communications, 2016.
BIOGRAPHIES OF AUTHORS
Mr K Subba Reddy is PhD student in Department of Computer Science and Engineering, Acharya Nagarjuna University, Guntur, India. He has published papers in international conferences and journals. His area of interest is Big Data, Data mining and machine learning. He may be contacted .
Dr E Srinivasa Reddy, PhD., is currently serving as principal in University College of Engineering and Technology and also serving as Head of Department in Computer Science and Engineering, Acharya Nagarjuna University, Guntur, India. He has more than 24 years teaching experience. He is guiding PhD to 8 scholars and 15 has completed his PhD. Dissertations and contributed 45 articles in conferences and 120 papers in Research Journals. His area of interest is Image Processing and Data mining. He may be contacted
Precision Recall F measure
Dataset KNN Decisi
on Tree
KN N
Deci sion Tree
KNN Decisi
on Tree Product
Review
0.90 0.87 0.94 0.93 0.919 0.899
Political 0.91 0.90 0.93 0.92 0.919 0.909
Entertain ment
0.92 0.91 0.94 0.93 0.929 0.919
Sports 0.93 0.92 0.95 0.94 0.939 0.929