International Journal of Innovative Technology and Exploring Engineering (IJITEE) ISSN: 2278-3075, Volume-9 Issue-1, November 2019
Abstract: Fruit grading is a process that affect quality control and fruit-processing industries to meet the efficiency of its production and society. However, these industries have suffered from lack of standards in quality control, higher time of grading and low product output because of the use of manual methods. To meet the increasing demand of quality fruit products, fruit-processing industries must consider automating their fruit grading process. Several algorithms have been proposed over the years to achieve this purpose and their works were based on color, shape and inability to handle large dataset which resulted in slow recognition accuracy. To mitigate these flaws, we develop an automated system for grading and classification of apple using Convolutional Neural Network (CNN) used in image recognition and classification. Two models were developed from CNN using ResNet50 as its convolutional base, a process called transfer learning. The first model, the apple checker model (ACM) performs the recognition of the image with two output connections (apple and non-apple) while the apple grader model (AGM) does the classification of the image that has four output classes (spoiled, grade A, grade B & grade C) if the image is an apple. A comparison evaluation of both models were conducted and experimental results show that the ACM achieved a test accuracy of 100% while the AGM obtained recognition rate of 99.89%.The developed system may be employed in food processing industries and related life applications.
Keywords: Convolutional Neural Network, ResNet50, Artificial Neural Network, Machine learning, Computer vision.
I. INTRODUCTION
O
ne of the largest sectors and a major contributor to the economic growth of any nation is agriculture. Fruit production is one of its application areas that has made this sector important. Ever since ancient times, fruits have always contributed to the nutritional requirements of man which are vital for sustainable health (Sajad, Yousef & Gines, 2017). Fruits are processed to produce a wide range of fruit-based products such as fruit juice, candies, medicines, industrial chemicals and so much more, therefore, the quality of fruits is important in fruit-processing industries. Fruit grading can be seen as the process of placing fruits in categories based on their physical features such as its weight, size, color and texture in order to obtain better market value (Agriinfo,Revised Manuscript Received on November 05, 2019. * Correspondence Author
Adigun J. O *, Department of Computer Technology, Yaba College of Technology, Lagos, Nigeria. Email: [email protected]
Okikiola F. M., Department of Computer Technology, Yaba College of Technology, Lagos, Nigeria.
Aigbokhan, E. E., Department of Computer Technology, Yaba College of Technology, Lagos, Nigeria.
Rufai M. M., Department of Computer Technology, Yaba College of Technology, Lagos, Nigeria.
2018). In other words, fruit grading is a means of effecting quality control in fruit processing and to enforce this quality, certain visual features of the fruit are used as criteria for its classification. Classification of fruits is necessary in the evaluation of agricultural produce to check if it meets quality standards and as a result increase market value (Mandeep & Reecha, 2015).
Apple grading is a challenging area because of its variation of deficiencies in type and shape Payman, Alireza & Hossein (2016). However, manual methods are still employed to handle the task of sorting and grading this fruit. It has been noticed that the use of these methods have a lot of challenges such as deficiency of standard for quality products based on personal judgment of workers in their visual perception of the fruits, poor quantities of produce, fatigue and slow decision making on the part of the workers (Olaniyi et al, 2017). Therefore, if the work of classifying apples, in apple-processing industries, is done by an automated system, the work will be much faster and efficient and quality control will be made much easier (Mandeep & Reecha, 2015). To implement this system, we used Convolutional Neural Network (CNN) with which two models were developed. The first model, the apple checker model performs the recognition of the image by distinguishing between good and bad apples while the apple grader model does the classification of the image that is non-apple fruit. The proposed system is to discourse the inadequacies of the traditional method currently in use by workers in fruit processing industries. With this system in place, standards of quality can be assured, increase in the amount of fruits processed can be guaranteed that would meet the ever increasing demand in the society and improve product market value. Section two is the related works, section three describes the methodology, section four contains the implementation &evaluation and the conclusion of the paper is in section five.
II. RELATEDWORKS
Over the years, researchers have employed scientific solutions built on machine learning and computer vision to address the problem of classifying and grading fruit. Suresha, Shilpa & Soumya (2012) presented an automatic grading system of apples using Support Vector Machine (SVM) Classifier. The authors acquired 90 images apples and classified them as red and green. The threshold segmentation was employed to segment apple images from the background. Average red and green color components are used to classify of apples. The proposed system obtained 100% accuracy. Rosli et al (2012) applied methodologies that apply statistical analysis, fuzzy image processing and content predicated to determine the grading of local
production of mango in Perlis and
Automated System for Grading Apples using
Convolutional Neural Network
obtained 80% accuracy. Arjenaki, Moghaddam & Motlagh (2013) developed a machine vision system for sorting tomatoes
based on four classes: its shape, maturity, size and color. Probabilistic Neural Network (PNN) was used to classify the tomatoes into a recognition accuracy of 84.4%.
Harpreet & Baljit (2013) did a research on Multi-Class Support Vector Machine (SVM) algorithm to grade rice Maximum Variance method was used to extract the chalk and rice kernels from background. The accuracy of 86% was obtained. Pragati & Shikha (2014) proposed a new fruits recognition techniques using K-Nearest Neighbor algorithm and combined four feature analysis methods: shape, size, color and texture based methods. 36 fruit images were collected for training and testing. The recognition accuracy was 95% However, Giacomo Capizzi et al (2015) developed an automatic fruit defect classification system based on color and texture features. The authors used Gray Level Co-occurrence Matrix (GLCM) to extract the texture features and Radial Basis Probability Neural Networks (RBPNN) to perform the classification. They reported an accuracy of 88%.
A date fruit classification system using texture descriptors and shape-size features was developed by Mohammed (2015). Local Binary Pattern (LBP) and Weber Local Descriptor (WLD) techniques was used to extract the features and classify the fruits. A recognition accuracy of 98% was reported. Also, Hosein et al (2017) developed an online grading system for peeled pistachios using support vector machine with a cubic polynomial kernel function. An accuracy of 99.17% was achieved. Olaniyi et al (2017) developed an automatic system for grading bananas using GLCM texture extraction and neural network arbitrations. The authors employed Global Level Co-occurrence Matrix to extract texture features and then developed three classifiers using Radial Basis Function Network (RBFN), Support Vector Machine (SVM) and Backpropagation Neural Network (BPNN). The researchers had a dataset of 200 images out of which 120 was used for training and 80 for testing. The tests shown 96.25% accuracy for RBFN, 100% accuracy for SVM and 98.8% for BPNN and concluded that SVM is the more efficient algorithm for grading process.
A research work on oil palm fruit grading was conducted by Bensaeed et al (2017)using a hyper spectral device to scan the bunches of the fruit and then using an Artificial Neural Network (ANN) model to classify the fruit. 95% accuracy was achieved. Ishikawa et al (2018) implemented a system for the classification of strawberry fruit shape by random forest classification algorithm and used four types of descriptors: the measured values which comprises the length of the contour lines, the area, the fruit length and width, and the fruit width/length ratio; the ellipse similarity index; elliptic fourier descriptors; and chain code subtraction. An agreement ratio of 70% was achieved. One problem with using Random Forest is that they are not easily interpreted. However, existing performance had some flaws: inability to handle large data set and relies on assumptions. Based on their limitations shown in Table 2.1, this research focused on using Convolutional Neural Network models to improve the grading of apples.
Table 2.1: Comparison analysis of existing Techniques
S/N Author(s) Strategy Limitations Performanc e (%) 1 Suresha et
al (2012)
SVM Inability to handle large dataset
100
2 Arjenaki et al (2013)
PNN Relies on assumptions
84.4
3 Giacomo et al (2015)
GLCN, RBPNN
Required a lot of preprocessin g
88
4 Bensaeed et al (2017
ANN Not reported 95
5 Ishikawa et al (2018)
Random Forest
Not easily interpreted
70
III. METHODOLOGY
Figures 1 and 2 show the block diagrams of the two models developed. The Apple Checker model and the Apple Grader model were developed using ResNet50 as its convolutional base, a process called transfer learning. The development of these models involved three main phases: Acquisition, data augmentation and feature extraction and classification.
A. Data Acquisition
[image:2.595.310.544.454.524.2]The first phase was the acquisition of both apple and non-apple images. These images were from Fruit Images Dataset by Horea Muresan (2018) and Golden Apple Database by COFILAB (2015) and other sources from internet. A total of 8271imageswas downloaded and contains both good, bad and non-apples images. For the next two phases, the dataset was split into train set, validation sets and test sets. Fig. 1 shows a sample of dataset.
Fig. 1.Sample of Dataset Used B. Data Augmentation
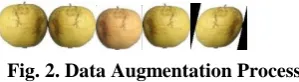
[image:2.595.365.515.648.689.2]This phase was necessary to avoid overfitting. The data augmentation methods used were re-scaling, shearing, zooming and horizontal flipping. All four methods were carried out on the train set. Re-scaling was, however, performed on the test set. The first one is the image before data augmentation was applied, followed by the image after rescaling, shearing, zooming and horizontal flipping was done.
Fig. 2.Data Augmentation Process C. Feature Extraction and Classification
The feature extraction and classification process was carried out and the dataset was divided into training sets, validation sets and testing sets. For both models, two densely connected layers were added to the
International Journal of Innovative Technology and Exploring Engineering (IJITEE) ISSN: 2278-3075, Volume-9 Issue-1, November 2019
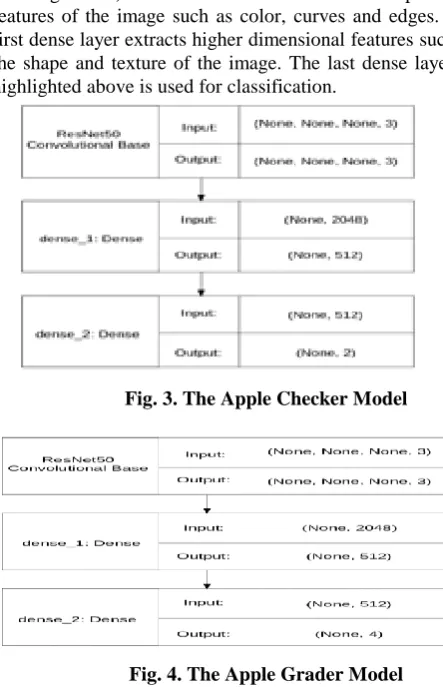
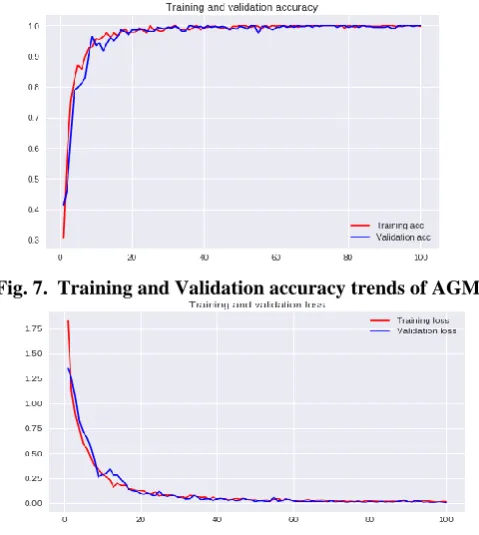
[image:3.595.51.273.131.475.2]models lies in the final densely connected layer (which can be noticed from figure 3 and 4): the Apple Checker Model (ACM) has two output connections (because it classifies the image into two classes, apple and non-apple) while the Apple Grader Model (AGM) has four output connections (because it classifies the image into four classes, spoiled, grade A, grade B and grade C). The convolutional base extracts primitive features of the image such as color, curves and edges. The first dense layer extracts higher dimensional features such as the shape and texture of the image. The last dense layer as highlighted above is used for classification.
Fig. 3.The Apple Checker Model
Fig. 4.The Apple Grader Model Below is the equation of the ResNet50 base model:
; where: is the convolutional
base
is the residual mapping to be learned.
This residual mapping is a function that determines the amount the predicted is away from the actual; is the input dimension;
are the set of weights across the 50 layers of the ResNet50 architecture; will then be fed into the first fully connected layer to give:
;
where:
is the output of the first fully connected layer.
and are the associated weights and biases. will
then be serve as the input to the final fully connected layer.
D. Training, Validation and Testing
To train the Apple Checker Model, 3500 sample images were used. 2100 sample images were used for training while 1400 images were used for testing. It took 7 minutes to train the model. Both the training and validation of this model was with a batch size of 15 and a maximum target size of 224 x 224 using a categorical cross entropy loss function and Stochastic Gradient Descent (SGD) as its optimizing function. The
learning rate used was 1e-4 and the number of epoch used was 100 with a step size of 25 per epoch. This model achieved a test accuracy of 100%. The system is based on these two models. The figures 5 and 6 show the graphs of the training and validation accuracy and loss trends during the process: 100% training accuracy was achieved with a loss of 0.50% while 100% validation accuracy was achieved with a loss of 0.28%. This means that the model can accurately classify the images with which it was trained as been either apples or not apples with approximately 100% accuracy with an extremely small probability of been wrong.
[image:3.595.56.266.190.363.2]We also evaluated the model by using dataset that it was not trained with. This we did using the test dataset. The testing of this model was done using the test dataset with a batch size of 15 and a maximum target size of 224 x 224. The result was a test accuracy of 100%. This means that our model was able to classify the images in the test dataset with an approximate accuracy of 100%. This further implies that our model will do reasonably well when performing its classification tasks with unfamiliar data. From the results obtained during the training, validation and testing of the model, there was overfitting encountered. This is because the accuracy metric for the training, validation as well as the testing process are approximately the same. This implies that the performance of the model is not subject to familiar data but even to unfamiliar once as well
Fig. 5.Training and Validation accuracy trends of ACM
Fig. 6.Training and Validation loss trends of ACM
(i) The following algorithm was used to train the Apple Checker model
Step 1: Load the dataset;
Step 2: Split the dataset into train, validation and test sets; Step 3: Perform data augmentation on the train and test
dataset;
Step 4: Instantiate the model with
the ResNet50
[image:3.595.310.542.362.635.2]Step 5: Add the first dense layer comprising 512 connection points and a rectified linear unit activation function; Step 6: Add the second dense layer comprising 2 connection
points and a softmax activation function; Step 7: Compile the model;
Step 8: train the model with 100 epochs, a batch size of 15 and a step size of 25;
Step 9: Save the model
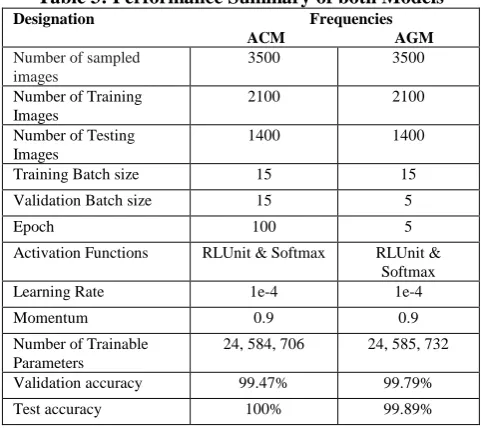
[image:4.595.347.501.120.298.2]The second model was trained with 60% of the samples images, 40% samples of the datasets were used for testing.24 minutes was used to train the model. Like the Apple Checker Model, the training process was carried out with a batch size of 15 while the validation process was carried out with a batch size of 5. Also, categorical crossentropy was used as its loss function while the SGD optimizer and learning rate was used for the Apple Checker Model. The number of epochs used to carry out the training and validation was 5 with no step size. The time it took to train this model was approximately 7 minutes. The time it took to train this model was approximately 24 minutes. A test accuracy of 99.89% was achieved. Below is the graph showing the training and validation accuracy as well as the training and validation loss trends of AGM.
[image:4.595.47.287.322.590.2]Fig. 7. Training and Validation accuracy trends of AGM
Fig. 8. Training and Validation loss trends of the AGM (ii) The following algorithm was used to train the Apple Grader model:
Step 1: Load the dataset;
Step 2: Split the dataset into train, validation and test sets; Step 3: Perform data augmentation on the train and test
dataset;
Step 4: Instantiate the model with the ResNet50 convolutional base;
Step 5: Add the first dense layer comprising 512 connection points and a rectified linear unit activation function; Step 6: Add the second dense layer comprising 4 connection
points and a softmax activation function; Step 7: Compile the model;
Step 8: train the model with 5 epochs and a batch size of 5; Step 9: Save the model
[image:4.595.303.546.322.627.2]The results of both models implies they will do reasonably well with data outside of the dataset used. It is based on these two models that the prototype system is built. Fig. 9 shows the flowchart while Fig. 10 shows the system architecture of the automated system.
Fig. 9.System flowchart
(iii) Based on these, the algorithm below was used to develop the automated system:
Step 1: Input image;
Step 2: Process the image with the Apple checker model Step 3: If the image is not an apple then display “Not an
apple” else pass control to the Apple Grader Model; Step 4: If the result from the Apple Grader Model shows the apple is spoiled then display “The apple is spoiled” else display the appropriate grade
Fig. 10. System architecture (iv) Mathematical Model
(a) For the Checker Model, the equation is as follows: ; where:
where
and
[image:4.595.351.501.432.622.2]International Journal of Innovative Technology and Exploring Engineering (IJITEE) ISSN: 2278-3075, Volume-9 Issue-1, November 2019
and are the associated weights and bias which is a length 2 1-dimensional array.
(b) For the Apple Grader Model, the equation is as follows: ; where:
where
and
is the output for the Apple Checker Model
and are the associated weights and bias which is a length 4 1-dimensional array.
To predict the class a given input image belongs to using either models, the expression below was utilized:
where: is a function that returns the index of the array with the maximum value
IV. IMPLEMENTATIONANDEVALUATION
[image:5.595.314.516.57.186.2]Three test cases were developed to evaluate the system. The first test case was to check the system’s ability to distinguish apple fruits from non-apple fruits. The dataset used in this system is divided into three parts: the training, validation and testing datasets. The training dataset used was 62%, At a learning rate of 1e-4 and a momentum rate of 0.9, the best performance is obtained from the network. At this same point, the number of trainable parameters was varied. 40% sample images were used to test the already-trained network to obtain the performance of the network. Test accuracy of 100% and validation accuracy of 94.47% was obtained for ACM and validation accuracy of 99.79% and test accuracy of 99.89% for AGM were obtained for AGM from the tested system. Also, during the activation function, some parameters were varied and these parameters include the trainable and non-trainable in which train accuracy of 100% is obtained for ACM and 99.66% for AGM.
Table 3: Performance Summary of both Models Designation Frequencies
ACM AGM Number of sampled
images
3500 3500
Number of Training Images
2100 2100
Number of Testing Images
1400 1400
Training Batch size 15 15
Validation Batch size 15 5
Epoch 100 5
Activation Functions RLUnit & Softmax RLUnit & Softmax
Learning Rate 1e-4 1e-4
Momentum 0.9 0.9
Number of Trainable Parameters
24, 584, 706 24, 585, 732
Validation accuracy 99.47% 99.79%
[image:5.595.313.527.294.428.2]Test accuracy 100% 99.89%
[image:5.595.48.289.512.726.2]Fig. 11. Test Case with non-apple fruit From the bar-chart above, we can see that the probability that the fruit is not an apple is very high. The small probability attached to it been an apple is due to the fact that an orange has similar shape to that of an apple. Therefore, it has some characteristics of an apple but it is not one. The second test case is to check the system’s ability to distinguish a bad apple from a good one (see figure 11).
Fig. 12. Test case with spoiled apple fruit From the bar-chart above, we can see that the probability that this apple fruit is spoiled is very high. The small probability attached to the other categories suggests that the apple fruit has some features associated with the other categories. This can be clearly seen from the image of the fruit. A part of the fruit looks good but the fruit is actually spoiled. The third test case involves checking if the system is able to grade a good apple.
Fig. 13. Test case with good apple The result of the test shows that the probability of the above image been a grade A apple is very high. Also, the prediction function in the mathematical model makes a call to the softmax function which takes the learned features of the image and generates a probability of each class instance. The argmax function then takes this array of probabilities and get the index of the class with the
[image:5.595.325.533.546.668.2]the ACM are represented as follows: Apple class at index 0 and Not Apple class at index 1. In Table 4, the developed result was compared with previously related works not only on accuracy but also on the strategy used.
[image:6.595.68.276.294.407.2]The classes in the array of the prediction of the AGM are represented as follows: Bad Apple class at index 0, Grade A class at index 1, Grade B class at index 2 and Grade C at index 3. Therefore, if the prediction array for ACM is [0.98, 0.125] then the argmax function returns the index 0 because the value at that index is the maximum in the array and since the Apple class is represented by the index 0, the result of the prediction is that the probability of the image being an Apple is 98% or 0.98. Similarly, if the prediction of the array for AGM is [0.1, 0.85, 0.2, 0.3], then the argmax function returns the index 1 because the value at that index is the maximum in the array and since Grade A is represented by the index 1, the result of the prediction is that the probability of the image being Grade A is 85% or 0.85.
Table 4: Performance evaluation of the developed system with related proposed works
Author Feature used Recognition
rate %
Arjenaki et al (2013) PNN 84.4
Giacomo et al (2015)
GLCN, RBPNN 88
Bensaeed et al (2017
Olaniyi et al (2017)
ANN RBFN, SVM
BPNN
95 100
Developed System CNN, ResNet50 100
V. CONCLUSION
This research developed an automated system for grading apples. This was done to help overcome the limitations of the traditional approach and also to reduce the amount of data pre-processing involved when using other machine learning algorithms. Two Convolutional Neural Network models where developed. The first model, the Apple Checker model, was used to perform image recognition while the second model, the Apple Grader model, was used to perform image classification. The outcomes from the test cases developed shows the high performance of both models because CNN with ResNet50 was used. This research focused on the external features of the fruit. However, the need to grade fruits based on its internal features is equally important. With this developed system, standards of quality and amount of fruits processed can be guaranteed that would meet the ever increasing demand in the society and improve product market value. Further research could be conducted in this area of internal features
REFERENCES
1. Agriinfo (2015). Grading of fruits and vegetables. Retrieved
September 30, 2018. From
http://agriinfo.in/default.aspx?page=topic&superid. 2. Arjenaki O., Moghaddam P. & Motlagh A.(2013).
3. Online tomato sorting based on shape, maturity, size, and surface defects using machine vision, Turkish Journal of Agriculture and Forestry, 37, pp. 62-68. http://doi.org/10.3906/tar-1201-10
4. Bensaeed et al (2017). Oil palm fruit grading using a hyperspectral device and machine learning algorithm, IOP Conf. Ser.: Earth Environ. Sci. 20 012017, pg 1-29. https://doi.org/10.1088/1755-1315
5. Dr. Usha, Dr Karthik & Jenifer (2017). Automated Sorting And Grading of Vegetables Using Image Processing, International Journal
of Engineering Research and General Science Volume 5, Issue 6, pg 53-61. ISSN 2091-2730
6. Giacomo Capizzi et al. (2015). "Automatic Classification of Fruit Defects based on Co-OccurrenceMatrix and Neural Networks", Proceedings of the Federated Conference on Computer Science and Information Systems, 5, pp. 861– 867. http://doi.org/10.15439/
7. Harpreet Kaur, Baljit Singh (2013). Classification and Grading Rice Using Multi-Class SVM, International Journal of Scientific and Research Publications, 3(4). ISSN 2250-3153
8. Hosein et al. (2017). Design, development and evaluation of an online grading system for peeled pistachios equipped with machine vision technology and support vector machine, INFORMATION PROCESSING IN AGRICULTURE, 4, pg. 333–341.
http://dx.doi.org/10.1016/j.inpa.
9. Ishikawa et al. (2018). Classification of strawberry fruit shape by machine Learning, the international archives of the photogrammetry, remote sensing and spatial information sciences, volume xlii-2, pg. 463-470.https://doi.org/10.5194/isprs-archives-XLII-2-463-2018 10. Mandeep & Reecha (2015). Quality Detection of Fruits by Using ANN
Technique, IOSR Journal ofE lectronics and Communication Engineering, 10. ISSN:2278-8735 PP 35-41
11. Muhammad, Ghulam (2015). "Date fruits classification using texture descriptors and shape-size features.", Engineering Applications of Artificial Intelligence361-367.
12. Olaniyi et al (2017). Automatic System for Grading Banana Using GLCM Texture Feature Extraction and Neural Network Arbitrations,
Journal of Food Processing Engineering,
40.http://doi.org/10.1111/jfpe.12575
13. Pragati Ninawe, Shikha Pandey (2014). A Completion on Fruit Recognition System Using K-NearestNeighbors Algorithm, International Journal of Advanced Research in Computer Engineering &Technology (IJARCET), 3(7). ISSN: 2278 – 1323
14. Rosli B. Razak1, Mahmod B. Othman, Mohd Nazaribin Abu Bakar (2012). Mango Grading By UsingFuzzy Image Analysis, International Conference on Agricultural, Environment and Biological Sciences (ICAEBS'2012), pp 18-22.
15. Sajad S., Yousef A., Gines G. (2017). A new approach for visual identification of orange varieties using neural networks and metaheuristic algorithms, Information Processing in Agriculture 5 (2018) 162–172. https://doi.org/10.1016/j.inpa.2017.09.002 16. Suresha M., Shilpa N.A, Soumya B. (2012). Apples Grading Based On
SVM Classifier, International Journal of Computer Applications (0975–8878) On National Conference on Advanced Computing and Communications - NCACC, April 2012
AUTHORSPROFILE
Adigun Johnson Oyeranmi obtained his PhD Computer Science from Ladoke Akintota University of Technology Ogbomoso, Oyo State, Nigeria. He has Master’s degree in Computer
Science from University of Lagos. He is a member
of Nigeria Computer Society of Nigeria and Computer Professionals Council of Nigeria. His current research interests span the fields of artificial intelligence, pattern recognition, machine learning and medical image analysis. He has published more than 30 research papers in the leading International Journals and Conference proceedings. Dr. Adigun has written /edited 10 books. He is a reviewer of many International Journals.
Okikiola Folasade Mercy is a Lecturer in Computer Technology Department, Yaba College of Technology, Yaba, Lagos, Nigeria. She holds a Bachelor of Science (B.Sc.) degree in Computer science from University of Ado, Ekiti State and a master (M.Sc.) degree in Computer Science from Federal University of Technology, Akure, Ondo State. She is a member of Computer Professionals of Nigeria (CPN) and Nigeria Computer Society (NCS)
Aigbokhan Edwin E. is a Lecturer in the Department of Computer Technology, Yaba College of Technology, Lagos-Nigeria. He had his Bachelor of Science (B.Sc.) and Master of
International Journal of Innovative Technology and Exploring Engineering (IJITEE) ISSN: 2278-3075, Volume-9 Issue-1, November 2019
of Benin and University of Lagos respectively. He is a registered member of Nigeria Computer Society (NCS) and Computer Professional -Registration Council of Nigeria (CPN). He is also an IT consultant and author of several computer science books. He is currently a PhD research student at Department Computer Science, University of Lagos, Nigeria