Abstract— This paper intends to breach the gap between nature and engineering structures by providing a comprehensive literature review of replicating nature’s design in structural systems subject to lateral loading. This study explores how trees adapt to adverse environment by enhancing their physical and mechanical properties through the change of its physical shape or design. The transitional shape profile was introduced into some mechanical problems to improve its fatigue lifespan without superfluous material. Hence, this approach may be introduced in civil engineering structures to enhance structural performance and efficiency in terms of carrying lateral loads from wind or earthquake.
Index Terms—Lateral Load, Nature’s Design, Lateral Load, Tree Structure, Dynamic Properties.
I. INTRODUCTION
Dealing with various types of lateral loading on structures can be a difficult challenge for civil engineers especially when economy and efficiency is considered. A majority of research on lateral loading leads to the adoption of a separate mechanical system (e.g. bracing, shear wall, active or passive control devices) to absorb the excess energy rather than changing the topography of the structure. The understanding as to why certain living things take on a given shape or structure may provide a feasible solution to this problem. The most probable reason owing to this shape in nature is to maintain a surface state of homogeneity to reduce localised stress. Tree structure are one of nature’s intriguing designs that demonstrate its own way in evolving and coping with a diverse range of lateral loadings that includes strong wind. The development and growth of trees (e.g. buttresses) may provide better insight into creating a better notch design in engineering components. Optimization techniques may then be applied on the basic
Revised Manuscript Received on April 12, 2019.
Yap Kian Lim, Department of Civil Engineering, Faculty of Science and Engineering, University of Nottingham Malaysia, Malaysia, (Email: [email protected])
Anwar Mohammed Parvez, Department of Civil Engineering, Faculty of Science and Engineering, University of Nottingham Malaysia, Malaysia.
Jayaprakash Jaganathan, School of Civil Engineering, Vellore Institute of Technology, India (Email: [email protected])
Wael Elleithy, Department of Civil Engineering, Faculty of Science and Engineering, University of Nottingham Malaysia, Malaysia
Lau Teck Leong, Department of Civil Engineering, Faculty of Science and Engineering, University of Nottingham Malaysia, Malaysia
Yeong Tuck Wai, Department of Civil Engineering, Faculty of Science and Engineering, University of Nottingham Malaysia, Malaysia
contour found in nature to derive a suitable shape or topography for a stronger more durable and structure. Hence, replicating nature’s design like trees in enhancing structural performance may result in a more sustainable and efficient structure.
II. STUDYING AND REPLICATING FROM
NATURE
The study on nature’s biological structure and its unique properties has laid the foundation for “Biomimicry”. Successful integration of biomimicry includes gecko tape, bone tissue regeneration using coral and marine sponges, densification of material through viral and many other discoveries. This provide engineers a step forward in copying or incorporating more living designs in building structures. Most biological structures are generally adaptive and made up of elastic material. They can grow or degenerate material throughout its structure to reduce stresses that ultimately leads to increasing fatigue life without any superfluous material [1]–[4]. Biological structures can grow into its ideal shape with no or minimal notch stresses to better survive in the environment it grows in [1]–[4].
A. Homogenous Stress Distribution in Nature
Stress concentration factor (SCF) is a dimensionless factor that quantifies stress localisation. Mattheck [1]–[4] believe that a good mechanical design should have a homogeneous stress distribution along its surface; and to have a constant Mises-stress along its surface, it must be mechanically optimized. A good example of this design can be found in trees. There are some evidence suggesting that a tree can detect changes in mechanical stresses and strains (stretching and compression) through the cambium of the tree [5]. They are able to distribute stresses efficiently along its surface to prevent localised peak stresses and to avoid potential failure points [1]–[3], [6], [7]. Applying mechanical load on a tree with a heavy stone can create a high-localised contact stress, the tree responds to the changes experienced by forming new wood cells or also known as an “overgrowth” method. The additional growth
Feasibility of Replication and Optimization
of Nature's Design Shapes in Civil
Engineering Structures to Enhance
Performance and Efficiency: A review
Performance and Efficiency: A Review
increases contact area that in turn reduces the contact stress [3], [8]. The formation of buttresses is also due to the increase stresses along its tree trunk. The stresses experienced by the tree throughout its lifetime can be seen in the cross section of the tree trunk (growth rings). The tree compensates this effect by forming buttresses for an increased cross section. However, its mechanism in the formation of new wood is unclear [5]. Ultimately, the biological growth method follows the requirement of a constant Mises stress surface without stress peaks or concentration [3], [8].
B. The safety factor of nature’s design and current engineering designs
Addition of materials (or reinforcements) into the core structure are common in civil and mechanical engineering designs to increase structural safety [9]–[11]. The building design codes for British Standards (BS) [12] and Eurocode (EC) [13] suggest the safety factor (SF) of a general structure to be within 2.5 – 3 for ultimate strength [14] and this value can be higher depending on the type and purpose of the structure. However, this is not the case in trees. It was earlier assumed to have a safety factor of around 1.5 before the discovery of its true strength by Mattheck [15]. Trees can have a safety factor of at least 4.5 [16]. If BS and EC [12], [13] would to apply a standard safety factor above 3, it will result in a very expensive massive building with limited working space. Trees are static and are required to resist occasional violent storms and winds. Trees need to grow tall and slender to reduce competition for light reception from neighbouring trees while being able to withstand breakage from wind loads, thus, the need for a higher safety factor [17]. Different trees or plants experience different stress magnification due to their material composition. If wood is calculated as an orthotropic material, the tree’s safety factor may reach above 5.4 [17]. Generally, one would favour the safety factor with lower limit for a reasonable assumption. Hence, trees have a safety factor of more than 4.5 [16]. The evolution success of trees allows it to survive the harshest environment.
C. Study of Growth Pattern in Trees
A tree can be subdivided into three sections, crown sail, stem and root anchorage [17]. These individual sections work together as a single continuous unit with an equally strong chain link to resists wind loads and to prevent breaking in weak sections. Similarly, civil engineering structures (e.g. multi-storey buildings), share a similar static and dynamic problem (in terms of its solid mechanics) with trees. Hence, it is rationally sound to replicate tree design in civil engineering.
D. Correlation between the development of tree
buttresses and its environmental condition
In studying the growth pattern of trees, it is found that the relationship between its crown asymmetry and its buttress formation is less correlated. However, many researchers have agreed that wind is an important factor to stimulate wood production in the development of buttress in trees. Quararibea asterolepis has its buttress height increased rapidly in accordance with its tree height [18]. Studies have shown that there are higher frequency of buttressed
formation in canopy trees, particularly in emergent [19]. Buttresses are believed to help prevent roots from splitting or snapping between its roots and the trunk as they can smoothly transmit, transfer and distribute internal forces between them [15].
E. Buttress in trees
The formation of buttress roots depends on both the species and the location it grown in. The extension of buttresses in trees is likely correlated to its soil type (texture), height and wind direction. The tree buttress tends to be larger, longer and more pronounce in wind prevailing area, wet, weak silty soils, shallow humus layer overlying rock and shallow waterlogged soils [4], [5], [20], [21]. Geographical location is another contributing factor as trees in the tropical rain forest are typically larger in size, higher in number and have more pronounce buttress roots than temperate forest or upland regions [5]. Many researchers [22]–[25] believed that large tree buttress is formed in trees that are tall or shallow rooted to increase stability and nutrients acquiring. Mehedi et al. [26] conducted a study on the buttress characteristics of trees (buttress height, mean buttress length, total buttress length and plus length of secondaries) and tree architectural parameters (diameter at breast height and tree height) at the Lawachara National park, Bangladesh. A total of 238 trees were analysed. Out of the 12 different species, only “Alstonia scholaris” did not have any buttress.
F. Root morphology
to width ratio of around 1 as it is a circular. Larger trees are believed to have greater number of sinker roots accompanied to their buttresses. There is a trend but it’s not statistically supported yet. Sinker roots appear in 10 out of 15 buttressed trees analysed by Crook [25]. The failure mechanism of the tree rooting system (buttressed and non-buttressed trees) is illustrated in Figure 1 and Figure 2.
Figure 1: An illustration on how trees with buttresses fail (1) Buttresses without sinkers (2) Buttresses with sinkers
[image:3.595.56.280.150.451.2][25]
Figure 2: An illustration on how trees without buttresses fail. [25]
Majority of buttressed tree roots do not have sinker roots that assist in root anchorage. There is no extensive research done on the rooting structure but the sinker roots appeared in buttresses was similar to Crook et al. [25] description for Nephelium ramboutan. Sinker roots are found to be most effective in buttress roots that are in the windward direction. The buttressed tree with sinkers tends to delaminate instead of uprooting. Crook M. J. et al. [25] found that the anchorage strength of trees with buttresses (Aglaia and Nephelium; 10.6kNm) are almost twice the anchorage strength of trees without buttresses (Mallotus wrayi; 4.9kNm). Both buttressed and non-buttressed trees failed in their root system instead of trunk breaking. Non-buttressed trees tend to have an evenly distributed root system. Gordon [30] believe that the laterals of non-buttressed in the windward are thin and strong in tension while the leeward is thick and strong in bending. However, because of their thin roots and poor orientation for uprooting resistance in non-buttressed trees (M. Wrayi), it only restore or resist a small moment force which make uprooting easy [25], [31], [32]. The other plausible reason as to why some trees lacks the need of buttresses are because trees with tap roots or sinkers beneath its trunk can grasp firmly to the ground (due to the soil condition) to transmit bending forces from its trunk into ground [4], [20]. Buttresses are common in trees grown in soft soil as weaker soils transmit forces more poorly into the
ground [5]. Hence, the lateral roots are stressed further down their length causing the formation of buttresses.
G. Relationship between tree height, diameter of tree stem and buttress height
To understand the formation of buttress in buttressed trees, graphs were plotted and extrapolated against its tree height, diameter of tree trunk at breast height and buttress height. Mehedi et al. [26] found that the relationship between them have some significance but the buttress height has a better or stronger relationship with its tree height than its tree trunk diameter at breast height with (R2 = 0.30 vs R2
= 0.47) and its relationship is more or less a linear as shown in Figure 3. The buttress pattern in trees changes according to its mechanical stability. Flexural stiffness in the tree trunk is governed by the trunk’s diameter. Mehedi et al. [26] also found that the land slope has little to no effects on the buttress characteristics similar to Wahala et al. findings [33]. The buttress characteristics have a strong correlation with the canopy category. However, the under-storey and mid- canopy trees have less developed buttresses than emergent. Woodcock D.W. et al. [34] conducted a study on Elaeocarpus angustifolius in O’ahu with regards to the buttress growth pattern in trees as shown in Figure 5. Elaeocarpus angustifolius was originated from Australia and was planted in Hawaii in the 1930s. Woodcock D.W. et al. [34] found that the buttress height is strongly correlated with its tree diameter with r2 = 0.79 as shown in
Figure: 4 and Figure 5 and is in agreement with Chapman et al. [19] findings.
[image:3.595.314.519.421.506.2]**: p < 0.01
Figure 3: The relationship between tree height, diameter of tree trunk at breast height and buttress height at the
Lawachara National park, Bangladesh. [26]
Figure: 4: The relationship between the buttress height and the diameter of tree stem at the O’ahu, Hawaii. H1 is the distance where the buttress emerges from the tree to the ground. H2 is the distance where the buttress
[image:3.595.305.540.567.658.2]Performance and Efficiency: A Review
Figure 5: The relationship between the tree height and the diameter of tree stem at the O’ahu, Hawaii. [34]
Trees provide a lot of insight into how stresses are distributed efficiently along its different parts to prevent localised peak stresses and to avoid potential failure. Trees roots have evolved to counteract environment forces or soil conditions through buttresses that prevents roots from splitting or snapping between its roots and the trunk as they can smoothly transmit, transfer and distribute internal forces between them. Thus, replicating tree design in civil engineering structures may result in better performance under lateral loading.
III. SHAPE OPTIMIZATION INSPIRED BY NATURE
Shape optimization through biological means has long been widely used and accepted by many industries for many years. Stress calculation and stress controlled thermal expansion were used in the finite element method to simulate growth and reduction of notch stress. The solution of this method is attained when notch stresses are reduced to a bare minimum or stopped by functional limitations [35]. There are many types of optimization methods/tools available to optimize the desired product but regardless of the optimization method used, a similar converged design or solution can be obtained if the assumed parameters are the same or similar. It should also be noted that paper does not discuss any mentioned optimization method in detail.
A. Reducing Stress Concentration in Mechanical
Components with Notch Profiles
Notches are merely geometric details that can be found inevitably in any structural components. Stress concentrations often develop between joints or connections of structural component, thus, the efficiency and effects on the failure mechanism of the notch’s functionality depends on its geometrical transition along the shoulder fillet. An abrupt change in geometry at its shoulder can affect the stress concentration along its surface [36], [37]. Similarly, organic material tends to grow according to sections or areas with high-localised stress concentration.
B. Stress concentration on mechanical components with
different notch profiles applied
The basic understanding of notch stresses provided the foundation for the development of the pocket calculator method to optimise design quickly with ease. Circular
method is also known as the engineer’s notch. It starts with a 45o kink at its tolerable side followed by drawing a circle
segment with a sufficiently large radius that touches both the upper side and the 45o angle kink tangentially [35], [38].
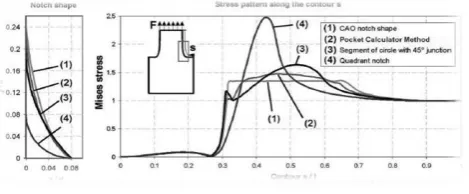
Computer Aided Optimization (CAO) is a method developed to solve an optimization problem. CAO remains the best optimization method in comparison to the other methods as shown in
Figure 6. In should be noted that even the pocket calculator method is still better than the traditional circle segment method [35]. This shows how the simplest
[image:4.595.309.546.163.355.2]optimization method or a slight change of the notch shape profile can reduce notch stress effectively.
Figure 6: Notch shape and stresses along the contour [35]
To determine the effects on the performance of mechanical components with different notch profile lengths, a set of test specimens as shown in Figure 7 were analysed by Albuquerque et. al. [36], [39] using ANSYS APDL v12 under plane stresses with 12 degrees of freedom. As expected, the optimized notch shape for each specimen as shown in Figure 8 has lower stress concentration than the original or non-optimized contour. An increased in the total overall length will not only increase the material required, it also increases the risk of buckling due to its additional length [36], [39]. The R/W ratio shows a stress concentration factor reduction of up to 18% when the ratio reaches towards a R/W value of 8 from 0.25 but the space required for a smooth transition curve is almost 1.5 times its original length. Its effectiveness diminishes with the increment of R/W ratio [36],
[image:4.595.310.545.434.531.2]specimen II for both optimized and non-optimized increases with the decrement of R/W ratio [36], [39]. A graph was plotted as shown in Figure 9 to obtain the best R/W ratio with the lowest stress concentration. The best R/W ratio in practice depends on its feasibility.
Figure 7: Specimens plotted using finite element modelling for different notch sizing [36], [39].
[image:5.595.310.543.178.288.2]Figure 8: Stress concentration of each specimen along the fillet [36], [39].
Figure 9: Stress concentration vs R/W ratio vs required length for specimen II [36], [39]
C. Nature Inspired Contours
Baud curve is a type of an empirical shape optimization that has a transition contour line with narrowing section of a beam suitable for bending and tensile. Two different contour lines were found for bending and tensile. In fact, large varieties of biological specimens (e.g. branches, antler joints, human tibia, etc.) follow a similar pattern of a modified Baud’s curve design [3]. However, the modified Baud’s curve applied in short beam is not suitable in the case of pure bending. In this case, a logarithmic spiral is a more suitable design for short beams under pure bending. The experiment was replicated by clamping the opposite end of the short beam and loading the free end with a single lateral load to induce a steep gradient of bending moment. A variation of the logarithmic spiral hook was created by ensuring the concave contour line was fixed while convex contour line was varied with a different “a” value. The samples were secured at the base [40]. All the logarithmical spiral contour curves exhibit an almost constant stress
distribution with no localised peak stresses [40]. The circular design was at a disadvantage in comparison to the logarithmic spirals [40]. This is due to the Mises stress iso-lines in the logarithmic spirals as they almost parallel to the concave contour as shown in Figure 10. Living creatures are self-optimizing and they often tend to optimize its structures to an almost uniaxial force flow. The uniaxial force flow in tree stems are directed axially while in animal claws, they are parallel to the curved contour [40].
Figure 10: The illustrations above shows the distribution of Mises stress iso-lines with (a) circular contours
designed by most engineers and (b) optimized logarithmic spiral design [40]
As first mentioned by Thompson [41], the logarithmic spiral design structure is a highly optimized design for short hooks and it may be well said to have the best claw design for the task at hand. The finite element modelling was conducted under a 2D analysis and only the horny segment of the claw was considered. The fibre orientation in the horny segment of the claw is believed to carry most of the work. However, a more uniform stress state may be achieved as a 3D analysis model [40].
D. Graphical optimisation method
Graphical optimisation method became possible as the understanding of notch stresses in nature is better understood, avoiding the need of complicated FEM-codes or models [3]. Graphical optimisation methods allow reworking and reshaping of geometry easier for both application and optimization of components with less or no calculation while meeting the geometrical limitations. Geometrical limitation or constraints are not limited to the interference with other components and spacing limits (e.g. extension of the curve along its shoulder). They are also varied accordingly to its application [36], [37].
E. Tree’s Notch (Method of Tensile Triangles) versus
Engineer’s Notch
“The Method of Tensile Triangles” is an optimal shape/profile that can be found in animate and inanimate objects. Wind trimmed tree or water smoothed stones are one of nature’s optimised design resulting from flow resistance. Erosion gradually smoothen compression bearing component or structures into its ideal shape, (e.g. cliff lines or earth pyramids) [42]. Mattheck study begins with studying how small changes in notches can make a big difference in the stress imposed on a structure. “The Method of Tensile Triangles” is a pure graphical method developed by Mattheck [6], [35], [43]
[image:5.595.52.285.437.512.2]Performance and Efficiency: A Review
both ease the analysis of computer optimization in mechanical structures (that often requires several hours or even days to optimize a component) and prevent/reduce component damage [6].
Figure 11: The difference of stress concentration along the notch contour between the engineer’s notch and the
tree’s notch.[6], [35], [43]
The effectiveness of the tree’s notch against the engineer’s notch is shown in Figure 11. By changing the notch’s geometry, the tree notch shows from low or no localised stresses when compared to the engineer’s notch [6], [35], [43]. Circular notches often give rise to sharp corners or edges that frequently lead to fatigue crack initiation and propagation resulting in failure from high-localised stresses. Through the evolution of biological shape optimization, shape profiles in nature have changed the current engineering methods and views on optimizing notches from a complex solution to a purely graphical method. The Method of Tensile Triangles also known as a universal notch shape has survived countless of merciless trials throughout its evolution but every design has its own limitation. Its limitations are still not completely known yet but variation of this method has been used and tested by Mattheck [6], [35]. Although not perfect, the implementation of this method in CAD systems or the design components, at the very least helps improves its fatigue and service life. Trees can be a examles to new optimization methods as they demonstrate engineers how adding and/or removing of elements according to its environmental loading conditions can reduce weight without the potential risk of failure [35].
F. Performance of notch profile (Grodzinski vs
Mattheck)
Notch profile found in nature does not have a constant radii. To identify its performance on the notch shape, it is systematically compared between the two popular graphical method proposed by Mattheck [6], [7], [35] and Grodzinski [44] as shown in Figure 12. The two proposed notch shapes are differed by its geometrical size along the 𝑥 and 𝑦
[image:6.595.308.547.56.365.2]direction [36], [37]. The notches are tested through finite element analysis under two different conditions as shown in Figure 13 and Figure 14, for flat bar (bending and torsion) and for cut out window steel plate (tension only). Peterson’s charts was used to verify the stress concentration factor values for the circular notch profile obtained through finite element method [36], [37].
Figure 12: Geometrical profiles of different notches [36], [37].
(a) (b)
Figure 13: Flat bar subjected to (a) pure tension (b) pure bending [36], [37].
Figure 14: Cut out window steel plate subjected to pure tension pulling [36], [37].
Mattheck’s notch profile is better than Grodzinski’s notch profile under tension but suffers under bending. The stress concentration of the three profiles are summarised in Table 1. Therefore, its ability to plausibility increase fatigue life should not be ignored [36], [37]. An increase in fatigue life will result in a more economical solution, lowering cost of repair/ replacement and downtime. Offshore structure (e.g. semisubmersible platforms and etc.) have numerous steel plate like element with an opening for reinforcing girders and other structural components. Therefore, a practical application example of a centre cut out steel plate as shown in Figure 14 was tested by Albuquerque et. al. [36], [37] under tension load to determine the concentration of stresses around the corners of the hole. Mattheck’s graphical method managed to reduce stress concentration by approximately 19% when compared to the circular fillet profile [36], [37]. However, the result indicates no optimum solution and it is more towards as an improved solution grounded on heuristic geometrical models [36], [37].
Table 1: Result summary of stress concentration for different notch profile [36], [37].
Fillet profile Stress Concentration Factor (SCF) Pure tension Pure bending
Circular 1.83 1.46
Mattheck 1.22 1.10
Grodzinski 1.26 1.07
G. Compassion of
Popular Notch
[image:6.595.53.285.110.208.2]A finite element analysis was conducted according to the American Standard for Testing and Material (ASTM) [45], [46] to quantify stress concentration and to identify the achievable improvement by optimizing the various notch radiuses for a common push-pull, rotatory bending and bending fatigue testing. Albuquerque et. al. [36], [39] found that the notch shape for Baud (SCF 1.14), Mattheck (SCF 1.24) and Grodzinski (SCF 1.29) have a greater efficiency at lowering stress concentration when compared to the circular notch shape (SCF 1.85) where the specimen is loaded by a centred tensile load. If the notch profile is correctly applied, they all can at the very least improve fatigue life through the lowered stress concentration factor (SCF) that evidently will also reduce the overall costing [36], [39]. ALTRAN also conducted a similar analysis study on the comparison of notch stresses with different popular notch profiles [47]. The notches were analysed only in tension and under 2D plane stress condition to simulate the worst case loading condition to determine the best notch design [47]. Six different notch shapes/profiles were analysed, One radius fillet, Two radii fillet, Baud fillet, Method of Tensile Triangles, Standard elliptical fillet and Conical round “generalized elliptical fillet”. The stress concentration experienced by each notch profile are summarised in
Table 2.
Table 2: Result summary of the different notch shapes in their optimum size and contour in relation to their stress
concentration [47].
Notch type No Stress
concentration Kt
One radius fillet 1 1.5257
1.0544
Two radii fillet 2 1.0042
Baud fillet 3 1.00046
Method of tensile triangles 4 ≈1.1
Standard elliptical fillet 5 1.00608
Conical round 6 1.00064
[image:7.595.76.258.648.733.2]Baud fillet was indeed the best among the other notch designs. The notch profile become very sensitive as the stress concentration 𝐾𝑡≈ 1. This shows how small changes in curvature can lead to higher stresses or lower stresses. Such tedious work in practice is difficult in the civil engineering world. Another study conducted by Komarla and H-B. Woyand [48] shows that a stress concentration of 1.02 in Mattheck’s design shape is obtainable.
Figure 15: A graphical comparison of different notch shape in relation to their overall size (Jakel and
Ciomber, 2014)[47].
All the best-optimized notch shapes were plotted into one figure to illustrate the notch sizes, except for “method of tensile triangles” which is not included in Figure 15. The numbering of notch shapes in Figure 15 are as follows:
1) One radius fillet (R*=0.5) 2) One radius fillet (R*=5) 3) Two radii fillet
4) Baud fillet
5) Standard elliptical fillet
6) Conical round “generalized elliptical fillet”
H. Applications and Success of using the “Method of
Tensile Triangles”
Engineers [49] managed to take advantage of Mattheck design in their Cat 6A Module 𝐶𝑎𝑡 6𝐴 𝑀𝑜𝑑𝑢𝑙𝑒 and were able to produce a hard, stable, resilient and torsion resistant product. Their product was neither over rigid nor over weak and it was the perfect size at a minimal cost [49]. Screw threads optimised with Mattheck’s “Method of Tensile Triangles” also helped in reducing stresses at its screw threads by 34%. This reduces failure on the screw threads [50].
IV. DISCUSSION
The review study shows how trees adapt in nature and provide mechanical strength through the change of its physical shape or design. The transitional shape profile was introduced into some mechanical problems to improve its fatigue lifespan without superfluous material. Hence, this approach may be introduced in civil engineering structures to enhance structural performance and efficiency in terms of carrying lateral loads from wind or earthquake.
REFERENCES
1 C. Mattheck and S. Burkhardt, “A new method of structural shape optimization based on biological growth,” Int. J. Fatigue, vol. 12, no. 3, pp. 185–190, 1990.
2 C. Mattheck, “Why They Grow, How They Grow: the Mechanics of Trees,” Arboric. J., vol. 14, no. 1, pp. 1– 17, 1990.
3 C. Mattheck, “Engineering components grow like trees,”
Materwiss. Werksttech., vol. 21, no. 4, pp. 143–168, Apr.
1990.
4 C. Mattheck, Design in Nature, vol. 19, no. 2. 1998. 5 A. R. Ennos, “The function and formation of buttresses,”
Trends Ecol. Evol., vol. 8, no. 10, pp. 350–351, Oct.
1993.
6 C. Mattheck, R. Kappel, and A. Sauer, “Shape optimization the easy way: The ‘method of tensile triangles,’” Int. J. Des. Nat., vol. 2, no. 4, pp. 301–309, Jun. 2007.
7 C. Mattheck, Secret Design Rules of Nature (Optimum
Shapes without computers). Forschungszentrum
Karlsruhe, 2007.
8 C. Mattheck and G. Korseska, “WOUND HEALING IN A PLANE ( PLATANUS ACERIFOLIA (AIT.) WILLD.) AN EXPERIMENTAL PROOF OF ITS MECHANICAL STIMULATION,” Arboric. J., vol. 13, no. 3, pp. 211– 218, Aug. 1989.
Performance and Efficiency: A Review
structure under in-plane load,” Comput. Struct., vol. 191, pp. 115–128, Oct. 2017.
10 O. Amir, “A topology optimization procedure for reinforced concrete structures,” Comput. Struct., vol. 114–115, pp. 46–58, Jan. 2013.
11 Y. Luo, M. Y. Wang, M. Zhou, and Z. Deng, “Topology optimization of reinforced concrete structures considering control of shrinkage and strength failure,”
Comput. Struct., vol. 157, pp. 31–41, Sep. 2015.
12 B. S. Institution, “Code of practice for design and construction,” 2016. [Online]. Available: http://shop.bsigroup.com/. [Accessed: 18-Jul-2016]. 13 E. Comission, “Eurocodes: Building the future - The
European Commission website on the Eurocodes,” 2016. [Online]. Available: http://eurocodes.jrc.ec.europa.eu/. [Accessed: 18-Jul-2016].
14 F. M. Burdekin, “General principles of the use of safety factors in design and assessment,” Eng. Fail. Anal., vol. 14, no. 3, pp. 420–433, Apr. 2007.
15 C. Mattheck, Trees: The Mechanical Design. New York, 1991.
16 R. Graham, “Assessment of hazardous trees,” New Zeal.
Gard. J., vol. 10, no. 1, pp. 2–5, 2007.
17 C. Mattheck, K. Bethge, and J. Schäfer, “Safety factors in trees,” J. Theor. Biol., vol. 165, no. 2, pp. 185–189, 1993.
18 W. Richter, “A Structural Approach to the Function of Buttresses of Quararibea Asterolepis,” Ecol. Soc. Am., vol. 65, no. 5, pp. 1429–1435, Oct. 1984.
19 C. a. Chapman, L. Kaufman, and L. J. Chapman, “Buttress formation and directional stress experienced during critical phases of tree development,” J. Trop.
Ecol., vol. 14, no. 3, pp. 341–349, 1998.
20 P. W. Richards, The tropical rain forest. An ecological
study. Cambridge University Press, 1952.
21 A. E. Navez, “on the Distribution of Tabular Roots in Ceiba (Bombacaceae),” Proc. Natl. Acad. Sci. U. S. A., vol. 16, no. 5, pp. 339–344, May 1930.
22 T. P. Young and V. Perkocha, “Treefalls, crown asymmetry, and buttresses,” Journal of Ecology, vol. 82, no. 2. pp. 319–324, 1994.
23 P. W. Richards, R. P. D. Walsh, I. C. Baillie, and P. Grieg-Smith, The tropical rain forest: an ecological
study, vol. 2nd. 1996.
24 D. M. Newbery, S. Schwan, G. B. Chuyong, and X. M. Van Der Burgt, “Buttress form of the central African rain forest tree Microberlinia bisulcata, and its possible role in nutrient acquisition,” Trees - Struct. Funct., vol. 23, no. 2, pp. 219–234, 2009.
25 M. J. Crook, a R. Ennos, and J. R. Banks, “The function of buttress roots: a comparative study of the anchorage systems of buttressed (Aglaia and Nephelium ramboutan species) and non-buttressed (Mallotus wrayi) tropical trees,” J. Exp. Bot., vol. 48, no. 314, pp. 1703–1716, 1997.
26 M. Abu Hanifa Mehedi, C. Kundu, and M. Qumruzzaman Chowdhury, “Patterns of tree buttressing at Lawachara National Park, Bangladesh,” J. For. Res., vol. 23, no. 3, pp. 461–466, 2012.
27 A. R. Lewis, “Buttress Arrangement in Pterocarpus officinalis (Fabaceae): Effects of Crown Asymmetry and Wind,” Biotropica, vol. 20, no. 4, p. 280, Dec. 1988. 28 S. D. Warren, H. L. Black, D. A. Eastmond, and W. H.
Whaley, “Structural Function of Buttresses of Tachigalia Versicolor,” Ecology, vol. 69, no. 2, pp. 532–536, Apr. 1988.
29 H. G. Baker, “BIOTROPICA 5,” Biotropica, vol. 5, no. 2, pp. 89–93, 1973.
30 J. E. Gordon, Structures, or Why Things
Don{\textquoteright}t Fall Down. Boston, MA: Springer
US, 1978.
31 M. P. Coutts, “Root architecture and tree stability,” Plant Soil, vol. 71, no. 1–3, pp. 171–188, 1983.
32 M. P. Coutts, “Components of tree stability in sitka spruce on peaty gley soil,” Forestry, vol. 59, no. 2, pp. 173–197, 1986.
33 S. Wahala, S. Huang, and L. anak Dibor, “Buttress variation between trees growing on flat and inclined terrain,” Proc. CTFS-AA Int. F. Biol. Course 2005, no. July, pp. 49–52, 2005.
34 D. Woodcock, G. Dos Santos, and D. Taylor, “The Buttressed Blue Marble Tree: Wood and Growth Characteristics of Elaeocarpus angustifolius (Elaeocarpaceae),” Ann. Bot., vol. 85, no. 1, pp. 1–6, 2000.
35 C. Mattheck, “Teacher tree: The evolution of notch shape optimization from complex to simple,” Eng. Fract.
Mech., vol. 73, no. 12, pp. 1732–1742, 2006.
36 J. T. P. de Castro, D. de Albuquerque Simões, I. F. M. de Menezes, M. A. Meggiolaro, and L. F. Martha, “A note on notch shape optimization to minimize stress concentration effects,” Theor. Appl. Fract. Mech., Mar. 2016.
37 D. de Albuquerque Simões, J. T. P. de Castro, and M. A. Meggiolaro, “On the improved notch shape,” in 21st
Brazilian Congress of Mechanical Engineering, 2011.
38 C. Mattheck, The Face of Failure in Nature and
Engineering. Forschungszentrum Karlsruhe, 2004.
39 D. de Albuquerque Simões, J. T. P. de Castro, and M. A. Meggiolaro, “Improved Fatigue Test Specimens With Minimum,” in 67th ABM International Congress, 2012, pp. 1911–1923.
40 C. Mattheck and S. Reuss, “The claw of the tiger: An assessment of its mechanical shape optimization,” J.
Theor. Biol., vol. 150, no. 3, pp. 323–328, 1991.
41 D. W. Thompson, On Growth and Form. Cambridge: Cambridge University Press, 1942.
42 Refractories World Forum (ed.), “Thinking Tools Modelled on Nature,” 2011.
43 C.A. Brebbia, Design and Nature III: Comparing Design
in Nature with Science and Engineering, vol. 1. WIT
Press, 2006.
44 W. D. Pilkey, Deborah F. Pilkey, D. F. Pilkey, and Deborah F. Pilkey, Peterson’s Stress Concentration
Factors. John Wiley & Sons, 2007.
45 ASTM, “ASTM E606/E606M - 12: Standard Test Method for Strain-Controlled Fatigue Testing,” ASTM
Standards, 2012. [Online]. Available:
http://www.astm.org/cgi-bin/resolver.cgi?E606E606M. [Accessed: 16-Jul-2016].
46 ASTM, “Standard Practice for Strain-Controlled Axial-Torsional Fatigue Testing with Thin- Walled Tubular Specimens 1,” ASTM Standards, 2015. [Online]. Available: http://www.astm.org/cgi-bin/resolver.cgi?E2207. [Accessed: 16-Jul-2016]. 47 I. Ciomber and R. Jakel, “Systematic Analysis and
Comparison of Stress Minimizing Notch Shapes: Obtaining a stress concentration factor of Kt=1 without FEM-Code,” 2014. [Online]. Available: http://nbn-resolving.de/urn:nbn:de:bsz:ch1-qucosa-140513. [Accessed: 16-Jul-2016].
48 N. Komarla, “Optimization of Shoulder Fillet Specimen Using Catia V5,” 2011.
49 R. Eichenberger, E. Monti, A. Kiser, R. Burkert, and B. Damm, “Connection 41,” Reichle & De-Massari AG, Switzerland, p. 48, Sep-2011.
![Figure 2: An illustration on how trees without buttresses fail. [25]](https://thumb-us.123doks.com/thumbv2/123dok_us/8209510.262870/3.595.56.280.150.451/figure-illustration-trees-buttresses-fail.webp)
![Figure 7: Specimens plotted using finite element modelling for different notch sizing [36], [39]](https://thumb-us.123doks.com/thumbv2/123dok_us/8209510.262870/5.595.52.285.437.512/figure-specimens-plotted-finite-element-modelling-different-sizing.webp)
![Figure 13: Flat bar subjected to (a) pure tension (b) pure bending [36], [37].](https://thumb-us.123doks.com/thumbv2/123dok_us/8209510.262870/6.595.308.547.56.365/figure-flat-bar-subjected-pure-tension-pure-bending.webp)
![Figure 15: A graphical comparison of different notch shape in relation to their overall size (Jakel and Ciomber, 2014)[47]](https://thumb-us.123doks.com/thumbv2/123dok_us/8209510.262870/7.595.76.258.648.733/figure-graphical-comparison-different-relation-overall-jakel-ciomber.webp)
