Automatic Detection of Tomato Leaf Deficiency
and its Result of Disease Occurrence through Image
Processing
S. Sivagami, S. Mohanapriya
Abstract: Economic strength of a country is highly depends on agriculture productivity. More number of researches has been done based on detecting disease of plant by processing its leaf. However detecting disease after occurrence of it and identifying solution and source of it presence is a delay and useless process. The occurrence of disease in plants is due to absence of nutrient content in it. The main objective of this research work is to effectively detect deficiency in tomato leaf in order to protect it from disease occurrence. In our work, identification of deficiency in tomato leaf has been implemented using image processing technique. A plant grows in healthy way when it has its basic nutrients such as Nitrogen, phosphorus, potassium etc. Analyzing and detecting tomato plant leaf deficiency will identify occurrence of disease later. To detect deficiency in accurate way expectation and maximization segmentation process is implemented and features of segmented images have been extracted. Based on this extracted features classification is implemented to identify whether it is normal leaf or defected leaf. After identifying result the disease occurrence due to nutrient deficiency is shown. Therefore based on leaf image processing disease is identified by analyzing its deficiency in efficient way. Hence our research work prevents loss in tomato production and increases its growth and sales.
Keywords: deficiency detection, segmentation, features extraction, classification and disease prediction.
I. INTRODUCTION
In current developing world technologies are emerging day by day but still we are utilizing few ancient methods in agriculture. If a plant affected by any disease is identified by existing methodologies consumes more time, work and cost. In addition identification of plant disease wrongly will leads to huge loss of time, money, work, yield and product quality. Therefore for gainful cultivation the condition of plant should be detected accurately.
In general this kind of disease is identified through experienced people but due to environment changes the manual prediction becomes too difficult. By utilizing technology development we can use image processing for detection of plant disease by analyzing its deficiency. Generally we can observe the symptoms of disease on leafs, stems, flowers etc. so here we use leafs for identification of disease affected plants. In general, a plant should need 12 mineral nutrients such as, Nitrogen, Phosphorus, Potassium, Sulfur, Magnesium, Manganese, Molybdenum, Zinc, Boron, Calcium, Copper and Iron.
Revised Manuscript Received on September 07, 2019
S. Sivagami, Assistant Professor, Department of Information Technology, Adhiyamaan College of Agriculture and Research, Hosur, Tamilnadu.
Dr. S. Mohanapriya, Head of the Department, Department of Computer Science, KSR College of Arts and Science for Women, Tiruchengode, Tamilnadu.
These mineral nutrients are classified into micro and macro nutrients. To grow a plant need minimum quantity of micro nutrients and maximum quantity of macro nutrients. Micronutrients include Boron, Copper, Iron, Chloride, Manganese, Molybdenum and Zinc. Macronutrients include Nitrogen, Potassium, Sulfur, Calcium, Magnesium and Phosphorous.
From soil these nutrients are needed for growth of plants. If any deficiency of these nutrients will affects the growth of plant/crop. Therefore analyzing nutrients status will play crucial role in agriculture and farming. The absence of nutrients in plants will reflect in its leaf. These symptoms include interveinal chlorosis, marginal chlorosis, uniform chlorosis, necrosis, distorted edges, reduction in size of the leaf etc. One critical issue in identifying deficiency is similar symptoms present in old and younger leaf does not have same nutrient deficiency.
1.1 Components of Nutrient Deficiency Diagnostic System
The diagnostic system would include the following components using image processing techniques:
Leaf area measurement
Segmentation of edge and veins of the leaf Determining the Shape of the leaf
Classification of the deficient mineral Extraction of color features of the leaf
Precautions in identifying nutrient stress symptoms include the following:
1. Many symptoms appear similar.
2. Multiple deficiencies and/or toxicities can occur at the same time.
3. Crop species, and even some cultivars of the same species, differ in their ability to adapt to nutrient deficiencies and toxicities.
4. Pseudo (false) deficiency symptoms (visual symptoms appearing similar to nutrient deficiency symptoms). 5. Hidden hunger.
6. Field symptoms appear different than „ideal‟ symptoms.
Objective of this work:
To identify deficiency of tomato plant by analyzing its leaf efficiently.
By identifying deficiency of tomato leaf, we can obtain healthy products (tomatos).
II. LITERATURE SURVEY
Jayamala K. Patil and Raj Kumar (2011) presents parameters like downpour, temperature; infections on harvest is central point which influences generation quality and amount of harvest yield. Thus sickness the board is key issue in farming. For the board of ailment, it should be distinguished at beginning time in order to treat it appropriately and control spread of the infection. On account of advances in the innovations now a day it is conceivable to utilize the pictures of sick leaf to identify the sort of sickness. This can be accomplished by separating highlights from the pictures which can be further utilized with arrangement calculations or substance based picture recovery frameworks. In this paper Color of the picture is utilized to extricate the highlights of pictures by figuring the first, second and third snapshot of Shading. Tomato leaves are utilized for experimentation.
Ashish Miyatra et.al (2013) describes detection of disease and nutrient deficiency in cotton plant. It is most significant fiber crop which assumes significant job in financial and parties of individuals, particularly in India, however in the event that ailment like Alternaria Leaf Spot and lack of some real supplements goes undetected in beginning period then it can lessen as much as 25% of all out generation. In this paper, Various techniques and calculation has been talked about and analyzed for the recognition of above. Since a large number of years, ranchers have been distinguishing these deformities in cotton. Number of techniques has been proposed by different analysts which change generally in innovation. Prior visual side effects were the primary hotspot for deformity recognition in each plant, however then analysts have accompanied advances like Image Processing, Optical Sensor, and Spectroscopic Determination and so on.
J. Keerthi et.al (2019) presents tomato leaf disease prediction using SVM classifier. Disease of plants are regularly observed on the leaves of the plant. Exact Identification of the malady by outwardly watching them is troublesome due to the multifaceted nature of the examples on the leaf. So the interest for distinguishing the infections utilizing PCs has brought more up as of late. This work utilizes an AI procedure to recognize the maladies of a tomato plant and recommend suitable control measures to deal with the sickness. The framework is structured utilizing python programming modified into raspberry pi modules. After the picture is transferred for the malady recognizable proof, pictures are pre-handled utilizing histogram adjustment, separating, shading change and division then the pictures are taken to the order utilizing SVM classifier and the suitable ailment distinguished is shown on the screen alongside the relating control measures to be taken.
Sagar Vetal and R.S. Khule (2017), discusses tomato leaf disease prediction using image processing. Because of which area of ailment on tomato plant winds up significant in light of the fact that less powerlessness. The plants efficiency gets influenced if legitimate consideration isn't taken. Picture preparing is one of childhood innovation which is settling such issues with different calculations and systems. The majority of the maladies of tomato plant distinguished at beginning stages as they influences leaves first. By recognizing the ailments at introductory stage on leaves will without a doubt abstain from approaching misfortune. In this paper four key maladies are distinguished
utilizing picture division and Multi-class SVM calculation. For separating of harmed zone on leaves picture division is utilized and for grouping of exact malady Multi-class SVM calculation is utilized. In last stage manifestations and treatment to distinguished infections prescribed client.
H. Sabrol and S. Kumar (2016), presents tomato leaf disease detection based on Digital Images using Classification Tree. These applications are valuable for opportune acknowledgment of plant illness. The malady like parasitic, bacterial and infection are the ruinous illness for any plant. In the examination, five kinds of tomato infections for example tomato late curse, Septoria spot, bacterial spot, bacterial infection, tomato leaf twist furthermore, sound tomato plant leaf and stem pictures are characterized. The order directed by extricating shading, shape and surface highlights from solid and undesirable tomato plant picture. The element extraction procedure is done after the division procedure. Separated highlights from divided pictures encouraged to characterization tree. At long last, the infection characterization depended on these six various kinds of classes.
Guili Xu et.al (2011) describes nitrogen and potassium deficiency in tomatoes using leaf color images. Soilless culture has been well known in present day agribusiness. Nonetheless, plants in soilless culture regularly show up to be supplement insufficient. In this manner the intellective analytic arrangement of plants sickness of supplements inadequacy is significant. In this paper, an original thought dependent on PC vision is exhibited. Shading and surface highlights of leaves are removed by certain strategies, for example, percent power histogram, percent differential histogram, Fourier change, and wavelet bundle. In addition, Genetic Algorithm (GA) has been utilized to choose highlights to get the best data for diagnosing the ailment.
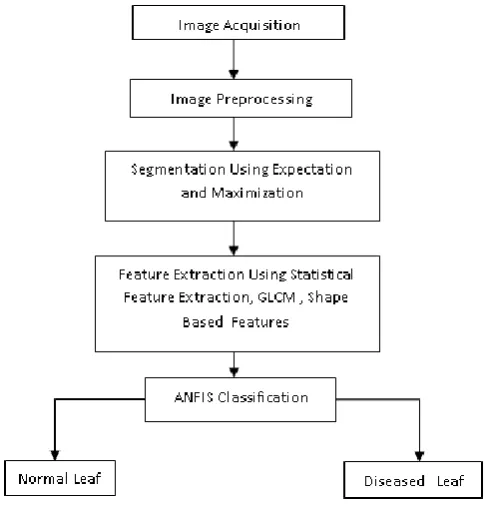
III. PROPOSED SYSTEM
In proposed system, the images of tomato leafs are collected for our implementation work. The images may be normal and healthy, deficiency affected and disease affected. We are going to detect whether the leaf is affected by any deficiency. The result of deficiency leads to disease occurrence in plants and it affect the yield. Therefore efficient identification of deficiency will reduces disease occurrence in plants.
Image Acquisition:
Figure 1: Proposed system architecture Image Preprocessing:
The input images may be in various size, different color combination and it contains noise are removed in this preprocessing section. These parameters should be converted according to our requirement process. Image noise is most apparent in image regions with low signal level such as shadow regions or under exposed images. There are different types of noise are available in images such as film grains, salt and pepper noise etc., In general all these noises are eradicated by implementing filtering algorithms and more number of filters are available. For our proposed work Weiner filter is used. In this module image considered as input will be preprocessed for exact needed output. For all the images we are processing are preprocessed so that they obtained result will be in better way. To improve the quality and accuracy of image it should be preprocessed and it reflects in its transformation between the images.
By using these filtering techniques the noise removal function is done for improving the efficiency of the process. The result obtained from preprocessing is image enhancements that suppresses unwanted data in image or enrich the some features that needed for further processing.
For the calculation of new pixel brightness according to the size of pixel neighborhood four categories of image preprocessing methods are implemented they are: 1) Pixel brightness transformations
2) Geometric transformations
3) Pre-processing methods that use a local neighborhood of the processed pixel,
4) Image restoration that requires knowledge about the entire image
The nature of a priori information is required if preprocessing aims to clear few degradation in the images.
1. Knowledge about the nature of the degradation; only very general properties of the degradation are assumed,
2. Knowledge about the properties of the image acquisition device, the nature of noise (usually its spectral characteristics) is sometimes known,
3. Knowledge about objects that are searched for in the image, which may simplify the pre-processing very considerably. If knowledge about objects is not available in advance it can be estimated during the processing.
Expectation maximization:
In the presence of missing or hidden data the EM algorithm is utilized to calculate the maximum likelihood (ML) in efficient way through its iterative procedure. In ML estimation, we wish to estimate the model parameter(s) for which the observed data are the most likely. The EM algorithm works in iteration method here each iteration consists of two processes. Initially, E-step and then M-step is implemented. In the expectation, or E-step, the missing data are estimated given the observed data and current estimate of the model parameters. Based on the conditional expectation this function is achieved explaining the choice of terminology. In the M-step, based on the assumption that missing data are known the likelihood function has been expanded. Hence it concludes that the algorithm ensures it will increase the likelihood of data in every iteration.
Feature extraction Statistical features:
Statistics is generally referred to be survey of data in this work collection of data, organizing, analyzing and interpretation of data is considered as it. The initial stage planning of data is also included in statistics as the design and experiment surveys. Here the statistical features of an image consist of
Mean
Variance
Skewness
Standard deviation
GLCM:
Gray-Level Co-Occurrence Matrix (GLCM) is used for texture analysis of image. It is described to be a statistical method of understanding the texture which includes the spatial relationship of pixels and it also represented as gray level spatial dependence matrix.
For statistical value during the evaluation of joint probability distribution the matrix should include a meaningful large average occupancy level. It is obtained by
(a) Confining the quantity of amplitude quantization levels (causes loss of exactness for low-amplitude texture),
(b) Utilizing enormous estimation window, (Causes mistakes if texture changes over the enormous window). Regular trade off: 16 gray levels and window size of 30 or 50 pixels on each side. Presently we can dissect
• Component distinction moment of order k: Ʃi Ʃj(i
− j)kc
ij. This descriptor has moderately low values when the
high estimations of C are close to the main diagonal. For this position operator, high qualities close to the main diagonal would demonstrate that groups of steady power running "1 pixel to one side and 1 down" are likely. At the point when k = 2, it is known as the differentiation:
• Contrast = Ʃi Ʃj (i − j)2 cij
• Entropy = − Ʃi Ʃj cij log cij This is a proportion of
irregularity, having its highest value when the components of C are generally equivalent.
• Uniformity (also called Energy) = Ʃi Ʃj c2ij
(smallest value when all entries are equal)
• Homogeneity = Ʃi Ʃj cij / 1+|i−j| (large if big
values are on the main diagonal)
The gray level co-event grid can uncover certain properties about the spatial appropriation of the gray levels in the texture picture. For instance, if the greater part of the entries in the GLCM is thought along the diagonal, the texture is coarse with respect to the specified offset.
Geometrical features:
To solve visual tasks, a technique represented as geometric feature learning is used which a combination of machine is learning and computer vision. By gathering geometric features from images and analyzing those using efficient machine learning methods to identify a set of representative features of geometric form is its main goal.
Classification: ANFIS:
[image:4.595.314.530.339.467.2]ANFIS is modified network based fuzzy inference is described to be the combination of soft computing methods like ANN and fuzzy logic. Changing the qualitative aspects of human knowledge and utilizes it to process quantitative analysis is done by fuzzy logic. However, it does not have a defined method that can be used as a guide in the process of transformation and human thought into rule base fuzzy inference system (FIS), and it also takes quite a long time to adjust the membership functions (MFs). To adapt according to the environment our proposed method has higher capability in learning process when compared to ANN. Therefore, while determining fuzzy logic rules ANN is used to adjust MFs value automatically and minimizes the error rates.
Figure 2: adaptive network
Adaptive network is one example of feed forward neural network with multiple layers. In the learning procedure, these systems frequently utilize regulated learning calculation. Likewise, versatile system has the engineering qualities that comprises of various versatile hubs interconnected straightforwardly with no weight an incentive between them. Every hub in this system has various capacities and undertakings, and the yield relies upon the approaching sign and parameters that are accessible in the hub. A learning decide that was utilized can influence the parameters in the hub and it can diminish the event of blunders at the yield of the versatile system.
IV. RESULT AND DISCUSSION
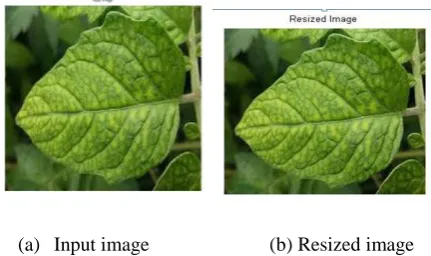
In this section, the result of our proposed system is discussed. Here we collected tomato leafs affected by various deficiency and our results extracts the outcome of this deficiency. In general 12 nutrient deficiency will present in the tomato leafs. The implementation steps are shown clearly as step by step process. Initially tomato leaf is taken into consideration as input image.
(a) Input image (b) Resized image
Inputted image is taken as input and undergoes for further processing. Initially the image will be resized according to our required format by modifying entropy, contrast, homogenous and energy. Once image is resized, noise should be removed from it the presence of noise is shown in figure c and d.
(c) Noisy image (d) salt and pepper
(e) Noise removed image (f) Gray scale image
From the image the required part alone segmented and converted into gray scale is shown in figure f. Most likely hood values are calculated with respect to that values image has been segmented.
(g) Contrast enhanced image (h) Affected part
Contrast is enhanced through expectation and maximization process. The affected part from the image has been extracted finally. This is utilized for classification purpose and efficiently detect that based on which deficiency the leaf has been getting affected and its effects are also extracted and shown in figure i and j.
(i) Deficiency detection
(j) Result of this deficiency
With respect to this images of tomato leafs are taken and processed. Based on this analysis various nutrient deficiency are detected and its effects on leaf are also extracted and it is shown below.
Input image Noise removed image Affected part Deficiency Disease
Normal leaf No disease
Boron deficiency
General chlorosis
disease
Calcium deficiency
Copper deficiency
Chlorosis disease
Zinc deficiency Intervenial necrosis
Manganese deficiency
Dark necrotic
disease
Magnesium deficiency
Mottled chlorotic
disease
Molybdenum deficiency
Reddish coloration
Nitrogen deficiency
Phosphorus deficiency
Necrotic spots
Potassium deficiency
[image:7.595.60.542.49.220.2]Marginal necrosis disease
Figure 3: various tomato leaf deficiency detection and disease prediction
Deficiency Mean Standard
deviation
Variance Skewness Kurtosis
Boron 3.391 2.593 5.616 4.341 4.048
calcium 3.133 3.817 1.007 1.917 1.777
Copper 3.452 3.482 9.402 3.382 6.747
Iron 3.093 4.623 1.457 1.210 1.100
Manganese 3.089 4.417 1.376 9.634 3.829
Magnesium 0.480 0.062 0.002 0.247 5.491
Molybdenum 2.769 7.330 2.991 1.572 1.227
Nitrogen 2.631 4.607 1.280 2.573 4.171
Phosphorus 3.312 3.373 9.122 2.751 6.389
Potassium 2.094 9.977 4.944 6.126 7.927
[image:7.595.39.528.247.405.2]Zinc 2.845 4.272 1.329 4.399 4.188
Table 1: various deficiencies and its values of different parameter
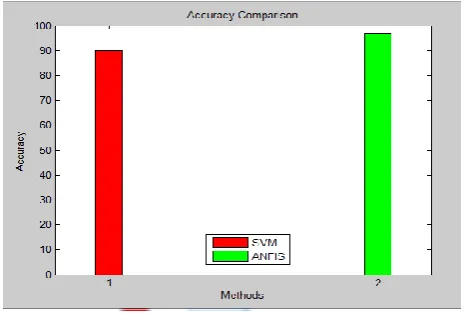
Figure 4: comparison graph
The above figure clearly shows that our proposed method attains maximum accuracy compared to existing method. Similarly table 1 shows values of various parameters of different deficiency.
V. CONCLUSION
The detection of tomato leaf deficiency is implemented in automated way. Noise removal from image has been implemented through preprocessing. Once noise was removed segmentation process was done through EM segmentation. Based on segmented image feature of particular image is extracted which includes Statistical Feature Extraction, GLCM and Shape based features. With
respect to extracted features leaf was classified in accurate way by ANFIS classification. In this work, leaf deficiency alone not detected in addition the effect of deficiency that results in occurrence of disease on leaf also predicted accurately.
REFERENCES
1. Jayamala K. Patil and Raj Kumar, “Color Feature Extraction of Tomato Leaf Diseases” International Journal of Engineering Trends and Technology- Volume2Issue2- 2011.
2. Ashish Miyatra and Dulari Bosamiya, “A Survey on Disease and Nutrient Deficiency Detection in Cotton Plant” International Journal on Recent and Innovation Trends in Computing and Communication Volume: 1 Issue: 11.
3. J. Keerthi, Suman Maloji, P. Gopi Krishna, “An Approach of Tomato Leaf Disease Detection Based on SVM Classifier” International Journal of Recent Technology and Engineering (IJRTE) Volume-7, Issue-6, March 2019.
4. Sagar Vetal, R.S. Khule “Tomato Plant Disease Detection using Image Processing” International Journal of Advanced Research in Computer and Communication Engineering Vol. 6, Issue 6, June 2017.
5. H. Sabrol and S. Kumar, “Tomato Plant Disease Classification in Digital Images using Classification Tree” International Conference on Communication and Signal Processing, April 6-8, 2016.
6. Guili Xu, Fengling Zhang, Syed Ghafoor Shah, Yongqiang Ye, Hanping Mao, “Use of leaf color images to identify nitrogen and potassium deficient tomatoes” Contents lists available at Science Direct Pattern Recognition Letters (2011).
[image:7.595.55.288.434.593.2]8. Bhong, Vijay S and Pawar B.V, Study and Analysis of Cotton Leaf Disease Detection Using Image Processing, International Journal of Advanced Research in Science, Engineering and Technology, 3 (2), 2016.
9. Lumb, Manisha, and Poonam Sethi, Texture Feature Extraction of RGB, HSV, YIQ and Dithered Images using GLCM, Wavelet Decomposition Techniques, International Journal of Computer Applications, 68 (11), 2013.
10. Reena Tijare, Pawan Khade, Rashmi Jain, The Survey of Disease Identification of Cotton Leaf, International Journal of Innovative Research in Computer and Communication Engineering, 2015.
AUTHORS DETAIL
S.Sivagami, working as an Assistant Professor, department of Computer science, Adhiyamaan College of Agriculture and Research. She is doing Ph.D in Periyar University Salem and her area of interest is Image Processing.