City, University of London Institutional Repository
Citation
: Fekete, J., Hemery, P., Baudel, T. and Wood, J. (2011). Obvious: a meta-toolkit
to encapsulate information visualization toolkits. One toolkit to bind them all. Paper
presented at the IEEE Conference on Visual Analytics Science and Technology, 23 - 28 Oct
2011, Providence, Rhode Island, USA.
This is the unspecified version of the paper.
This version of the publication may differ from the final published
version.
Permanent repository link:
http://openaccess.city.ac.uk/534/
Link to published version
:
Copyright and reuse:
City Research Online aims to make research
outputs of City, University of London available to a wider audience.
Copyright and Moral Rights remain with the author(s) and/or copyright
holders. URLs from City Research Online may be freely distributed and
linked to.
Obvious: A Meta-Toolkit to Encapsulate Information Visualization Toolkits
— One Toolkit to Bind Them All
Jean-Daniel Fekete∗
INRIA
Pierre-Luc H´emery† INRIA
Thomas Baudel‡ IBM
Jo Wood§ City University, London
ABSTRACT
This article describes “Obvious”: a meta-toolkit that abstracts and encapsulates information visualization toolkits implemented in the Java language. It intends to unify their use and postpone the choice of which concrete toolkit(s) to use later-on in the development of visual analytics applications. We also report on the lessons we have learned when wrapping popular toolkits with Obvious, namely Prefuse, the InfoVis Toolkit, partly Improvise, JUNG and other data management libraries. We show several examples on the uses of Obvious, how the different toolkits can be combined, for instance sharing their data models. We also show how Weka and Rapid-Miner, two popular machine-learning toolkits, have been wrapped with Obvious and can be used directly with all the other wrapped toolkits.
We expect Obvious to start a co-evolution process: Obvious is meant to evolve when more components of Information Visualiza-tion systems will become consensual. It is also designed to help information visualization systems adhere to the best practices to provide a higher level of interoperability and leverage the domain of visual analytics.
Index Terms: K.6.1 [Management of Computing and Information Systems]: Project and People Management—Life Cycle; K.7.m [The Computing Profession]: Miscellaneous—Ethics
1 INTRODUCTION
Over the past few years, several information visualization (Info-Vis) toolkits have flourished in various languages such as Java [3,
16, 25, 33, 41], C++ [1, 15], Flash/Flex [20, 23] or JavaScrip-t/HTML5 [7,11] to name a few. When starting a visual analytics (VA) project, the choice of the toolkit is a major initial decision and the resulting proliferation of toolkits can be confusing for VA soft-ware developers who know that an inappropriate choice can lead to unanticipated limitations during the development of the application. Historically, this proliferation of toolkits can be explained by several factors: each created toolkit addresses a specific set of problems, is designed with a specific application domain in mind, or simply offers different tradeoffs. However, it results in disper-sion in terms of capabilities since each toolkit has unique and use-ful techniques for visualization and interaction. For example, the Prefuse [25] and JUNG [33] toolkits offer several graph layout al-gorithms whereas Improvise [41] supports very sophisticated coor-dinated views with limited graph capabilities.
The choice of an InfoVis toolkit should be made early in the software development process because it affects not only the visu-alization techniques but also the data structure to work with. For an application dealing with small quantities of data, copying data
∗e-mail:[email protected]
†e-mail:[email protected] ‡e-mail:[email protected] §e-mail:[email protected]
from one structure to another is possible in interactive time but not for VA applications that usually manage data sets too large to be duplicated at all. Therefore, most data-management and analysis will be made on data structures compatible with the visualization and tied to the visualization toolkit.
Once the choice is made, any missing components have to be added specifically to the toolkit: if a special data manager is re-quired (e.g., reading a particular data format), it has to be imple-mented specifically for the data structure managed by the toolkit. Any analysis not supported by the toolkit requires the authoring or adaptation of analytical toolkit components. Likewise, if visualiza-tion techniques are required that are not supported by the chosen toolkit they must be added, creating a strong dependency that usu-ally prevents changes of toolkit later-on in the development.
The effort required by one application to implement the missing components cannot easily be reused in other applications that are based on another toolkit. Therefore, important resources are wasted for the re-implementation of data converters, analysis modules, and visualization techniques.
To address this proliferation problem, this article introduces Ob-vious: a meta-toolkit that abstracts and encapsulates InfoVis toolk-its implemented in the Java language as a way to unify their use and postpone the choice of which concrete toolkit(s) to use later-on in the development process. Obvious is mainly targeted at VA soft-ware developers, but also library or toolkits developers if they want to promote sharing of data managers, converters, or algorithms not restricted to one toolkit.
This article presents three contributions:
1. it describes the design and implementations of Obvious, 2. it reports some lessons learned when wrapping existing
toolk-its with Obvious, and
3. it presents rationales for the social process we started and want to follow for the future of Obvious.
The main benefits offered by Obvious are:
1. it improves the reusability of code and components;
2. it improves the interoperability of code, data models and vi-sualizations;
3. it defers the choice of which concrete toolkits to use to a later stage of the VA development;
4. it enforces a better separation of concerns in VA applications so that the data models can be specified independently of the visualizations and views;
5. it allows toolkit and library developers to easily integrate their tool into the rich environment of Obvious-compatible sys-tems;
6. it clarifies issues with notification and allows VA to scale up using a standard architecture; and
7. it specifies a set of interfaces and a stable vocabulary which simplifies learning.
Figure 1: The Information Visualization Reference Model [24]
2 RELATEDWORK
Obvious is a set of interfaces and extension classes for wrapping around existing InfoVis toolkits. It generalizes and extends the stan-dard architecture as defined in the InfoVis reference model to try to abstract all the existing implementations. In this section, we list some major existing toolkits and explain what they share and how they differ. In the second section, we describe the most common standardization processes for software systems.
2.1 Visualization Toolkits
Pretty much all existing InfoVis toolkits follow the InfoVis ref-erence model initially specified by Ed Chi and refined by Card, Mackinlay and Shneiderman [12,13] and has been described as a design pattern in [24]. The model defines three stages: DataSetor
Data Tables,VisualizationorVisual Structure, andView(Figure1). One of its main benefits is that it explicitly represents interaction, in contrast to older visualization: models. Several articles have de-scribed the concrete design of an InfoVis toolkit. We report here on the common and the specific parts.
The InfoVis Toolkit (IVTK) [16] implements an in-memory database managerwhere data is organized in columns, contrary to most persistent relational databases, to improve the memory foot-print, to allow addition of new attributes that are needed to manage the interaction (e.g., selection or filtering), and to hold attributes computed on demand; the main challenge being the support of in-teractive performance for rendering and dynamic queries with a small memory footprint. The visual structure is managed using a
monolithicarchitecture [6]: each visualization technique is imple-mented as a specific class (e.g., ScatterPlotVisualization, Parallel-CoordinatesVisualization, or TreeVisualization) that performs the mapping between the data set and the graphic items to render. Fi-nally, the view component is the same for each of the visual struc-tures and takes care of scrolling, zooming, and overlaying magic lenses (e.g. Fisheye or Magic Lenses). Anotification mechanism
implements the communication between the data tables and the vi-sual structures: each time a data table is modified, it notifies all the registered handlers of the details of the modification. The in-teraction is managed byInteractorobjects that are associated with the visual structures; the views are generic and forward interaction managements to the Interactors. One specific feature provided by IVTK is layering: visualizations can be stacked on top of each oth-ers. Composite visualizations are useful to build complex visualiza-tions by breaking them into simple parts. For example, node-link diagrams are split into links managed as one layer and nodes as an-other. Magic lenses and Fisheyes are also managed as layers on top of other visualizations.
Prefuse [25] also relies on an in-memory database with notifi-cations but implements the visual structure using an extension of the data model (a visual table is derived from a data table). It then transforms the data into apolylithicgraphic structure whereas all the other toolkits use amonolithicarchitecture. In a polylithic ar-chitecture, there is only one component in charge of all the visual structures. A visualization object is responsible of managing a vi-sual structure: it contains vivi-sual tables that augment data tables with graphic attributes (shape, color, etc.). Visualizations are in charge
of computing the layout (assigning a position and shape to visual items), the graphic attributes, and animations. Visualizations use a
Rendererobject to actually display visual items. Users can control which renderer is used depending on the visualization, and the ob-ject itself. In Prefuse, data managers, visual managers and views are generic, offering a clean interface to the application programmer. However, as noted by Bederson et al. [6], polylithic toolkits have a steeper learning curve than monolithic ones because the polylithic components do not work out of the box, they always need to be configured. To address this issue, Prefuse comes with code samples that show how to do the initial setup.
Building upon their experience in the Prefuse toolkit [25], Heer and Agrawala [24] have derived software design patterns that are common to InfoVis applications, and toolkits.
Improvise [41] relies on an in-memory database with notification that is row-oriented and its visual structures are monolithic. The main characteristic of Improvise lies in its management of coordi-nated views. To achieve this aim, it relies on several design patterns not supported by Prefuse; compared to the other InfoVis toolkits, it adds a coordination component that is central and extends the notification mechanism implemented by IVTK or Prefuse.
Discovery [3,4,5] shares most of its characteristics with Prefuse: it uses an in-memory, column-oriented database and a polylithic graphic model. Its two main features are (1) the absence of a scene graph, replaced by a dataflow pipeline made of short operations calledfunctorsthat render directly from the data-model, and (2) a deferred notification strategy to allow data editing.
Other InfoVis toolkits can mostly be described using the four toolkits above, even if they use a different programming language. Tulip [1] is a graph-oriented toolkit programmed in C++ that uses data tables for vertices and edges, like IVTK and Prefuse. It imple-ments several complex graph layout algorithms and uses OpenGL for its rendering, but the conceptual architecture is table-based and monolithic. Therefore, InfoVis toolkits share a global organiza-tion: they all implement an in-memory database with two variants (row-based or column-based), a visual structure with two variants (monolithic or polylithic), and several specific features. Even if some choices made by toolkits designers were carefully decided, others were probably made without being aware of alternatives. Combining the best possible features for a next-generation toolkit might be tempting but there are still tradeoffs that cannot be solved. For example, the power of coordinated and linked views offered by Improvise comes at the cost of maintaining caches that should be flushed when the data change so more research is needed to main-tain linked and coordinated views on dynamic data.
There are also lower-level toolkits that can be used to build VA applications. Two popular families are graphics libraries and graph libraries, which we discuss next.
2.2 Graphics Libraries
VA applications can manage their own data structure and take care of the mapping from data to visualization on their own. At this point, they can usescene-graphsordirect-graphicslibraries.
Scene-Graph toolkits can manage the visual structure and view as described in the reference model. They are focused on computer graphics and interaction: they only deal with the visual structure and view. Piccolo and Jazz [6] are popular 2D scene-graph man-agers that have been used to create several information visualiza-tion applicavisualiza-tions (e.g., [8,35].) An early version of Piccolo has also been used as graphics engine for the Cytoscape graph visual-ization system [37] but dropped for performance reasons.
High-performance InfoVis applications use scene-graph opti-mization techniques to speed-up the rendering of scenes. Tulip [1] and Gephi [2] maintain a spatial indexing structure to avoid render-ing objects that are not visible.
wide variety of graphics applications such as games, virtual-reality applications and scientific visualization systems, they are not al-ways adequate for InfoVis systems because they require the explicit specification of geometry and graphic attributes for each displayed objects. Very often, InfoVis can quickly compute graphic attributes and even geometry from data attributes. For example, the position of an item using a scatter-plot visualization is computed using a simple affine transformation the data attributes using thexandy
dimensions. There is no need to store the computed values when computing them on the fly is cheap. The same is true for color and other properties. In contrast, copying and storing this information is costly in terms of time and memory.
Direct-graphics libraries such asProcessingorOpenGLcan also be used to implement the visualization techniques.
Still, when separating the data-model from the visual model, scene-graph managers offer more flexibility than information vi-sualization systems for complex graphics and sophisticated interac-tion. This is why several InfoVis systems still use them.
2.3 Graph Libraries
While most table-based visualization toolkits rely on an in-memory database, several graph-based visualization systems manage their data-structures using a model inspired from graph theory where topology is the main focus and data associated with graph entities is less important. This is the case for the JUNG library [33] or the Boost Graph Library (BGL) [38], as well as for the graph library used by Cytoscape [37].
These libraries support graphs as set of vertices and edges (the topological entities) that can be associated with arbitrary data. This data is just stored by the graph entities as a convenience for the application: the library does not implement any integrity check be-tween data and graph entities. In contrast, IVTK, Prefuse, and Tulip maintain a close consistency between graphs and data tables: re-moving a data table entry associated with a graph entity (vertex or edge) also removes the entity from the graph structure.
Thus, there is no clear consensus on how a graph data structure should be managed internally; the design choices are quite different depending on the communities such as graph theory, information visualization, database, and semantic web.
2.4 Standardization Processes
Standardization is a well established habit in the software commu-nity; several standardization models have been used in the past and these models tend to evolve due to the accelerating pace of software development taking place nowadays.
According to Wikipedia: “The goals of standardization can be to help with independence of single suppliers (commoditization), compatibility, interoperability, safety, repeatability, or quality.” The goals raised in this article are well among them: compatibility, in-teroperability, and quality.
Standardization roughly follows four models:
1. Specified by national and international organization such as the International Organization for Standardization (e.g. ISO, ASCII),
2. Specified by a private or public consortium (e.g. the Unicode Consortium, the OMG, and the World Wide Web Consor-tium (W3C)). Closer to the InfoVis community, “The Open Geospatial Consortium” [34] which is an international indus-try consortium of companies, government agencies, and uni-versities participating in a consensus process to develop pub-licly available interface standards for geospatial data. 3. Community-driven: looser groups can be faster and allow for
more experiments than formal standardization bodies or con-sortia. Communities, such as the Boost Community[9] — designing libraries for the ISO C++ language — experiment, develop, and document software that sometimes become part
of formal ISO standards. TheJava Community Process[28] plays a similar role for the Java language and programming environment.
Standards specified by established organizations go through a formal process that take substantial time; usually years. On the other side, ad-hoc organizations such as consortia can issue standards or recommendations faster. In particu-lar, the W3C or community-drive consortia define stages for their “recommendations” (the name for standard issued by the W3C) before they are considered final. In all cases, these or-ganizations establish steering committees to control the pro-cesses and require substantial involvements from many orga-nizations to achieve standards.
4. De facto: At the other extreme are the application domains where one system becomes the standard. For example, in scientific visualization, VTK [26] has become, in the latest years, thede factostandard toolkit: it is used by researchers and practitioners, and newer solutions are getting integrated quickly into VTK. This is possible when either a system reaches a certain level of popularity — such as Microsoft Word for Word Processors — or when the quality and features of the system are unmatched — such as VTK.
At the current stage, InfoVis toolkits are not understood well-enough to start a formal standardization process. It seems that one toolkit will not become ade factostandard due to the stretch in scope and capabilities of existing toolkits. Two models remain: consortium-driven or community driven. Obvious has started as a community-driven initiative. It is up to the community to decide how it wants to coordinate its software development for better com-patibility, interoperability, and quality.
3 DESIGN
Beyond proposing a unifying design, perhaps the most novel ap-proach of Obvious is theprocesscarried-out to obtain this design. The project started through a sequence of InfoVis Infrastructure workshops [10,17,18], during which consensus was reached that:
1. many common traits were shared among toolkits, often in slightly incompatible ways,
2. much mundane work was needlessly repeated across toolkits, and
3. creating a unified toolkit from scratch was out of reach due to varying needs and design tradeoffs.
Based on those observations, an attempt was made for a new approach of defining a “meta-toolkit” that would allow sharing and implementing cross-compatible services (such as data readers); then design and implement, one by one, the components on which common consensus could be reached for a unified design.
For this reason, Obvious is organized according to the InfoVis reference model in three main packages: data, visualization, and view. It provides utility classes in the “util” package in addition. Next, efforts were focused on designing a consensual data model. For now, the data model is the most elaborated and successful part of the framework.
Resting on these foundation modules (data, visualization, view), some actual service packages have been developed, such as data readers, writers, and conversions to provide immediate utility to both the Obvious users and the toolkit designers.
3.1 Data Model
This section describes the data model used in Obvious to repre-sent and manipulate data structures. This model has been specified for the most part during the 2008 workshop [17] as consensus has emerged, tediously but rapidly on its central and annex features.
Figure 2: Class diagram of the Obvious data model
to offer high extensibility and good usability. Among all the pat-terns introduced in [24], the proxy tuple pattern enables both as it encompasses graphs in an object-oriented manner — many devel-opers are used to manipulation ofobject oriented graphs—- and as it unifies the data model around the same standard structure (tuples and tables). In our data model, tuples are standards elements of all structures: tables are composed of tuples and graphs/trees are im-plemented as networks, i.e., graphs built around two tables one for the nodes and the other for the edges.
This model is instantiated via factories that allow cross-toolkit interoperable data structure instantiation. With those factories, it is possible to instantiate tables and networks from a schema or from an existing object from a targeted Obvious implementation (e.g. a Prefuse table or a JUNG graph). This also provides the possibil-ity to use parameters to provide more arguments used in targeted toolkits. For example, in the Prefuse implementation of Obvious, parameters are used to specify the source and target node columns for a graph in an edge table.
In addition to data access, our data model provides 3 optional, in-teroperable, features:introspection,batch editing, andnotification. Those features are not found in all target toolkit implementations and, thus, sometimes had to be emulated.
3.1.1 Introspection
Introspection means the capability of a program to inspect its own content. In the context of the data model it means mostly that ob-jects expose their own schema explicitly and allow manipulating it as a full-fledged object. As an improvement over [24], our data model uses a meta-circular schema design (the schema is itself a table) instead of a column object, that does not exist in Obvious. Schemas have been introduced because they are an efficient an el-egant mean to gather allmeta-datafor the columns of a table in one unique structure, allowing easy table and network instantiations with a factory. The main use of introspection in a toolkit, though, is to enable generic implementation of a variety of side services as varied as generic persistence, undo/redo, and universal object edi-tors.
3.1.2 Batch Editing
Batch editing means that one or many cells in a data model may be edited at the same time. This happens when the toolkit manages analytical columns (e.g. computing the centrality of each vertex in a network), with selection and dynamic queries if their effect is reported to a data column or simply if a user wants to change values interactively, either in the data table or through a visualization by direct manipulation [5].
3.1.3 Notification
All the popular InfoVis toolkits (e.g. [25, 16,33,4]) implement notification using the “Observer” pattern from [19] to propagate information about changes affecting the data model. This pattern specifies two roles: Observable and Observer; in our case, data models are Observables meaning that they allow Observers to reg-ister and be notified when they are changed. During the design of Obvious, we realized there were some variants in the way toolk-its implemented this pattern. This is why the notification system
Table Listener
addRow(Tuple tuple)
tableChanged(...) Change propagated beginEdit(int mode)
addRow(Tuple tuple)
tableChanged(...) Custom strategy addRow(Tuple tuple)
tableChanged(...) Custom strategy endEdit(int mode)
Figure 3: Sequence diagram for the notification system
introduced in Obvious is designed to support a wide variety of no-tification models, even those not currently implemented in current toolkits but that will be required to scale. The notification system in Obvious is also based on the Observer design pattern with exten-sions to supports transaction and batch techniques usually found in database system.
Combining Notification and batch editing raises a challenge: since one operation can affect a large amount of data, a flow of notifications concerning the same action will be generated. If each change is managed in isolation, the application can spend a large amount of time updating visual structures, e.g. recomputing a lay-out for each modified item. This typically leads to the application being unresponsive for a long time.
Thus, Obvious introduces a method to control the management of batch notifications: the beginEdit/endEdit mechanism. Fig-ure 3shows the sequence diagrams of the notification manager. Each time a data table is changed, the change is transmitted to the Observer with a call to thetableChanged method. This method takes several arguments describing the current event (affected Ta-ble, rows, columns, and operation type): this is the typical Observer pattern.
When thebeginEditmethod is called on an Obvious data table, the Observer’sbeginEditmethod is called to start a batch editing transaction. Different strategies can be applied by the observer. A
modeparameter allows the observer to select a specific strategy de-pending on the type of transaction (atomic or batched). Note that the observer will still receive a tableChanged call for each tuple modified. The observer is in charge of implementing a strategy to optimize atomic/batch edition. If it does not, the standard behav-ior will happen and batch editing will flood the observer — which is acceptable in some cases. The following strategies have already been developed in one or more Obvious implementations:
Batch strategy after beginEdit, the observer buffers the infor-mation sent by tableChanged. When endEdit is called, the actions are performed on each of the buffered items. Note that buffering can be complicated when items are created, deleted or changed many times. The burden is left to the observer since this management can be heavily optimized depending on the action to perform.
Transaction strategy after beginEdit, the observer buffers the information sent by tableChanged. When endEdit is called, it first checks structural invariants (for example, no null value for a spe-cific field) before performing its actions on the modified items.
ThebeginEdit/endEdit mechanism has been added to support batch editing and also database transactions. When the data model implementation relies on a transactional database, atomic and batch transactions will occur and notifications (e.g. implemented as database triggers) will arrive in batches. The semantic of Obvious notification handles this case correctly but the observer should be aware that the tableChanged method can be called much later than when the table is actually changed. This is the case for database atomic transactions: the actual notification is propagated after the end of the transaction when the database engine has done all the integrity checks.
In practice, the three strategies we have described have been suf-ficient so far to handle all the cases required inside toolkits. We performed experiments using MySQL and Oracle systems wrapped by Obvious with negligible overhead. Managing notifications using the batch or transaction strategies increased performance typically by a factor 100 compared to the “one notification per operation” strategy exposed by standard toolkits. The impact on performance is therefore substantial, in particular when managing dynamic — a very standard situation in VA applications that has not been well addressed in InfoVis so far.
3.1.4 Other services
To leverage our core implementation and offer some immediately useful services to Obvious users, we have defined a utility package “obviousx”, named in the same way as the Java extension package “javax”. This package provides different kinds of utility classes for the Obvious data model. First, we have defined reader and writer interfaces allowing the creation of gateways between the Obvious data model and common data formats such as CSV and GraphML. It provides software developers a standard way to import and export data in Obvious whatever the underlying implementation of the data model is. In addition, for data providers, it simplifies their work because they only have to develop one reader and one writer to be compatible with a large number of toolkits.
With the same logic, obviousx provides compatibility classes to use with standard Java components such as a Java Table Model that allows the creation of a JTable from an Obvious table. Finally, ob-viousx also provides wrappers tomapobvious data structures into common existing data structures (e.g. for Prefuse, IVTK, and Jung) to share data structures when using more than one data model. 3.2 Visualization and View models
Unlike the data model, no consensus emerged concerning the Vi-sualization and View models during the workshop [17]; the main reason being the different approaches chosen among toolkits. One important issue is the monolithic vs. polylithic approach. Another one is related to tables vs. objects: some toolkits keep the visualiza-tion data in tables (e.g. Prefuse, IVTK, and Tulip) whereas others create objects for displaying (e.g. Improvise, Cytoscape) or noth-ing at all when there is a pipeline as in Discovery. So, more work is needed to design the abstractions required to wrap the different implementations. Further discussions and workshops will address the problem.
Still, Obvious provides a solution: it wraps visualizations into a black box with a small set of methods and — for the creation of
these visualizations — it relies on aFactorydesign pattern [19]. For example, creating a scatter-plot visualization from a data table requires the following lines:
Listing 1: Creating a visualization using a Factory
1 Map params =newHashMap();
2 params.put(”x”, ”id” );
3 params.put(”y”, ”age” );
4 Visualization vis = VisualizationFactory . getInstance ()
5 . createVisualization ( table , null, ” scatterplot ”, params);
The variable “param” contains parameters to configure the visual-ization, here to specify which attribute will be used for thexandy
axes.
With this mechanism, it looks as if Obvious were a monolithic toolkit but the actual implementation of the Obvious wrapper for a polylithic toolkit can easily translate a monolithic specification into a dedicated configuration for the underlying polylithic compo-nent. The code above will work for the Prefuse toolkit and return a polylithic component wrapped as an Obvious visualization and configured as a scatter-plot visualization.
If a developer needs a visualization component that does not ex-ist in the default implementation (e.g. an IVTK time-series with a Prefuse-wrapped data table), the visualization can be created di-rectly from a specified factory or from the Obvious class:
newIvtkTimeSeriesVis( table , null, ” timeseries ”, params)
An Obvious visualization works with any Obvious data model. The data model will be either wrapped to become compatible with the native model if the underlying implementations are different or unwrapped when the visualization and the data model are from the same implementation (e.g. Prefuse).
This mechanism avoids copying data from one structure to an-other, which is a crucial point for VA. Alternatively, Obvious also provides a default mechanism to quickly copy and synchronize data models when no wrapper has been defined for a specific toolkit. Current wrappers are lightweight, adding very little overhead to the system.
At this point, the application developer can choose one of the existing visualizations from one of the wrapped toolkits or decide to create a new one which can derive from one of the wrapped toolkits or be implemented from scratch. Obvious substantially increases the number of possible visualizations and toolkits to use and does not limit the developer in any way at this stage.
AViewis simply specified as a black box implementing a sim-plified version of the camera pattern introduced in [24] to support standard operations such as zoom and pan. Like the visualization interface, future workshops should enrich it when a more consen-suses are reached.
4 IMPLEMENTATIONS
This section describes the implementation of Obvious and points the lessons learned during implementations binding Obvious inter-faces to wrappers around concrete toolkits. Each toolkit has its own design choices that are discussed in articles but some of the impli-cations came to light when implementing the bindings, for example differences of interpretations of design patterns. We briefly describe the most important lessons here.
The core of Obvious is a small (40Kb) Java project [32] managed by Maven [14] to facilitate its deployment. It consists in 44 java files, 23 interfaces and 21 utility classes organized in 5 top-level packages: data, viz, view, util and impl. It has been designed to be small and lightweight. Therefore, the substantial parts are in each concrete toolkit binding.
4.1 Prefuse
the abstractions described in the core Obvious interfaces for all data models, visualizations and views.
For the visualization, Prefuse is currently the only polylithic In-foVis toolkit with a binding for Obvious. As explained in3.2, Ob-vious does not offer a visualization abstraction for polylithic com-ponents. Thus, Obvious provides components pre-configured for well know visualization techniques such as scatter-plots or force directed graphs. Currently, if a software developer wants to visu-alize an Obvious table using a Prefuse visualization not offered in the Obvious visualization factory, the only requirement is to convert the data model to a Prefuse data table using an obvious component contained in the Prefuse binding.
Several interfaces defined by Obvious are based on a Prefuse concrete class. Therefore, Prefuse was used as a complete imple-mentation of Obvious to check its model and syntax.
4.2 IVTK
Since IVTK is monolithic and follows the reference InfoVis model, its Obvious binding realizes all the interfaces for the data model, vi-sualization and view introduced in Obvious. IVTK has monolithic visualizations, providing them simply consists in wrapping an Ob-vious visualization around their class and implementing a factory to create them by name.
However, the data model of IVTK differs from Obvious for trees and networks: in IVTK, the Graph interface is not a super-interface of the Tree interface. In addition, some data model classes are more specialized in IVTK than in Obvious. For example, tables can be described as static tables or dynamic tables. The binding was there-fore complicated by these mismatches that needed a more compli-cated code than for Prefuse. Nevertheless, IVTK binding is opera-tional and reliable.
4.3 Improvise
The Obvious implementation based on Improvise only implements the data model part for tables. Even if Improvise is a mono-lithic toolkit, Obvious cannot directly bind Improvise visualization components because the toolkit does not expose its visualization pipeline publicly: Improvise components are intended to be com-plete black boxes. Addressing this problem would require some changes inside the current version of Improvise. In addition, Im-provise does not support well dynamic data, which is a functionality intended to be in every obvious implementation.
Currently, Improvise can use a data table from an Obvious data table but the rest of the Improvise pipeline is hidden from Obvi-ous. Providing a complete binding for Improvise in Obvious would require some changes in Improvise.
4.4 JDBC
JDBC is the standard Java interface to standard SQL databases. We wrapped JDBC in an Obvious data table to prove that Obvious can support a large variety of data model, not only models com-ing from InfoVis toolkits. JDBC was chosen because databases are frequently used as data sources for applications and since JDBC provides additional features not available in the toolkits data tables such as atomic and batched transactions. We used it to test the no-tification model introduced formerly. As expected, this implemen-tation only supports the data model of Obvious.
Concretely, this implementation translates Obvious methods into SQL queries. For example, the data table “get” methods are imple-mented as SELECT queries, the “set” methods as UPDATE queries, the “add” methods as INSERT queries, and the “remove” methods as DELETE queries. Queries are written in standard SQL and sev-eral applications have been written to work with different DBMS such as MySQL and Oracle. In addition, for the notification system,
table listeners compatible with transaction and batch strategies pre-sented in3.1.3have been developed and help validate the Obvious notification model.
4.5 JUNG
JUNG is a graph library in Java that mainly manages the graph topology but associates arbitrary attributes with vertices and edges. Concretely, this implementation realizes all interfaces defined in Obvious, except for tables and schemas since these notions do not exist in JUNG. Schemas are mandatory in Obvious, so this imple-mentation uses a default schema impleimple-mentation from the Obvi-ous core package. The network structure of ObviObvi-ous is similar to JUNG’s graph; therefore, the data model of JUNG was easy to wrap as an Obvious Network. Concerning the visualizations and views, JUNG provides monolithic visualizations. The Obvious implemen-tation simply binds existing JUNG visualization components to Ob-vious visualizations.
This implementation was the easiest to create since Obvious and JUNG share common hypotheses: for their data model (Obvious network and JUNG graph are equivalent) and JUNG and Obvious are both compatible with the monolithic approach.
4.6 Units tests
Obvious is specified using Java interfaces and some comments in the implementation files but without any formal specification of the precise behavior of the defined interfaces. To verify that all the implementations behave correctly and consistently, we have imple-mentedUnit Tests: a suite of classes and methods aimed at testing all the methods of all the classes.
Currently, the tests are only defined on the data model of Obvi-ous. The level of specification of Obvious visualizations and views is not sufficient to perform useful tests.
Unit tests need an implementation to work; they cannot test ab-stract classes or interfaces. Due to the similarities of Obvious and Prefuse, the Prefuse binding has been used to set up the unit tests for the data model of Obvious. They have then been moved to the core Obvious module to be usable by all the bindings. Unit tests allow authors of Obvious bindings to automatically test whether their im-plementation behaves in conformance with the intended semantics of Obvious. Also, authors are able to extend these existing tests in their own module to perform more advanced ones for their binding. Concretely, unit tests have been defined with JUnit [39] for the following interfaces: Schema (14 tests), Table (11 tests), Network (13 tests) and Tree (8 tests); all part of the Obvious core package. These tests have been systematically run for each new Obvious data model development: all presented implementations success-fully passed those tests.
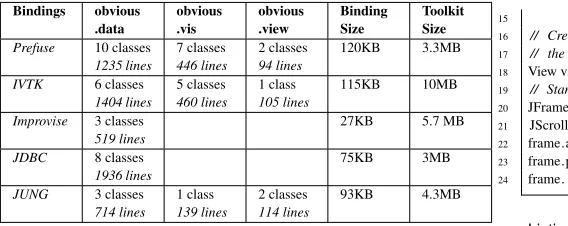
With the exception of Improvise, all the toolkits we wanted to support are now available with Obvious. The extra code required for binding a concrete toolkit is quite modest compared to the toolkit itself and the overhead in time has always been negligible. Table1summarizes the footprint of the implemented Obvious mod-ules and the services they support. At this point, Obvious is usable with a wide range of concrete implementations and we report on its uses in the next section.
5 EVALUATION
Bindings obvious
.data obvious.vis obvious.view BindingSize ToolkitSize
Prefuse 10 classes
1235 lines 7 classes446 lines 2 classes94 lines 120KB 3.3MB
IVTK 6 classes
1404 lines
5 classes
460 lines
1 class
105 lines
115KB 10MB
Improvise 3 classes
519 lines 27KB 5.7 MB
JDBC 8 classes
1936 lines
75KB 3MB
JUNG 3 classes
[image:8.612.54.338.53.166.2]714 lines 1 class139 lines 2 classes114 lines 93KB 4.3MB
Table 1: Footprint of Obvious bindings.
Another method — used to validate Prefuse [25] – would be to re-implement complex VA applications using Obvious and assess the results, again in term of time and quality. This is what we have done and we report on our results here.
5.1 Coding applications with Obvious
This section shows how Obvious can implement common applica-tions in InfoVis such as the creation of a scatter-plot or of a network visualization. These examples explain how to combine Obvious components to build an application, how to create data structure and spot patterns to use. The first use-case concerns the coding of a network visualization with the Obvious-IVTK implementation and the second based on the coding of a scatter-plot by combining component from different Obvious implementations.
For both examples and more generally for every creation of an Obvious application, developers have to follow the following steps:
Step 1: creation of an Obvious data structure, either directly with a standard constructor or through a factory. Three ways exist to fill the data structure:
1. wrapping an existing data structure from a targeted toolkit as shown in the first example,
2. using an Obvious reader to load an Obvious structure from a well known file format (CSV, GraphML...) as shown in the second example,
3. using Obvious methods to directly manipulate the data struc-ture (addRow, addNode, addEdge...); an example would be too long for this article.
Step 2: Creation of an Obvious visualization from the created data structure and additional parameters. This can be done directly with a class constructor or through a factory. The parameters allow customization of the Obvious monolithic components. As shown in the second example, it is possible to use the data structure from one Obvious implementation with a visualization from another.
Step 3: Creation of an Obvious view with the created visual-ization directly with a constructor or through a factory.
Listing 2: Visualizing a graph with Obvious
1 // Creates the graph structure . First , set the factory to use ( ivtk ). 2 // Then loads the native data structure , and get a factory instance . 3 // Finally , calls the convenient method of the factory .
4 System. setProperty (”obvious.DataFactory”,
5 ”obvious. ivtk . data . IvtkDataFactory” );
6 infovis .Graph g = Algorithms.getGridGraph(10, 10);
7 DataFactory factory = DataFactory. getInstance ()
8 Network network = factory . createGraph(g);
9
10 // Creates the associated visualization using the
11 // factory for visualization . No predicates and extra 12 // parameters are given to the constructor .
13 Visualization vis =new IvtkVisualizationFactory ()
14 . createVisualization (network, null, ”network”, null);
15
16 // Creates the view. No predicates and extra parameters are given to
17 // the constructor .
18 View view =newIvtkObviousView(vis, null, ”graphview”,null);
19 // Standard Java window creation
20 JFrame frame =newJFrame();
21 JScrollPane panel =newJScrollPane(view.getViewJComponent());
22 frame.add(panel );
23 frame.pack ();
24 frame. setVisible (true);
Listing 3: Combining different Obvious implementations to display a scatter-plot
1 // Defines the data factory to use,
2 // Obvious−Prefuse will be used for the data structures .
3 System. setProperty (”obvious.DataFactory”,
4 ”obvious. prefuse . PrefuseDataFactory” );
5 // Creates an Obvious CSV reader and loading an 6 // Obvious table
7 CSVImport csv =newCSVImport(newFile(”example.csv”), ’ , ’ );
8 Table table = csv. loadTable ();
9
10 // Creates the parameter map for the monolithic object .
11 Map<String, Object>param =newHashMap<String, Object>();
12 param.put(”x”, ”id” ); // xfield
13 param.put(”y”, ”age” ); // yfield
14
15 // Creates the visualization then the view. No predicates are given to 16 // the constructor .
17 Visualization vis =new IvtkScatterPlotVis ( table , null, ” plot ”, param);
18
19 View view =newIvtkObviousView(vis, null, ” plot ”, null);
20 // Standard Java window creation 21 ...
5.2 Integration of Weka and RapidMiner
Weka [22] and RapidMiner [31] are suites of machine-learning algorithms and data structures widely used to design machine-learning applications. The obviousx package of Obvious supports two mechanisms to build the main data structure of Weka and RapidMiner from an Obvious Table:
• an Obvious table can be copied into a Weka or RapidMiner data table, which are data structures specially optimized for the fast execution of machine learning algorithms. With this approach, running-time is optimized but data is duplicated.
• an Obvious table can be wrapped as a Weka or a RapidMiner data table: it then translates its methods calls into Obvious equivalents. With this approach, memory-footprint is opti-mized since data is not copied at the expense of speed. Both methods are equivalent in terms of lines of code and can be applied to the same machine learning algorithms from Weka and RapidMiner. For example, wrapping the table from the code sample
3into a Weka structure requires the following line:
Listing 4: Wrapping an Obvious Table into Weka Instances
1 Instances inst =newObviousWekaInstances(table, ” Instances ” );
This “Instances” can be used by all the machine-learning algo-rithms defined in Weka. Creating this wrapper took about three days to one developer who knew Obvious well but was discovering Weka and two for RapidMiner for the same developer.
analysis algorithms could port them to use Obvious data structures so that they become usable by a substantial number of toolkits and application programmers to build VA systems.
5.3 EdiDuplicate
The French National Institute of Research in Computer Science and Control (INRIA) maintains a repository called HAL-INRIA [21] to store, index and give access to its publications. Entering publica-tions is a manual process done by researchers who make mistakes. These mistakes can result in duplicated authors, institutions, or arti-cles. Thus, INRIA needs to clean the HAL database with tools that can detect potential duplicates and ask skilled users to resolve them. Currently, INRIA leaves that task to librarians with very primitive tools.
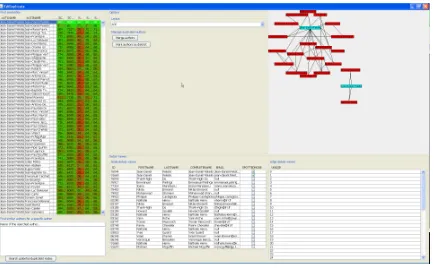
EdiDuplicate is a VA system designed to detect and merge du-plicated entities in the HAL-INRIA publication database; it has been built with Obvious. It is an adaptation of the D-Dupe soft-ware [29] with extensions to cover needs specific the HAL-INRIA database [21] to perform specific operations in a workflow.
Each time a new entity is created in the database, multiple sim-ilarity metrics are automatically computed between this entity and all the ones already in the database. When a user connects to the editing interface of EdiDuplicate, this information is loaded in an Obvious table and displayed, as shown on the left pane of Figure4
using a standard Java table. Each row refers to one pair of names and the columns contain the multiple similarity measures with a green-red color coding; the table can then be sorted according to any column order.
[image:9.612.67.284.416.551.2]When a pair is selected by clicking on a row, a network view is created that visualize the neighborhood network of the pair of entities, as shown on the right of Figure4. The neighborhood is computed from publication data: for a target entity, it contains all the entities already connected to it through co-authorship relations. This information helps the user decide if the pair of entities has to be merged.
Figure 4: The EdiDuplicate application
The application mainly combines Obvious components and Swing components (derived from Obvious structures). For the data model, an Obvious Network is used with the IVTK implementation of Obvious; the visualization and the view parts are also provided by this implementation. Building this application took less than a week.
5.4 DBMS Caching Tables
We have extended the JDBC implementation of Obvious to allow caching and notification management directly from a table stored in a DBMS. Currently, this mechanism works with the Oracle and MySQL DBMSs. The Obvious data table component reads data on demand from a table in the DBMS, stores it in memory and serves it from memory while keeping a bidirectional link with the DBMS.
When the DBMS table is modified from any application, a database trigger is invoked that notifies the Obvious table implementation that some rows are invalid. They are then flushed from memory and will be read again when the application needs them. The com-munication between the DBMS and the Obvious component is done through a fast network connection (UDP packets). Oracle provides a standard API to send UDP packets whereas we had to add an ex-tension written in C to MySQL to support them (200 lines of C).
The cached tables are implemented using Obvious (different bindings have been used: Prefuse, IVTK, JDBC and JUNG). Sev-eral applications have been built around Obvious DBMS caching tables; one of them is presented in the next section. Cached tables can be used as an initial step to implementing out-of-core algo-rithms but the caching strategy will always need to be adapted to the algorithm. Again, that adaptation can be done later on when the algorithm already works on smaller datasets.
5.5 Network Visualization on a Large Wall
INRIA shares with other institutions a Wall-Size display called WILD [42] made of 32 high-resolution 32” screens. Using Obvi-ous, we have developed an application for visualizing co-authorship networks on WILD. WILD is made of 16 machines serving 2 screens each and connected to a gigabit Ethernet network.
Our application uses a client-server approach: the server pro-gram loads the network using Obvious, computes its layout and stores the result as a set of graphic primitives in a database table using an Obvious-JDBC data table. For each screen, one client pro-gram is launched that uses the DBMS caching data-structure to load its visible portion of the nodes and links, i.e., the area that is visible on the portion of the screen managed by the client.
An Oracle DBMS is used to store publications data in two ta-bles: one for the authors (containing id and name) and one for the publications (containing pairs of publication id and author id).
Our application uses Obvious-Prefuse in the server and in the clients, with Obvious-caching data-structures. A polylithic archi-tecture is particularly well suited to this kind client-server approach sharing the visualization through the network.
Since cached tables are synchronized with the DBMS, the whole pipeline is dynamic: when a data table containing the network is modified (e.g. a new author is added), it is reloaded by the server, the layout is recomputed by Prefuse and the visual table is stored in the DBMS. When the DBMS visual table is changed, the clients are notified and they reload and redisplay the content.
Designing the application boiled down to having a first version using Obvious-Prefuse in memory, then changing the data tables to use the JDBC caching, then changing the visualization to store its results in the database through an Obvious-JDBC table and then implementing the clients. A step-by-step development where the application logic can be tested first on a standard desktop computer and then deployed to a more specific setup.
5.6 Implementing a Cross-Toolkit Layout Component We have also tested a more advanced usage scenario: devising a novel layout algorithm and using the Obvious toolkit to make it available in a variety of toolkits. This layout component is a gener-alized treemap algorithm. Its interface makes it easy to port as this algorithm takes as input a data model and renders using a Visitor de-sign pattern [19] to a renderer object, making it very convenient to implement across polylithic toolkits such as Prefuse or Discovery. Considering that the current visualization model is mostly targeted at enabling monolithic patterns, Obvious in its current state turns out to be of limited use for our purpose.
model already saves us time in the development of our prototype, while we have the assurance that only minimal work may be needed to port our method to the toolkits targeted by Obvious.
5.7 Conclusion
The examples described in this section assess an important strength of Obvious: it allows a clear separation of concerns in the devel-opment of VA applications with a small memory and performance footprint. The data model of the application can be chosen inde-pendently from the visualization components as long as all these components fit the Obvious model. From our experience, a large number of the VA application fit the Obvious model and they will benefit from the meta-toolkit in term of richness and extensibility.
Richness comes from the already large choice of visualizations and interaction techniques provided by the wrapped toolkits. Exten-sibility comes from the large choice of toolkits that can be used as basis for the implementation of novel visualizations and interaction techniques.
6 FUTURE WORK
6.1 Extending Obvious Supported Features
Obvious aims at covering all the features of an InfoVis toolkit for which a consensual interface can be specified. Relying on a com-mon reference model helps tremendously but falls short on some implementation design choices. Still, a few specific services have already been mentioned during workshops that could give rise to a shared implementation:
1. selection management: to implement cross-toolkit brushing and linking,
2. Mappings of data value to scalar value: this feature is used by all the visualizations to map data dimensions to screen co-ordinates, color gradients and many other visual attributes. Because the interface of such features is small and well un-derstood, consensus is reachable,
3. visualization scale, tick-mark and tick-label management, 4. graph layout computation.
While most of those features would be of high value and we feel consensus can be reached, we have not, as of yet, proposed unifying designs. The main reason is that while the core structure of those services is consensual, they rely on parts which are not yet consen-sual, such as the application architecture and more elaborated view, visualization and interaction models.
6.2 Adding Additional Toolkits and Languages
Regarding porting Obvious to other languages, two competing ap-proaches are being considered. One involves making the API as language neutral as possible; the other considers that widespread adoption is only possible on a particular platform and language if its idioms are respected.
With the first approach, a wished extension would consist in porting Obvious to other languages and platforms, such as C++, JavaScript and C#. Obvious has been designed to avoid using id-ioms too specific to Java so we believe it could be done without much difficulties. There would be at least two benefits: the avail-ability of a meta-toolkit is these languages to wrap InfoVis toolkits, and the availability of a common application programmer’s inter-face (API) for InfoVis that would simplify learning and spread-ing the best practices. Multi-language APIs already exist and are popular in recommendations of the W3C. For example, the Doc-ument Object Model API (DOM, see http://www.w3.org/ DOM/) used to manipulate HTML or XML documents has offi-cial bindings for Java and JavaScript and non-standard bindings for several of the major languages (http://www.w3.org/DOM/ Bindings) with slight variations to cope with the language id-ioms.
With the second approach, the Obvious design patterns should leverage the support platform/language conventions and blend as well as possible with its context. Interoperatbility — which is still strongly wished — should focus on communication formats and protocols rather than code similarity in the various languages.
A real-world test of how generalizable and unifying Obvious would be post-hoc integration with an industrial toolkit. For ex-ample, IBM ILOG JViews [27] is a commercial monolithic toolkit and framework including data models, monolithic visualizations, views, a graph model, an extensive library of graph drawing al-gorithms. Interfacing JViews with Obvious would provide JViews users access to novel features brought by the research community, and open a venue for research results to make their way into com-mercial products.
6.3 Community Building
Perhaps the most novel experience we retain from Obvious is the community-driven process to reach consensus and realize a refer-ence implementation. We intend to formalize this process, either through a formal consortium of with a less formal community-driven process, depending on the response of the community.
6.4 Obvious and Other Visualizations
VA often needs to combine InfoVis with Scientific Visualization and/or GeoSpatial Visualization. These two domains are more ma-ture than InfoVis for standardization: the Scientific Visualization community is converging towards using VTK [26] as ade facto
standard whereas the GeoSpatial Visualization community already has a mature GeoSpatial Consortium producing software [34].
Geometrical data structures are much less sophisticated in Info-Vis than in the two others visualization fields. Pre-computing com-plex geometries and maintaining them dynamically is a main con-cern in Scientific Visualization and GeoSpatial Visualization; not so much in InfoVis. Moreover, even if at the abstract level Scien-tific Visualization and GeoSpatial Visualization share this concern, at the implementation level; their geometrical structures are quite different, adding another level of complexity to the problem.
Currently, the state of the art in combining these visualizations is to put them side-by-side with coordinated interactions (brushing and linking, dynamic queries) [30]. This kind of integration can be implemented by maintaining separate data structures, separate visualizations and views; coordination being done through ad-hoc item identifiers shared across the visualizations and acting as pivots. From a user-centered viewpoint, unifying the interactions would also improve the usability of mixed visualization applications.
Combining two or the three fields at the software infrastructure level will require more discussions and experiments between the communities and seems like a long-term goal.
7 CONCLUSION
We have presented Obvious, a meta-toolkit whose goal is to facil-itate the development of Visual Analytics applications. Obvious provides concrete, immediate benefits to Visual Analytics applica-tion programmers: it improves reusability and interoperability of code and software components, and defers the choice of the which toolkit(s) to use to a later stage of the Visual Analytics application and provides bridges between tools instead of another competing toolkit. It also allows toolkit and library developers to integrate their tool into the rich environment of Obvious-compatible systems. It exposes programmers to state of the art design patterns as well as a wealth of convenience features. Overall, we believe it clarifies and simplifies the implementation of Visual Analytics system.
ACKNOWLEDGEMENTS
The authors wish to thank the participants of the VisMaster Work-shop on Visual Analytics Software Architecture: Fanny Cheva-lier, Christophe Favart, Jeffrey Heer, Joshua O’Madadhain, Harald Piringer, Danyel Fisher, Giueseppe Santucci, Mike Smoot, Martin Theus, and Chris Weaver. This work has been partially funded by the VisMaster Project [40].
REFERENCES
[1] D. Auber. Tulip : A huge graph visualisation framework. In P. Mutzel and M. J¨unger, editors,Graph Drawing Softwares, Mathematics and Visualization, pages 105–126. Springer-Verlag, 2003.1,2
[2] M. Bastian, S. Heymann, and M. Jacomy. Gephi: An open source software for exploring and manipulating networks. InInternational AAAI Conference on Weblogs and Social Media, 2009.2
[3] T. Baudel. Visualisations compactes: une approche declarative pour la visualisation d’information. InProceedings of the 14th French-speaking conference on Human-computer interaction (Conference Francophone sur l’Interaction Homme-Machine), IHM ’02, pages 161–168, New York, NY, USA, 2002. ACM.1,2
[4] T. Baudel. Browsing through an information visualization design space. InCHI ’04 extended abstracts on Human factors in computing systems, CHI EA ’04, pages 765–766, New York, NY, USA, 2004. ACM.2,4
[5] T. Baudel. From information visualization to direct manipulation: ex-tending a generic visualization framework for the interactive editing of large datasets. InProceedings of the 19th annual ACM symposium on User interface software and technology, UIST ’06, pages 67–76, New York, NY, USA, 2006. ACM.2,4
[6] B. B. Bederson, J. Grosjean, and J. Meyer. Toolkit design for interac-tive structured graphics.IEEE Trans. Softw. Eng., 30:535–546, August 2004.2
[7] N. G. Belmonte. Javascript infovis toolkit, Mar. 2011.1
[8] A. Bezerianos, P. Dragicevic, J.-D. Fekete, J. Bae, and B. Watson. Geneaquilts: A system for exploring large genealogies. IEEE Trans-actions on Visualization and Computer Graphics, 16(6):1073–1081, Nov-Dec 2010.2
[9] Boost c++ libraries. http://www.boost.org/.3
[10] K. Borner, B. Herr, and J.-D. Fekete. 2007 work-shop on information visualization software infrastructures. https://nwb.slis.indiana.edu/events/ivsi2007/, July 2007.3
[11] M. Bostock and J. Heer. Protovis: A graphical toolkit for visualiza-tion. IEEE Transactions on Visualization and Computer Graphics, 15:1121–1128, November 2009.1
[12] S. K. Card, J. D. Mackinlay, and B. Shneiderman, editors. Readings in information visualization: using vision to think. Morgan Kaufmann Publishers Inc., San Francisco, CA, USA, 1999.2
[13] E. H.-h. Chi and J. Riedl. An operator interaction framework for vi-sualization systems. InProceedings of the 1998 IEEE Symposium on Information Visualization, pages 63–70, Washington, DC, USA, 1998. IEEE Computer Society.2
[14] S. Company. Maven: The Definitive Guide. O’Reilly Media, Inc., 1 edition, Oct. 2008.5
[15] S. G. Eick. Visual discovery and analysis. IEEE Transactions on Visualization and Computer Graphics, 6:44–58, 2000.1
[16] J.-D. Fekete. The infovis toolkit. InProceedings of the IEEE Sympo-sium on Information Visualization, pages 167–174, Washington, DC, USA, 2004. IEEE Computer Society.1,2,4,6
[17] J.-D. Fekete. Vismaster workshop on visual analytics software archi-tecture. http://code.google.com/p/obvious/wiki/Motivation, Decem-ber 2008.3,5
[18] J.-D. Fekete and K. Borner. 2004 workshop on information visualiza-tion software infrastructures. http://vw.indiana.edu/ivsi2004/, Novem-ber 2004.3
[19] E. Gamma, R. Helm, R. Johnson, and J. Vlissides. Design patterns: elements of reusable object-oriented software. Addison-Wesley Pro-fessional, 1995.4,5,8
[20] T. Gonzales and M. VanDaniker. Axiis open source data visualization. web site: http://ww.axiis.org, 2009-2011.1
[21] The hal iniria publication site. http://hal.inria.fr.8
[22] M. Hall, E. Frank, G. Holmes, B. Pfahringer, P. Reutemann, and I. H. Witten. The weka data mining software: an update.SIGKDD Explo-rations, 11(1):10–18, 2009.7
[23] J. Heer. flare data visualization for the web, Mar. 2011.1
[24] J. Heer and M. Agrawala. Software design patterns for informa-tion visualizainforma-tion.IEEE Transactions on Visualization and Computer Graphics, 12:853–860, September 2006.2,3,4,5
[25] J. Heer, S. K. Card, and J. A. Landay. Prefuse: a toolkit for interactive information visualization. InProceedings of the SIGCHI conference on Human factors in computing systems, CHI ’05, pages 421–430, New York, NY, USA, 2005. ACM.1,2,4,7
[26] L. Ibanez, W. Schroeder, L. Ng, and J. Cates. The ITK Software Guide. Kitware, Inc. ISBN 1-930934-15-7, http://www.itk.org/ItkSoftwareGuide.pdf, second edition, 2005.
3,9
[27] IBM. Ilog visualization for java. web site: http://www-01.ibm.com/software/integration/visualization/java/, 1998-2011.9
[28] The java community process. http://www.jcp.org/.3
[29] H. Kang, L. Getoor, B. Shneiderman, M. Bilgic, and L. Licamele. In-teractive Entity Resolution in Relational Data: A Visual Analytic Tool and Its Evaluation.IEEE Transactions on Visualization and Computer Graphics, 14:999–1014, 2008.8
[30] D. Keefe, M. Ewert, W. Ribarsky, and R. Chang. Interactive coordi-nated multiple-view visualization of biomechanical motion data.IEEE Transactions on Visualization and Computer Graphics, 15:1383– 1390, 2009.9
[31] I. Mierswa, M. Wurst, R. Klinkenberg, M. Scholz, and T. Euler. Yale: rapid prototyping for complex data mining tasks. InProceedings of the 12th ACM SIGKDD international conference on Knowledge discovery and data mining, KDD ’06, pages 935–940, New York, NY, USA, 2006. ACM.7
[32] Obvious source repository. http://code.google.com/p/obvious.5
[33] J. O’Madadhain, D. Fisher, S. White, and Y.-B. Boey. The jung (java universal graph/network) framework. Technical report, UCI-ICS, 2003.1,3,4
[34] The open geospatial consortium. http://www.opengeospatial.org/. 3,
9
[35] C. Plaisant, J. Grosjean, and B. B. Bederson. Spacetree: Support-ing exploration in large node link tree, design evolution and empirical evaluation. InProceedings of the IEEE Symposium on Information Vi-sualization (InfoVis’02), INFOVIS ’02, pages 57–, Washington, DC, USA, 2002. IEEE Computer Society.2
[36] R Development Core Team.R: A Language and Environment for Sta-tistical Computing. R Foundation for Statistical Computing, Vienna, Austria, 2011. ISBN 3-900051-07-0.7
[37] P. Shannon, A. Markiel, O. Ozier, N. S. Baliga, J. T. Wang, D. Ra-mage, N. Amin, B. Schwikowski, and T. Ideker. Cytoscape: a soft-ware environment for integrated models of biomolecular interaction networks.Genome research, 13(11):2498–2504, Nov. 2003.2,3
[38] J. G. Siek, L.-Q. Lee, and A. Lumsdaine. The Boost Graph Library: User Guide and Reference Manual. Addison-Wesley, 2002.3
[39] P. D. Stotts, M. Lindsey, and A. Antley. An Informal Formal Method for Systematic JUnit Test Case Generation. In D. Wells and L. A. Williams, editors,XP/Agile Universe, volume 2418 ofLecture Notes in Computer Science, pages 131–143. Springer, 2002.6
[40] Vismaster european fet-open coordination action project. http://www.vismaster.eu.10
[41] C. Weaver. Building highly-coordinated visualizations in improvise. InProceedings of the IEEE Symposium on Information Visualization, pages 159–166, Washington, DC, USA, 2004. IEEE Computer Soci-ety.1,2
![Figure 1: The Information Visualization Reference Model [24]](https://thumb-us.123doks.com/thumbv2/123dok_us/1590276.111760/3.612.63.277.65.121/figure-the-information-visualization-reference-model.webp)