North Sea herring (
Clupea harengus
L.) recruitment failure
may be indicative of poor feeding success
Susan Mærsk Lusseau
1*, Alejandro Gallego
1, Jens Rasmussen
1, Emma M. C. Hatfield
1, and Mike Heath
1,21Marine Scotland Science, Marine Laboratory, 375 Victoria Road, Aberdeen AB11 9DB, UK
2
Present address: Department of Mathematics and Statistics, University of Strathclyde, Livingstone Tower, 26 Richmond Street, Glasgow G1 1XH, UK
*Corresponding author: tel:+44 1224 876544; fax: 44 1225 295511; e-mail:s.lusseau@marlab.ac.uk
Lusseau, S. M., Gallego, A., Rasmussen, J., Hatfield, E. M. C., and Heath, M. North Sea herring (Clupea harengusL.) recruitment failure may be indicative of poor feeding success. – ICES Journal of Marine Science, doi:10.1093/icesjms/fsu070.
Received 30 June 2013; accepted 28 March 2014.
Recruitment of the 2002 – 2012 year classes to the North Sea herring stock has been below expectations given the spawning biomass, due to exceptionally low overwinter survival of larvae. Here, we investigate whether changes in survival of larvae in the northwestern North Sea could be attributed to changes in parasite prevalence or feeding conditions. We used a method that combined particle tracking models and survey data to estimate survival, and microscopic examination of gut contents of archived samples of larvae collected in February each year between 1995 and 2007 to investigate parasite prevalence and feeding. We deduced that we can use the incidence of tetraphyllidean parasites as an index of the cumulative feeding history of the larval population. We found that the prevalence of larvae of a tetraphyllidean cestode in the gut contents varied significantly between years and was positively correlated with feeding success. High feeding success, indicated by high prevalence of tetraphyllideans, influenced survival by offsetting the effect of a second parasite type, a digenean trematode. We suggest that variability in cumulative food intake over the lifespan up to February is a significant determinant of variability in survival.
Keywords:feeding success, fish larvae, North Sea herring, overwintering, parasites, recruitment, survival.
Introduction
The North Sea herring stock has experienced a sustained and unpre-cedented period of low productivity since 2002 (Payneet al., 2009). Although the spawning-stock biomass has been consistently high and well above the level where impaired recruitment is expected to set in, the number of recruits produced per spawner continues to be at the lowest levels recorded (ICES, 2013).
In the northwestern North Sea, herring spawn along the east coast of Scotland and around the Orkney and Shetland Islands, with spawning commencing in the north around August – September and progressing south into the early winter (Heath and Richardson, 1989). The larvae develop over winter and metamorph-ose in early spring the following year. During this period, the devel-oping larvae are fully planktonic and disperse with the prevailing currents to a potential North Sea-wide distribution. It is over this period that the strength of the recruiting year-class in North Sea herring is determined (Nash and Dickey-Collas, 2005;Payneet al., 2009).
The International Council for the Exploration of the Seas (ICES) coordinates two surveys of North Sea herring larvae. The first one is carried out in autumn and produces an index of abundance of newly hatched larvae on the spawning grounds. The second survey is
carried out towards the end of winter and measures abundance of the late stage larvae that have survived winter development period. Despite a consistently high larval production measured in autumn surveys, the abundance of late stage larvae just before meta-morphosis is at an all-time low (ICES, 2013). The poor recruitment, it is concluded, is linked to increased mortality rates during this overwinter larval development period (Payneet al., 2009;Fa¨ssler et al., 2011). The causes of the increased mortality remain under in-vestigation and several explanatory hypotheses have been proposed (ICES, 2007).
Corten (2013)argued that cannibalism by adult herring could explain the change in survival.Hufnagl and Peck (2011)used a physiological individual-based model of the foraging and growth of herring larvae to demonstrate a possible link with temperature and prey composition and concentrations, with the timing around first feeding being particularly sensitive. Increased temperatures, particularly in the northern North Sea, were also linked to increased mortality rates in the northern components of herring larvae by
Fa¨ssleret al.(2011).Payneet al.(2009)andICES (2007)suggested a link between the poor herring larvae survival and changes in the North Sea physical and biological environment.Edwards et al. (2007)documented a shift in the North Sea plankton community
#Crown copyright 2014.
ICES Journal of
Marine Science
ICES Journal of Marine Science; doi:10.1093/icesjms/fsu070
at University of Strathclyde on August 6, 2014
http://icesjms.oxfordjournals.org/
towards a more diverse warmer-water community around 2000, just before the onset of the period of poor herring recruitment (Payne et al., 2009). A similar regime shift in the North Sea in the late 1980s has been linked to reduced survival of larvae of Atlantic cod (Gadus morhuaL.) in the North Sea through changes in the avail-ability and suitavail-ability of prey (Beaugrandet al., 2003). The increased temperature in the North Sea has also been linked to changes in the distribution of many fish species, with the potential for increased predation on herring larvae (Payne et al., 2009). Coincidences between changes in herring larvae survival and, for example, shifts in the zooplankton community composition or changes in the tem-perature regime experienced only provide clues about the processes that may be involved in the decline in recruitment. Both of these factors have the potential to affect survival rates of fish larvae either directly or indirectly by affecting growth rates (Leggett and DeBlois, 1994,Houde 2002). Such a link between the growth rates of herring larvae in the North Sea and their survival was recently demonstrated byPayneet al.(2013). However, without direct evi-dence of a change in diet composition or food intake, it is not clear exactly how or whether these changes in the plankton commu-nity might have been involved in the changes in recruitment.
Heath and Nicoll (1991)investigated the relationship between helminth parasite infection and feeding incidence in herring larvae from the 1987 year class in the North Sea. They found signifi-cantly lower feeding incidence in herring larvae infected with larvae of tetraphyllidean cestodes (Scolex pleuronectes) and suggested that the survival of herring larvae could be impacted as a consequence. However, the year class they investigated did not suffer from low sur-vival and they suggested that population level effects could possibly be observed at very high prevalence.
The potential for parasites to act as major regulators of animal populations has been well described (May, 1983;Minchella and Scott, 1991). They can affect their host organism in many ways, in-cluding altering their behaviour (Lafferty and Morris, 1996) and competing with them for nutrients. Additionally, their presence and activities can lead to physical damage to the host (Rosenthal, 1967;Ivanchenko and Grozdilova, 1985). All these effects can lead to lower survival through decreased growth rates, severe physical damage, or by exposing the host to increased predation risk.
Herring larvae are infected with tetraphyllidean cestode larvae through the ingestion of infected copepods (Rosenthal, 1967;
Marcogliese, 1995). The adult cestodes are generally restricted to elasmobranch fish and herring larvae are only one of many inter-mediate hosts for this parasite (Marcogliese, 1995). Both Heath and Nicoll (1991)andRosenthal (1967)reported an increase in the intensity of parasite infection with increasing size of herring larvae indicating that the infection accumulates over time.
Rosenthal (1967)did not observe any obvious detrimental effects on the herring larvae at relatively low intensities of infection in an aquarium experiment, but did notice that one herring larvae with a heavy infection (8 parasites) was impeded in its swimming ability. Parasites such as tetraphyllidean cestode larvae, which are acquired through the diet and are relatively benign, accumulate in host populations and individuals and can therefore provide an index of cumulative feeding history (Campbellet al., 1980;Williams et al., 1992). High prevalence of infection is acquired, therefore, either through a generally higher intake of food in high prevalence years or a proportionally higher intake of infected prey.
Digenean trematodes are also commonly found in herring larvae (Brachyphallus crenatus,Ivanchenko and Grozdilova, 1985; Lecithaster gibbosus,Tolonen and Karlsbakk, 2003;Hemiurussp.,
Karlsbakk et al., 2003 and Heath and Nicoll, 1991, Derogenes varicus,Karlsbakket al., 2003). The primary host of digeneans is a mollusc from which free swimming cercaria are released to infect intermediate hosts, typically calanoid or harpacticoid copepods (Køie, 1979,1989,1990,1992), which are the main prey of herring larvae (Checkley, 1982; Cohen and Lough, 1983; Munk, 1992). Some digenean trematodes such as D. varicus grow and feed inside herring larvae but do not typically reach maturity in this host, whereas others such asHemiurussp. can grow to maturity and reproduce in herring larvae (K. Mackenzie, unpublished data).Heath and Nicoll (1991)rarely found an intensity of digen-eans exceeding one and observed no increase with the length of larvae and therefore no accumulation of parasites over time. Their conclusion was that herring larvae were only exposed to the infective stages of the digeneans for a brief period. However, a similar pattern would be observed if the accumulation of parasites in the herring larvae was detrimental and larvae with heavier infection were removed from the population. Such a scenario is supported by
Ivanchenko and Grozdilova (1985). They reported detrimental effects on White Sea herring larvae from the digenean trematodes L. gibbosus andB. crenatus. The parasites damaged the mucous membranes of the herring intestines, causing embolisms which ul-timately inhibited the passage of food, resulting in cessation of feeding and death.
Given the different patterns of infection and pathogenicity of tet-raphyllidean cestode and digenean trematodes in larval herring, it is likely that their incidence provides different information on the feeding ecology of the host. Digeneans would be expected to have a negative effect on feeding success and therefore potentially on sur-vival. In contrast, tetraphyllidean cestode larvae should have less direct impacts on survival and instead provide insights into feeding condi-tions experienced over the lifespan of the herring larvae.
The aim of this study was to investigate some of the mechanisms related to food consumption by which survival of herring larvae may have changed over 12 years, spanning periods of both good and poor recruitment. Key to our approach was the fact that larvae feeding in the wild coincidentally acquire gastroenteric parasites. The different behaviours and pathogenicity of parasite species means that their incidence can potentially be used to infer patterns of food intake and survival. If helminth parasite infection plays a role in the recent poor recruitment of North Sea herring, through a reduction in feeding incidence as suggested inHeath and Nicoll (1991), we would expect to see a difference in the pattern of parasite infection between years of high and low overwinter survival of herring larvae.
Material and methods
Selection of herring larvae specimens
Since 1977, late stage herring larvae in the North Sea have been sur-veyed as part of the ICES coordinated International Bottom Trawl Survey (IBTS,ICES, 2006). The synoptic survey is carried out by research vessels from participating institutes during late January and February, and measures abundance of herring larvae using a 2 m ringnet, the Methot– Isaacs – Kidd net (ICES, 2006). This com-ponent of the IBTS survey is commonly referred to as the MIK survey in reference to the net used.
Archived specimens of formaldehyde preserved herring larvae caught during the Marine Scotland Science (MSS) contributions to the ICES MIK surveys in February were available to this investi-gation. The samples were collected in the northwestern North Sea (Figure 1) and provided an opportunity to investigate stomach
at University of Strathclyde on August 6, 2014
http://icesjms.oxfordjournals.org/
contents and infection with intestinal parasites over a succession of years with varying levels of overwinter survival. We chose to focus our study on herring larvae collected during the period 1995– 2007 (1994 – 2006 year classes) to cover both the most recent period of poor survival (2002 – 2007) and a period before this with “normal” survival in the North Sea as a whole (1995 – 2001,Payne et al., 2009).
The key feature of our study was the analysis of diet composition and gastroenteric parasite incidence between different years. However, parasite infection and feeding by herring larvae has been shown to vary geographically and with body size (Heath et al., 1989;Heath and Nicoll, 1991;Munk, 1992; Busch, 1996). Hence, to avoid confounding our results with these factors, it was necessary to restrict our analysis to larvae from a standardized geographical area and size range.
A geographical subset of the available samples was defined such that in every year, there were.100 specimens of larvae available for ana-lysis from a common set of ICES statistical rectangles. The area within which these samples were collected was referred to as the “study area”. Within this geographical subset, the abundance in 1 mm length classes was extracted from the MIK survey database for the Scottish component and the median and quantiles calculated for each year. We selected a common length interval for examination that was contained within the 5th and 95th quantiles in every year and spanned the median of the length distribution for the majority of years.
[image:3.612.69.545.252.699.2]The formaldehyde-preserved specimens of larvae from the geo-graphical subset were rinsed thoroughly in water and measured to the nearest millimetre. Only larvae within the chosen length range were subsequently dissected. The entire digestive tract was removed under a dissecting microscope with needles and placed in a drop of a
Figure 1. Location of study area in the northwestern North Sea off north-eastern Scotland and position of all hauls taken during the MSS component of the MIK survey in January – February between 1995 and 2007. Bubble radius is proportional to the number of larvae caught in each haul with the largest size corresponding to 510 larvae.
at University of Strathclyde on August 6, 2014
http://icesjms.oxfordjournals.org/
mixture of water and glycerine (50/50 mixture) for easier handling. Only digestive tracts that were found to still be intact after extraction were examined further.
Prey items and parasites were extracted, identified, and measured as they were encountered. All parasites were photographed and identification of type specimens was confirmed by an independent expert (K. MacKenzie, University of Aberdeen, pers. comm.).
Herring larvae survival
Two internationally coordinated surveys provide global indices of abundance of herring larvae in the North Sea both before and after the winter period.
[image:4.612.72.545.215.677.2]The ICES International Herring Larvae Survey (IHLS) is carried out in autumn (September– October) and winter (December – January) each year and samples larvae with a fine-mesh plankton net (250mm mesh) at predetermined stations covering the main spawning areas: Orkney-Shetland, Buchan, Central North Sea, and Downs (Figure2,Heath, 1993). The herring larvae caught in each haul are counted and measured to the nearest millimetre below, and the data are processed to estimate the abundance (number m22) of newly hatched larvae (,10 mm length) for each ICES statistical rectangle (18longitude×0.58latitude). For each of the four sampling units (Figure2), a larval abundance index (LAI) is calculated by summing the larval abundances for all
Figure 2. Locations of North Sea herring spawning distribution in autumn (August to September in Orkney-Shetland, Buchan, and Central North Sea) and winter (December – January in Downs) determined from catches of yolk-sac herring larvae, ripe fish, and haddock with herring eggs in the stomach (Based onHeath and Richardson, 1989). In the particle simulations, particles were released from all areas marked in black corresponding to known autumn spawning locations. Grey rectangles shows the delineation of North Sea herring spawning components as defined in the International Herring Larvae Survey. No particles were released within the Downs component area.
at University of Strathclyde on August 6, 2014
http://icesjms.oxfordjournals.org/
rectangles contained in the unit. Difficulties in interpreting this time-series due to missing observations, high sampling noise, and differences in the spawning intensity between surveys (ICES, 2013)have led to the development of the spawning component abundance index (SCAI, Payne, 2010). The SCAI is a statistical model designed to analyse the LAI’s from the IHLS and provides an index of abundance of newly hatched larvae for each of these spawning components. The SCAI has been shown to be robust to the challenges posed by the LAI time-series and the index has been used in the assessment of North Sea herring since 2012 (ICES, 2013).
Over the winter period, the developing herring larvae disperse with the prevailing currents to a potential North Sea-wide distribu-tion. In the late winter, a second survey of these surviving herring larvae is carried out. This is the MIK survey mentioned above and it covers the whole of the North Sea during late January and February. The abundance index resulting from this survey—the IBTS0 index—is expressed as total abundance of late stage herring larvae in the North Sea and is used as a recruitment index in the assessment of North Sea herring (ICES, 2013).
These two surveys cover the entirety of the known distribution of both newly hatched and late stage larvae of North Sea herring. Abundance of late stage larvae in late winter at any point in the North Sea is a function of larval production in spawning areas in autumn, dispersal of the larvae, and mortality during the interven-ing period. The proportional relationship between the SCAI for all spawning components and the IBTS0 index therefore provides an index of survival of herring larvae over the winter period on a North Sea-wide scale. We calculated a North Sea-wide survival index for the study period (1995 – 2007) as a straight ratio between the sum of SCAI for all four spawning components (fromPayne, 2013) and the IBTS0 index (fromICES, 2013, Table 2.3.3.1).
Local survival index
The North Sea-wide survival index however does not automatically apply to our local study area. Because the study area covered only a fraction of the total distribution of both early and late stage larvae, and because distribution of early and late larvae is not uniform throughout the North Sea (ICES, 2008), it was necessary to calculate a local index of survival that took account of dispersal patterns.
The dispersal of larvae was accounted for using a particle tracking model to estimate the proportional contribution of the different spawning components to the abundance of larvae in the study area in February. The SCAI for each of these individual spawning components provided the magnitude of larval production in these spawning areas and it was then possible to calculate an index of expected abundance in the study area in February if no mortality was experienced along the advection paths. The actual abundance of larvae in the study area in February was calculated from the MIK survey hauls from the study area for each year. The proportion-al relationship between the observed actuproportion-al and the modelled expected abundance was taken as an index of survival. The index was not considered to be an absolute estimate of the mortality rate each year, but was used to compare relative local survival among years.
The Buchan spawning area was not surveyed in 1994 and 1995 and the level of uncertainty for the Buchan component of SCAI for these 2 years is almost double of that for the remaining series as a consequence (Payne, 2010). We felt unjustified to use these modelled values without any underlying observations for those 2 years in the Buchan component SCAI. It was thus not possible
to estimate the survival of herring larvae in the study area for 1994 and 1995.
Particle tracking
The particle tracking model was based on methods described by
Heath and Gallego (1998). The basis of the model was that year-specific daily horizontal flowfields were produced by the SNAC model (Logemannet al., 2004), forced with atmospheric pressure data extracted from the ECMWF Operational Analysis dataset (ECMWF 2006 – 2008). The horizontal resolution of the model was 0.1258latitude by 0.2508longitude, which corresponds to a distance of 13.9 km in latitude and13.5 – 15.5 km in longitude over the domain of interest. The model was run for the period mid-September (day 258, or 15 September) to the end of February (168 days duration) in each of the start-years 1994 – 2006. Particles were released from all “wet” (i.e. water depth.0 m) start positions on a 5×5 km grid covering all the known autumn spawning areas of herring identified in Heath and Richardson (1989) in both the North Sea and to the west of Scotland (Figure2). No particles were released in the Downs area as the timing (December/January) and the location of spawning of this component makes it unlikely that larvae with this origin should be present in our study area as demonstrated by hydrographic modelling inDickey-Collaset al.(2009).
Twenty-five particles were released from each start location, each of which had the potential to follow a unique trajectory due to the effects of horizontal diffusion which was parameterized as a stochastic process in the model. A total of 148 625 particles were released over all areas. Although 25 particles per release loca-tion was the maximum we could use within the constraints of our computing hardware, exploratory sensitivity analyses sug-gested that an adequate number of particles was n,50 (see
Gallego, 2011). In addition, we carried out a number of identical simulations (using 1994 flowfields) and estimated that, for that number of particles, the coefficient of variation resulting from stochastic processes was8%.
The tracking time-step was 1 h and particle positions were stored daily. All particles migrated with a sinusoidal diel vertical migration pattern between 5 and 45 m depth. The number and origin of par-ticles reaching the study area within the month of February were extracted from the dataset of daily tracks of all simulated particles (Figure 3). To account for differences in abundance of larvae between different years and spawning areas, particles were weighted with the year- and area-specific SCAI at their origin. Interannual dif-ferences in the (unweighted) number of particles reaching the target area were the result of interannual differences in transport patterns from each spawning area, while interannual differences in the (weighted) simulated larvae abundance index were the result of the combination of interannual differences in transport patterns from each spawning area and annual differences in their respective SCAI-derived weighting. The total number of expected arrivals could not be calculated for 1994 and 1995 due to the lack of surveying in the Buchan area as mentioned above.
Observed abundance of late stage larvae in February
An annual abundance index for late stage herring larvae in the study area was calculated based on samples of herring larvae taken within the limits of the study area during the ICES MIK survey in February, including only samples with the mean larval length of 20 mm or more. This follows the procedure used to produce the IBTS0 abun-dance index of late stage herring larvae for the North Sea, based on
at University of Strathclyde on August 6, 2014
http://icesjms.oxfordjournals.org/
these same surveys (ICES, 1996). The mean abundance per square metre was calculated for each sampled ICES rectangle within the study area and this number was raised by the “wet” surface area of the corresponding rectangle to obtain a total number of larvae per rectangle. The total number of larvae was summed over all rectangles surveyed and divided by the number of rectangles surveyed to obtain the mean number of larvae per surveyed ICES rectangle. The total number of larvae in the study area was obtained by multiplying the mean number of larvae per surveyed ICES rectangle with the number of ICES rectangles in the study area (n¼5).
Data analysis
Survival and parasites
We tested whether the survival of herring larvae was influenced by the prevalence of tetraphyllidean and digenean parasites by fitting a general linear model (lm function in R version 3.0.1) to the data with log-transformed survival modelled as a response and tetraphyl-lidean and digenean prevalence as independent variables. Survival
was log-transformed to satisfy the assumption of normality of resi-duals and diagnostics plots confirmed constant variance with the mean after transformation. The best fitting model was selected by comparing the Akaike information criteria corrected for sample size (AICc) and the adjustedR2-values for the models.
Feeding incidence
We tested the hypothesis that feeding incidence of herring larvae in the study area was similar for larvae with and without parasites. Feeding incidence was measured by the presence or absence of prey items in the herring larvae and larvae were characterized as having either no parasites, digenean trematodes, or tetraphyllidean cestode larvae present in the intestine. To take into account the anticipated effect of time of day of capture on feeding incidence, we included this parameter in the model as time-lag from sunset to capture time.
Given the sampling structure of this study and the patchy distri-bution of both larvae and prey in the environment, larvae captured
Figure 3. Results from particle tracking simulations for particles released on 15 September from known herring spawning grounds in the North Sea between 1994 and 2006. Example of two contrasting years (left: 1994 spawning; right: 1998 spawning) when particles recorded within our study area at any time during February originated from quite different source locations. Spawning grounds (particle release areas) are represented by grey shading on the maps. Black dots represent the origin of the particles that subsequently reached our study area (outlined in black).
at University of Strathclyde on August 6, 2014
http://icesjms.oxfordjournals.org/
in the same haul would potentially have been subject to more similar feeding conditions than larvae coming from different hauls. Larvae captured from the same haul were therefore considered pseudo-replicates of that haul. To account for this, we used a generalized linear mixed-effects model (binomial distribution, logit link func-tion, lme4 package in R version 3.0.1,Bateset al., 2013) with haul included as a random effect to assess how the parasite state of the larvae influenced the likelihood that the larvae had been feeding (GLMM-parasite).
The model was validated following the guidelines provided by
Bolkeret al.(2009).
Results
Study area and length ranges of larvae
When aggregated over all years in the period 1995 – 2007, the MSS component of MIK surveys in February showed that herring larvae were concentrated in the coastal strip (25 – 35 km wide) along the northeast of Scotland and in a band stretching eastwards across the North Sea between 56 and 578N. However, there was con-siderable interannual variability in this pattern, and when this was taken into account the area where larvae were most consistently caught was between 56 and 57.58N, between the coast and 18W (Figure 1). This area (the study area) defined the geographical subset of samples used in the project.
Within the study area, the length distribution of larvae in February varied between years (Figure 4), with larvae from the 2003 and 2004 year classes being particularly large, and those in 1997 and 2001 year classes being particularly small. These differ-ences imply differdiffer-ences in growth rate between years, or differdiffer-ences in age at capture, or a combination of the two. Differences in growth rate and age at capture could reflect variations in the hatching origin of larvae. A length interval of 24 – 28 mm met the criteria for
defining a subset of lengths to be examined for gut contents (i.e. spanned the median in all but 3 years and was contained within the 5th and 95th quantiles in all years).
Particle tracking and survival
The spatial distribution of particle releases was constant from year to year, reflecting the fixed locations of spawning grounds. However, the locations of release sites that produced particles which arrived in the study area off the east coast of Scotland in February varied from year to year, reflecting interannual variations in the transport patterns (Figure3). It is worth noting that all parti-cles that reached the target area in the month of February originated from the Orkney-Shetland and Buchan spawning areas (41 950 and 10 675 particles released yearly, respectively).
The total number of particles recorded in the study area during February showed marked differences between years (Figure5a). The year- and area-specific SCAI also varied among years and between the two areas contributing particles to the study area (Figure5b). Overall, the Orkney-Shetland spawning area contribu-ted the largest amount of simulacontribu-ted larvae to the study area in all years (79.5 – 99.0%) with a peak in contribution from the Buchan spawning area for the 2002 year class (Figure5c).
The expected total abundance of herring larvae in the study area based on these model results varied between years with a prominent peak in the 2002 year class (Figure6a). This variation could not be attributed solely to either of the two sources of variation examined with the particle drift simulation but was the result of both interann-ual differences in transport pattern and area- and year-specific dif-ferences in larval production.
The observed abundance in February in the study area, calculated from local survey data, also varied among years, with higher values in the early part of the study period and again in the last 2 year classes (Figure6a). The resulting clear variation in survival among years of herring larvae caught within the study area was adequate for inves-tigating the relation between survival and potential causal factors (Figure6b).
In contrast to the North Sea-wide survival, which was consistent-ly low for all year classes between 2002 and 2006 (Figure6b), the local survival index was more varied and shows increasing survival of the two latest year classes investigated. While numbers of herring larvae in the MIK surveys remained low for the North Sea as a whole, the proportion captured within the study area increased considerably in the last years included in this analysis, accounting for up to 28% of the total population in the North Sea (Figure7).
Herring larvae feeding and diet
We dissected a minimum of 30 herring larvae per year for the period 1995 – 2007 (1994 – 2006 year class), adding up to a total of 454 larvae for the study. Parasite and prey incidence was recorded for all 454 larvae dissected. For the majority of the larvae, a full analysis of gut content was also carried out. For 21 of the dissected larvae, only parasite and feeding incidence was noted (Table1).
[image:7.612.68.290.66.285.2]A total of 1641 prey items were identified from the dissected intestines (Table1). Over the entire study period, small calanoid copepods (31%), the cyclopoidOithonaspp. (38%), and copepod nauplii (12%) dominated the diet by numbers. This highlights the importance of small copepods in the diet of herring larvae in the study area. The calanoid copepods were almost entirely Paracalanus sp. (50%), Pseudocalanus sp. (21%), and Acartia sp. (8%).
Figure 4. Yearly length distribution of herring larvae caught in the study area on the MSS component of MIK surveys between 1995 and 2007 (year classes 1994 – 2006). Median length is represented by the short horizontal bars and the error bars extend from the 5th to the 95th quantile. The long horizontal bars at 24 and 28 mm represent the minimum and maximum length of larvae selected for use in this investigation.
at University of Strathclyde on August 6, 2014
http://icesjms.oxfordjournals.org/
Figure 5. (a) Number of particles representing herring larvae modelled to have arrived in study area during February after release on 15 September in the previous year in Orkney-Shetland and Buchan spawning areas. (b) Size of larval production in Orkney-Shetland and Buchan spawning areas given as SCAI. (c) Relative number of larvae expected to arrive in study area from Orkney-Shetland and Buchan spawning grounds as number of particles arriving weighted by size of larval production at the origin (SCAI). Proportional contribution of the Orkney-Shetland spawning area is also indicated. Year class refers to the year particles were released, i.e. when larvae hatched.
at University of Strathclyde on August 6, 2014
http://icesjms.oxfordjournals.org/
Prey items were observed in 117 (26%) of the guts examined. This proportion varied widely among years between 0 and 80%, resulting in very little or no data available for some years with
respect to food composition (Table1). Since herring larvae are visual predators and generally do not feed at night, the incidence of prey items in the guts was expected to decline with time after sunset. For some years, all samples in the study area were taken very late in the night and for these years, very few larvae had any prey items in them (1994 and 1997 year class in particular, Table1). The very small proportion of guts containing prey items in these years made it inappropriate to perform further detailed ana-lyses regarding changes in prey composition among years.
Parasites in herring larvae
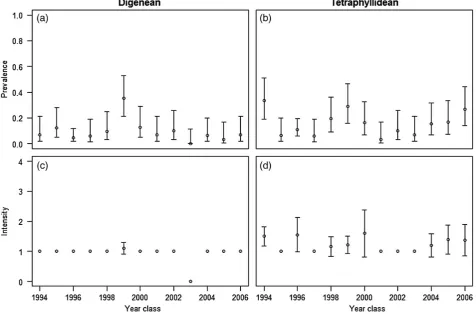
Two types of parasitic helminths were found in the intestines of the larval herring. One was a digenean trematode (D. varicus) and the other was larvae of tetraphyllidean cestodes otherwise known under the species complexScolex pleuronectis. The prevalence (pro-portion of larvae carrying parasites) of both parasite types showed marked variation among years ranging from 0 to 0.35 for digeneans and 0.03 to 0.33 for tetraphyllideans (Figure8). The mean preva-lence over the entire study period was higher for tetraphyllideans (0.15+0.05) than for digeneans (0.09+0.05). The intensity (number of parasites per larvae) of digeneans only ever exceeded one in the 1999 year class, whereas it was common to find several tetraphyllideans in a single herring larva, with three being the maximum observed (Figure8). The intensity of infection of tetra-phyllideans seemed to be higher in year classes with high prevalence. The two types of parasites were co-occurring in seven herring larvae (Table2). This was considered too few to justify inclusion as a cat-egory in the analysis, but since there was no information available as to the possible effects of the two parasite types being present sim-ultaneously in one larva, these were excluded from the subsequent analyses on the effects of parasites on herring larvae feeding and survival.
Survival and parasites
We tested the hypothesis that survival of herring larvae was influ-enced by the prevalence of tetraphyllidean and digenean parasites. A model including an effect of the interaction between the two para-site species in Table3was the best fitting model based on the AICc. This best fitting model indicated that digenean prevalence had a negative effect on survival and that there was a significant positive interaction between tetraphyllidean and digenean prevalence (Table4). The model provided a good fit to the data and explained 53% of the variation in survival (Table3). There was little support to keep the main effect of tetraphyllidean prevalence in the model (Table3). The fitted model met the assumptions for general linear models (Figure1, Supplementary data).
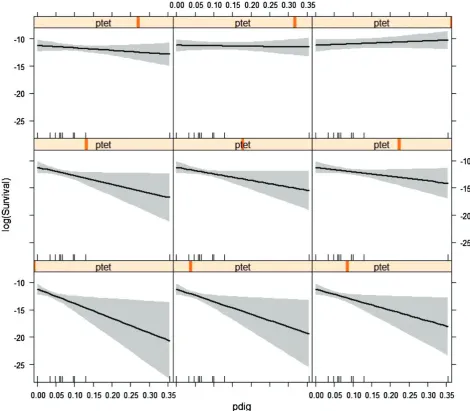
The significant interaction between the prevalence of the two parasites indicates that the effect of the digenean parasite on survival depends on the level of tetraphyllidean prevalence (Figure9). When the prevalence of tetraphyllideans was low, there was a strong nega-tive effect of digenean prevalence on survival, but with increasing prevalence of tetraphyllidean cestodes, this negative effect was elimi-nated and at higher levels of tetraphyllidean prevalence, there was no effect of prevalence of either parasite on survival (Figure9).
Feeding incidence
We also tested the hypothesis that feeding incidence of herring larvae in the study area was similar for larvae with and without parasites using a generalized linear mixed-effects modelling approach.
[image:9.612.64.293.69.299.2]With a ratio of residual deviance to residual degrees of freedom of 0.75 (x2¼332.5, d.f.¼442,p¼1), the model was not found to be
Figure 6. (a) Indices of expected abundance of herring larvae in study area (assuming no mortalities sustained during drift phase) based on particle tracking model (abundance×1013) and the actual observed abundance in study area calculated from the MIK survey data (abundance×108). (b) Indices of survival in the study area, calculated in this study, and the entire North Sea expressed as a ratio between the summed SCAI’s and the IBTS0.
Figure 7. Total abundance of herring larvae in North Sea, the IBTS0 index, and in study area during MIK surveys in the North Sea between 1995 and 2012 (1994 – 2011 year classes). Lower panel indicates proportion within study area.
at University of Strathclyde on August 6, 2014
http://icesjms.oxfordjournals.org/
[image:9.612.64.289.386.646.2]overdispersed. The residuals pattern was investigated using the “binnedplot” function in the “arm” package in R (Gelman and Su, 2013). The binned Pearson residuals showed no distinct pattern against the residual values.
[image:10.612.62.553.92.267.2]Once the random effect of haul had been accounted for, we found that feeding incidence did indeed significantly decrease with time from sunset (Table5and Figure10). In addition, parasite presence influenced feeding incidence and the direction in which likelihood
[image:10.612.68.545.303.617.2]Figure 8. Prevalence and intensity of digeneans (a and c) and tetraphyllidean larvae (b and d) in herring larvae collected in the study area between 1995 and 2007 (year classes 1994 – 2006). Prevalence in this figure refers to the proportion of individuals investigated that are infected, and intensity meaning the average number of parasites encountered in infected individuals. Error bars represent 95% confidence intervals. The 95% confidence intervals for prevalence were calculated using Wilson’s score method without correction for continuity (Newcombe, 1998).
Table 1. Analysis and feeding information (four top rows), and number of prey items by year and type found in herring larvae captured between 1995 and 2007 (1994 – 2006 year classes).
1995 1996 1997 1998 1999 2000 2001 2002 2003 2004 2005 2006 2007 Total
Larvae dissected 30 32 83 34 31 31 31 30 30 30 32 30 30 454
Larvae with prey 0 15 17 1 9 8 9 10 5 12 2 5 24 117
Feeding incidence (%) 0 47 20 3 29 26 29 33 17 40 6 17 80 26
Larvae with full prey identification 0 15 17 1 9 8 9 10 2 11 1 5 8 96
Calanoid copepods 77 78 0 5 8 47 54 11 60 5 102 62 509
Cyclopoid copepods 106 105 0 52 21 37 68 7 94 0 109 25 624
Harpacticoid copepods 0 0 0 0 0 0 1 0 0 0 0 0 1
Poecilostomatoid copepods 0 13 0 2 0 1 0 0 0 0 0 3 19
Copepod unspecified 1 3 0 3 1 2 10 0 7 0 15 9 51
Nauplii 58 40 0 41 0 5 9 1 34 0 0 4 192
Isopoda 0 0 0 1 0 0 0 1 0 0 0 0 2
Crustacean remains 1 0 0 2 0 0 2 0 0 0 0 1 6
Eggs 7 8 0 28 2 8 8 1 0 0 3 8 73
Molluscs 3 42 0 59 1 1 1 0 2 0 1 3 113
Unidentified prey 10 0 1 12 7 0 7 0 3 0 3 8 51
Grand total 263 289 1 205 40 101 160 21 200 5 233 123 1 641
at University of Strathclyde on August 6, 2014
http://icesjms.oxfordjournals.org/
of feeding was affected differed with the type of parasite (Table5). There was some indication that larvae infected with digenean trema-todes were less likely to have fed than non-parasitized larvae. In con-trast, there was strong support in the model that larvae carrying tetraphyllidean cestode larvae were more likely to have fed than non-parasitized larvae (Table5and Figure11). It is worth noting that we obtained similar results using a generalized linear model approach. However, the significance of these effects was less pronounced given that pseudo-replication was not accounted for. In addition, a GLMM (not presented), which did not account for the fixed effect of parasite (GLMM-NOparasite), was not supported by the data when contrasted with the model above (AICGLMM-parasite¼392.8, AICGLMM-NOparasite¼402.4).
Discussion
The availability of archived herring larvae from a succession of years with both high and low recruitment of North Sea herring provided an opportunity to investigate a potential relationship between feeding, infection with intestinal parasites, and overwinter survival of herring larvae. The use of a biophysical model to factor out the
direct effect of oceanographic transport variability allowed us to use early larval abundance survey data to account for interannual spawning variability and estimate reliable annual indices of survival for the relevant stocks.
A particle tracking modelling approach was used to identify the origin of the larvae sampled in the study area and to account for interannual transport variability. This methodology is critically de-pendent on the suitability of the underlying hydrodynamic model. SNAC (Logemannet al., 2004) is a statistical representation of HAMSOM (Backhaus and Hainbucher, 1987) that has been used comprehensively for similar applications in the general domain of interest [e.g. seeGallego (2011)and references therein]. As a com-parative exercise, we carried out a similar set of particle tracking simulations using a different hydrodynamic model (POLCOMS;
Holt and James, 1999), though for a shorter time-series available to us (1994 – 2003). The new simulations (not presented here) resulted in the same origin of all larvae sampled in our study (Orkney-Shetland and Buchan) and a similar pattern of years with high and low transport success, although there were some dif-ferences in their relative magnitude and POLCOMS-based simula-tions resulted in a consistently higher (3 times) number of particles reaching the target area. However, the latter would in effect act as a scaling factor which should not affect the statistical outcome of our analyses, which was the same for the common time-series. Therefore, we felt justified to use the SNAC-based simulations over the full series when survey and hydrodynamic model data were available to us (1994/1995 – 2006/2007).
[image:11.612.58.555.93.256.2]The modelling approach also made a number of simplifying assumptions in the way herring biology was represented (for model
Table 3. Candidate linear models describing the relationship between survival of herring larvae and prevalence of two helminth parasites in the northwestern North Sea, 1995 – 2007.
Model Model parameters F-statistic p-value AICc AdjustedR2
1 log(survival)ptet F1,9¼3.04 0.12 35.30 0.17
2 log(survival)pdig F1,9¼1.20 0.30 37.13 0.02
3 log(survival)ptet+pdig F2,8¼1.36 0.31 37.28 0.07
4 log(survival)pdig×ptet F3,7¼3.92 0.06 31.66 0.47
5 log(survival)pdig+pdig : ptet F2,8¼6.59 0.02 29.79 0.53
[image:11.612.58.552.306.371.2]Survival was log-transformed to satisfy the assumption of normality and diagnostic plots confirmed constant variance with the mean after transformation. (pdig and ptet refer to the prevalence of tetraphyllidean and digenean parasites, respectively).
Table 2. Annual summaries of parasite prevalence in herring larvae collected in the study area between 1995 and 2007 (1994 – 2006 year classes).
Year class Larvae sampled
Number infected Prevalence
Joint occurrence Tetraphyllideans Digeneans Tetraphyllideans Digeneans
1994 30 10 2 0.33 0.07 1
1995 32 2 4 0.06 0.13 0
1996 83 9 4 0.11 0.05 0
1997 34 2 2 0.06 0.06 0
1998 31 6 3 0.19 0.10 1
1999 31 9 11 0.29 0.35 2
2000 31 5 4 0.16 0.13 2
2001 30 1 2 0.03 0.07 0
2002 30 3 3 0.10 0.10 1
2003 30 2 0 0.07 0.00 0
2004 32 5 2 0.16 0.06 0
2005 30 5 1 0.17 0.03 0
2006 30 8 2 0.27 0.07 0
Table 4. Estimates, standard errors of the mean (s.e.), and significance of parameters of best fitting model inTable 3(pdig and ptet refers to the prevalence of tetraphyllidean and digenean parasites, respectively).
Parameter Coefficient s.e. t-value p-value
pdig 230.52 10.886 22.80 0.02
pdig: ptet 114.51 35.013 3.27 0.01
at University of Strathclyde on August 6, 2014
http://icesjms.oxfordjournals.org/
[image:11.612.59.298.462.495.2]sensitivity analyses, seeGallego, 2011). One important assumption was the selected particles release date (representing hatching date). Herring spawning time varies between spawning stocks and, even
[image:12.612.70.541.67.478.2]within a given spawning stock, there is some interannual variability (Heath, 1993). However, in the absence of detailed multi-annual spatially and temporally resolved information on timing of spawn-ing, it was unfeasible to incorporate spawning time variability into our model. Consequently, we selected a single larval hatch date (15 September) as a single particles release date from all spawning locations. For all areas that could contribute larvae to our study area, based on widely accepted oceanographic transport patterns, the west coast of Scotland herring stock spawns predominantly from August to October (Rankine, 1986), while spawning in the Orkney-Shetland area is from the end of August through September and in Buchan in September– October (Heath, 1993). In the years considered in our study, the larval surveys covering the Orkney-Shetland and Buchan areas were carried out in the second half of September. The particles release date of 15 September, therefore, allowed us to use the survey data as a weighting factor for spawning in our analysis. The average growth rates required for those larvae to reach the selected size interval of 24 – 28 mm in the month of
Figure 9. Interaction plot of the effect of prevalence of digenean (pdig) and tetraphyllidean (ptet) parasites on survival of larval herring in the northwestern North Sea. The plot shows the effect of digenean prevalence on log-transformed survival at different levels of tetraphyllidean prevalence.
Table 5. Contrasts summary estimates, standard errors of the mean (s.e.), and significance of parameters from the generalized linear mixed-effects model (prey presentstate+sunset+(1|haul), see text) describing the relationship between presence of two types of parasites on the likelihood of feeding in larval herring taking into account time of capture (hours after sunset) and haul effects.
Parameter Estimate s.e. Z-value p-value State (no parasite) 0.41 0.458 0.89 0.37 State (digenean) 21.30 0.647 22.02 0.04 State (tetraphyllidean) 1.12 0.403 2.78 0.006 Hours after sunset 20.45 0.0962 24.70 ,0.0001
The estimated variance for the random effect (haul) was 1.715 (44 hauls, 447 larvae), AIC¼392.8.
at University of Strathclyde on August 6, 2014
http://icesjms.oxfordjournals.org/
[image:12.612.61.302.604.658.2]February are 0.13 – 0.15 mm d21, which are well within the range reported in the literature (Loughet al., 1982;Gambleet al., 1985;
Geffen, 1986). The selection of a fixed length interval for all years may have introduced additional variability into our analysis, as this common range may have resulted in the selection of slower or faster growing components of the population, from year to year. However, the selected range was contained within the 5th and 95th quantiles every year and spanned the median of the length
distribution for most years, thus minimizing this potential short-coming. Additionally, selecting a variable length interval between years would have introduced additional ontogenetic diet variability effects.
At the basis of our investigation was the hypothesis that herring larval overwintering survival could be regulated by parasite infec-tion. The two types of parasites, tetraphyllidean cestode larvae and digenean trematodes, which were identified from herring larvae di-gestive tracts, have previously been reported from herring larvae in the Northeast Atlantic and the North Sea (Rosenthal, 1967;Heath and Nicoll, 1991;Karlsbakket al., 2003;Tolonen and Karlsbakk, 2003). The prevalences and intensities we report are well within the range reported in these studies and the effects we describe here are therefore not the result of abnormally high or low levels of para-site prevalence or intensity. Our analyses indicate an interaction at the population level between the effects of the two parasites; the dif-ferent way that these two types of parasites affect herring larvae may provide the explanation. Herring larvae survival is impacted by di-genean parasites through the physical damage to individual larvae, affecting their ability to feed (Ivanchenko and Grozdilova, 1985). However, in years of good cumulative feeding conditions, as indi-cated by high prevalence of the relatively benign tetraphyllidean cestode larvae, the negative impact of the digeneans is offset by better survival of herring larvae overall. This scenario is further sup-ported by the differences found in feeding incidence between the three categories of larvae. There was some indication that larvae with digeneans had lower feeding incidence than non-parasitized larvae, in agreement with the parasites causing physical damage inhibiting feeding. The larvae with tetraphyllidean cestodes, on the other hand, had significantly higher feeding incidence. Rather than being a direct consequence of the presence of the parasite, it is likely to simply reflect the better feeding conditions they have been subject to which in turn also caused the higher prevalence of tetraphyllideans.
In contrast to this study,Heath and Nicoll (1991)found lower feeding incidence in larvae infected with tetraphyllidean cestode larvae. However, they did not take into account in their analysis that feeding incidence might have been impacted by the time of day of capture of the larvae. We found a significant negative relation-ship between feeding incidence and the elapsed time between sunset and capture. This relationship is commonly described for herring larvae that are visual predators and rely on some level of light for ef-fective prey capture (e.g.Cohen and Lough, 1983) and should be taken into account whenever feeding incidence is being used to measure feeding success (Llopiz, 2013). Similarly, gut evacuation at capture has the potential to influence feeding success estimates in herring larvae (Hay, 1981). In this study, we used simple presence/ absence data to infer feeding incidence rather than number of prey items or stomach fullness, an index that is only sensitive to total evacuation of the gut during capture. In line withHeath and Nicoll (1991), we consider it unlikely that there is a difference in the incidence of full evacuation of stomachs between parasitized and non-parasitized larvae that could have biased our results.
[image:13.612.64.290.66.282.2]Differences among years in tetraphyllidean and digenean preva-lence in the herring larvae could simply reflect differences in the availability of infectious parasites in the zooplankton. If this is the case, there seems to be a link between factors influencing parasite availability, particularly tetraphyllideans, and herring larvae sur-vival. The differences in circulation pattern and consequently trans-port patterns among years could be one such factor. A detailed investigation of the potential mechanisms causing such a link is
Figure 11. Predicted partial effects plot from the generalized mixed-effects model (prey presentstate+sunset+(1|haul), see text) showing the difference in likelihood of feeding between non-parasitized larvae and larvae carrying digeneans and
[image:13.612.64.291.354.565.2]tetraphyllideans. Vertical error bars represent 95% confidence intervals. Figure 10. Predicted partial effect from the generalized linear mixed effects model (prey presentstate+sunset+(1|haul), see text) showing the significant negative effect of time-lag from sunset to capture time (time from sunset) on likelihood of feeding.
at University of Strathclyde on August 6, 2014
http://icesjms.oxfordjournals.org/
beyond the scope of this paper, but could possibly further illuminate factors affecting the survival of herring larvae in the North Sea.
Although we did investigate diet of late stage herring larvae, the very low sample sizes and the paucity of data on diet for several of the years in our study period mean that the conclusions that could be drawn regarding the interannual differences in the importance of different prey is speculative at best. However, it is worth noting that in general, the food items that were abundant in stomachs in this study such asParacalanussp., Pseudocalanussp.,Oithonasp., and other small calanoid copepods have also previously been recorded as important food items for herring larvae in the North Atlantic (Schnack, 1972; Checkley, 1982; Cohen and Lough, 1983). In any case, the information on stomach contents collected from our samples provides only a snapshot in time of the diet and food consumption of the herring larvae immediately before sam-pling. However, larvae survival from hatching is a product of the integrated diet and consumption over many months. In this study, we have used data on benign parasites acquired through feeding to make inference regarding feeding of herring larvae over a much longer time-scale. The main diet items reported in this study are also the zooplankton groups that have been linked to the transfer of the parasites found in the herring larvae (Køie, 1979;
Marcogliese, 1995), further supporting that these parasites are indi-cators of cumulative food intake.
Although our results support overwintering as a critical period for the survival of larval herring, it is not possible to test whether this corresponds to the onset of exogenous feeding, as in Hjort’s “critical period” hypothesis (Hjort, 1914), or some other time during that stage. The exact time at which larvae are most affected is still unknown, since by analysing larvae collected in February, we are only considering the survivors. Herring larvae are susceptible to infection with both parasite types once they exceed15 mm in length (Rosenthal, 1967;Heath and Nicoll, 1991). This means that the larvae we investigated started accumulating parasites well before even reaching the study area. The next step to further unravel the exact link between feeding and survival should be to con-sider temporal differences in zooplankton composition over the lifespan of larvae as well as spatial differences along the advection route of the larvae. Furthermore, as diet of herring larvae changes as they grow (Checkley, 1982; Cohen and Lough, 1983; Munk, 1992), consideration should be given to changes in prey preference over the larval lifespan and therefore along the advection route.
The increased survival in our study area towards the end of the study period is in contrast to the continued low North Sea-wide survival (ICES, 2007; Payne et al., 2009). The proportionally higher contribution from the study area to the total abundance of late stage larvae in the North Sea for this later period indicates that the differences in herring larvae survival are real and not just an artefact of the particle tracking approach or the indices used to estimate larval production. This discrepancy between temporal changes in survival locally and North Sea-wide makes it difficult to extrapolate the findings from our study area to a North Sea-wide scenario. While our results indicate that the improvement in the study area could be due to improved food intake, this does not necessarily imply that, conversely, the continued low sur-vival in the wider North Sea is due to poor feeding conditions. However, a recent study by Payne et al. (2013) demonstrated lower growth rates in herring larvae in the central North Sea in years of poor (North Sea wide) survival, further supporting the link between survival and feeding conditions. A more detailed ana-lysis of transport patterns of herring larvae and concurrent spatial
variation in appropriate prey organisms and parasites could further clarify these potential links.
It is not necessarily surprising that the local survival differs from the North Sea-wide survival. The North Sea-wide survival estimate is integrated over a large and environmentally diverse area, and regional differences should be expected.Fa¨ssleret al.(2011) pro-vided strong evidence of highly increased mortality in herring larvae, particularly from the Northern spawning components coinciding with the drop in overall North Sea-wide survival. As these are also the spawning components considered in this study, the two observations appear contradictory. However,Fa¨ssleret al. (2011)looked at mortalities in the very young larvae (,30 days). Therefore, the two studies are not directly comparable and our conclusions, at the temporal resolution of our study, are not in-compatible with finer scale temporal variability in survival patterns. Estimating survival from successive surveys of larvae is particu-larly difficult due to factors such as year-to-year differences in the sampling coverage. The SCAI model approach compensates for var-iations in timing and spatial coverage in the derivation of North Sea-wide abundance indices (Payne, 2010). However, timing and distribution of spawning has not been investigated recently, but it is assumed that the areas and times surveyed still represent the areas and times of peak larval production (ICES, 2008). The cover-age of the Buchan and Orkney-Shetland spawning areas has aver-aged over 80% of the survey stations over the period of this study (coverage data provided by Dr Jo¨rn Schmidt, IFM-Geomar, Germany). The only time that coverage has fallen significantly below this level was in 1996 in Orkney-Shetland, where only 49% of the stations were covered and consequently the survival index for 1996 could be either over- or underestimated.
A correlation between changes in the North Sea plankton com-munity around 2000 and the reduction in North Sea-wide survival of herring larvae has been identified by other authors (Payneet al., 2009). However, this observation by itself does not offer any explan-ation of how or why survival may have changed in terms of the mechanisms involved.
In this study, we provide evidence that winter survival of herring larvae in a coastal strip off the Northeast of Scotland is detectably influenced by interannual variations in cumulative food intake, as indicated by the incidence of a benign parasite acquired with the natural diet. In addition, there are suggestions of an additive detri-mental effect due to digenean trematode parasites when feeding conditions are poor.
Supplementary data
Supplementary material is available at theICESJMSonline version of the manuscript.
Acknowledgements
We are grateful for funding to the Marine Laboratory from the pelagic sector of the Scottish fishing industry, managed by Seafish that enabled this work to be carried out. The contributing organiza-tions were: Scottish Pelagic Fishermen’s Association, Scottish Fishermen’s Federation, Shetland Fish Producers Organisation, Herring Buyers Association, Shetland Catch Ltd, and the Scottish Government Marine Directorate and Seafish. The computer simu-lations were carried out at the RINH/BioSS, University of Aberdeen, Beowulf linux cluster. We are very grateful to Dr Tony Travis, RINH, who made this facility available to us. Dr Ken Mackenzie provided advice on identification of parasites and on parasite ecology in general. Dr David Lusseau gave invaluable statistical help and
at University of Strathclyde on August 6, 2014
http://icesjms.oxfordjournals.org/
advice. Dr Jo¨rn Schmidt, IFM-Geomar, and Dr Norbert Rohlf at TI, Hamburg, kindly provided information and data regarding the International Herring Larvae Surveys (IHLS). We are grateful for help with zooplankton identification from Dr Steve Hay and John Fraser. Comments and suggestions from Joel Llopiz and two other anonymous reviewers were appreciated and helped improve the manuscript.
References
Backhaus, J. O., and Hainbucher, D. 1987. A finite-difference general circulation model for shelf seas and its application to low fre-quency variability on the North European Shelf. In Three-Dimensional Models of Marine and Estuarine Dynamics, pp. 221 – 244. Ed. by J. C. J. Nihoul, and B. M. Jamart. Elsevier Oceanography Series, 45.
Bates, D., Maechler, M., Bolker, B., and Walker, S. 2013. lme4: Linear Mixed-effects Models using Eigen and S4. R package version 1.0–4. http://CRAN.R-project.org/package=lme4.
Beaugrand, G., Brander, K. M., Lindley, J. A., Souissi, S., and Reid, P. C. 2003. Plankton effects on cod recruitment in the North Sea. Nature, 426: 661 – 664.
Bolker, B. M., Brooks, M. E., Clark, C. J., Geange, S. W., Poulsen, J. R., Stevens, M. H. H., and White, J. S. 2009. Generalized linear mixed models: a practical guide for ecology and evolution. Trends in Ecology and Evolution, 24: 127 – 135.
Busch, A. 1996. Transition from endogenous to exogenous nutrition: larval size parameters determining the start of external feeding and size of prey ingested by Ruegen spring herringClupea harengus. Marine Ecology Progress Series, 130: 39 – 46.
Campbell, R. A., Haedrich, R. L., and Munroe, T. A. 1980. Parasitism and ecological relationships among deep-sea benthic fishes. Marine Biology, 57: 301 – 313.
Checkley, D. M., Jr. 1982. Selective feeding by Atlantic herring(Clupea harengus)larvae on zooplankton in natural assemblages. Marine Ecology Progress Series, 9: 245 –253.
Cohen, R. E., and Lough, R. G. 1983. Prey field of larval herringClupea harenguson a continental shelf spawning area. Marine Ecology Progress Series, 10: 211 – 222.
Corten, A. 2013. Recruitment depressions in North Sea herring. ICES Journal of Marine Science, 70: 1 – 15.
Dickey-Collas, M., Bolle, L. J., van Beek, J. K., and Erftemeijer, P. L. 2009. Variability in transport of fish eggs and larvae. II. Effects of hydro-dynamics on the transport of Downs herring larvae. Marine Ecology Progress Series, 390: 183 – 194.
Edwards, M., Johns, D. G., Licandro, P., John, A. W. G., and Stevens, D. P. 2007. Ecological status report: results from the CPR survey 2005/2006. SAHFOS Technical Report, 4: 1 – 8.
European Centre for Medium-Range Weather Forecasts (ECMWF). 2006 – 2008. Operational analysis data. British Atmospheric Data Centre.http://badc.nerc.ac.uk/data/ecmwf-op/.
Fa¨ssler, S. M., Payne, M. R., Brunel, T., and Dickey-Collas, M. 2011. Does larval mortality influence population dynamics? An analysis of North Sea herring (Clupea harengus) time series. Fisheries Oceanography, 20: 530 –543.
Gallego, A. 2011. Bio-physical models: an evolving tool in marine ecological research.InModelling Complex Ecological Dynamics, pp. 279 – 290. Ed. by F. Jopp, H. Reuter, and B. Breckling. Springer, Heidelberg, Germany. 413 pp.
Gamble, J. C., MacLachlan, P., and Seaton, D. D. 1985. Comparative growth and development of autumn and spring spawned Atlantic herring larvae reared in large enclosed ecosystems. Marine Ecology Progress Series, 26: 19 – 33.
Geffen, A. J. 1986. The growth of herring larvae,Clupea harengusL., in the Clyde: an assessment of the suitability of otolith ageing methods. Journal of Fish Biology, 28: 279 – 288.
Gelman, A., and Su, Y. 2013. arm: Data Analysis Using Regression and Multilevel/Hierarchical Models. R package version 1.6 – 10.http://
CRAN.R-project.org/package=arm.
Hay, D. E. 1981. Effects of capture and fixation on gut contents and body size of Pacific herring larvae. Rapport et Proce`s-Verbaux des Re´unions du Conseil Permanent International pour L’Exploration de la Mer, 178: 395–400.
Heath, M. 1993. An evaluation and review of the ICES herring larval surveys in the North Sea and adjacent waters. Bulletin of Marine Science, 53: 795 – 817.
Heath, M. R., and Gallego, A. 1998. Bio-physical modelling of the early life stages of cod and haddock in the North Sea. Fisheries Oceanography, 7: 110 – 215.
Heath, M., Leaver, M., Matthews, A., and Nicoll, N. 1989. Dispersion and feeding of larval herring (Clupea harengus L.) in the Moray Firth during September 1985. Estuarine, Coastal and Shelf Science, 28: 549 – 566.
Heath, M., and Nicoll, N. 1991. Infection of larval herring by helminth parasites in the North Sea and the effect on feeding incidence. Continental Shelf Research, 11: 1477 – 1489.
Heath, M., and Richardson, K. 1989. Comparative study of early-life survival variability of herringClupea harengus, in the north-eastern Atlantic.Journal of Fish Biology, 35: 49 –57.
Hjort, J. 1914. Fluctuations in the great fisheries of northern Europe viewed in the light of biological research. Rapport et Proce`s-Verbaux des Re´unions du Conseil Permanent International pour L’Exploration de la Mer, 20: 1 – 228.
Holt, J. T., and James, I. D. 1999. A simulation of the Southern North Sea in comparison with measurements from the North Sea Project. Part 1: Temperature. Continental Shelf Research, 19: 1087 – 1112. Houde, E. D. 2002. Mortality. In Fishery Science: the Unique
Contributions of Early Life Stages, pp. 64–87. Ed. by L. A. Fiuman, and R. G. Werner. Blackwell Science, Hoboken, NJ.
Hufnagl, M., and Peck, M. A. 2011. Physiological individual-based modelling of larval Atlantic herring (Clupea harengus) foraging and growth: insights on climate-driven life-history scheduling. ICES Journal of Marine Science, 68: 1170 – 1188.
ICES. 1996. Report of the Herring Assessment Working Group for the Area South of 628N. ICES CM 1996/ACFM: 10. 411 pp.
ICES. 2006. Manual for the International Bottom Trawl Surveys. Revision VII. Addendum to: Report of the International Bottom Trawl Survey Working Group (IBTSWG). ICES CM 2006/RCM: 03: 137 – 189.
ICES. 2007. Report of the Study Group on Recruitment Variability in North Sea Planktivorous Fish. ICES CM 2007/LRC: 07. 65 pp. ICES. 2008. Report on the Herring Assessment Working Group for the
Area South of 628N (HAWG). ICES CM 2008/ACOM: 02. 613 pp. ICES. 2013. Report on the Herring Assessment Working Group for the
Area South of 628N (HAWG). ICES CM 2013/ACOM: 06. 1283 pp. Ivanchenko, O. F., and Grozdilova, T. A. 1985. Infestation rate of the young of White Sea herring reared under experimental conditions and caught in the sea, by trematodes, and their pathogenic effect.
In Parasitology and Pathology of Marine Organisms of the World Ocean. Report, National Marine Fisheries Service, 25, 67 p. Karlsbakk, E., Skajaa, K., and Nylund, A. 2003. Parasites of cultured
herring (Clupea harengus)larvae fed natural zooplankton. Bulletin of the European Association of Fish Pathologists, 23: 25 – 34. Køie, M. 1979. On the morphology and life-history ofDerogenes varicus
(Mu¨ller, 1784) Looss, 1901 (Trematoda: Hemiuridae). Zeitschrifte fu¨r Parasitenkunde, 59: 67 – 78.
Køie, M. 1989. On the morphology and life history ofLecithaster gibbo-sus(Rudolphi, 1802) Liihe, 1901 (Digenea, Hemiuroidea). Parasitology Research, 75: 361–367.
Køie, M. 1990. On the morphology and life-history ofHemiurus luehei
Odhner, 1905 (Digenea: Hemiuridae). Journal of Helminthology, 64: 193 – 202.
at University of Strathclyde on August 6, 2014
http://icesjms.oxfordjournals.org/
Køie, M. 1992. Life cycle and structure of the fish digeneanBrachyphallus crenatus(Hemiuridae). Journal of Parasitology, 78: 338 – 343. Lafferty, K. D., and Morris, A. K. 1996. Altered behavior of parasitized
killifish increases susceptibility to predation by bird final hosts. Ecology, 77: 1390 – 1397.
Leggett, W. C., and Deblois, E. 1994. Recruitment in marine fishes: is it regulated by starvation and predation in the egg and larval stages? Netherlands Journal of Sea Research, 32: 119 – 134.
Llopiz, J. K. 2013. Latitudinal and taxonomic patterns in the feeding ecologies of fish larvae: a literature synthesis. Journal of Marine Systems, 109: 69 –77.
Logemann, K., Backhaus, J. O., and Harms, I. H. 2004. SNAC: a statis-tical emulator of the north-east Atlantic circulation. Ocean Modelling, 7: 97 –110.
Lough, R. G., Pennington, M., Bolz, G. R., and Rosenberg, A. A. 1982. Age and growth of larval Atlantic herring,Clupea harengusL., in the Gulf of Maine-Georges Bank region based on otolith growth increments. Fishery Bulletin, 80: 187 – 199.
Marcogliese, D. J. 1995. The role of zooplankton in the transmission of helminth parasites to fish. Reviews in Fish Biology and Fisheries, 5: 336 – 371.
May, R. M. 1983. Parasitic infections as regulators of animal popula-tions. American Scientist, 71: 36 – 45.
Minchella, D. J., and Scott, M. E. 1991. Parasitism: a cryptic determinant of animal community structure. Trends in Ecology and Evolution, 6: 250 – 253.
Munk, P. 1992. Foraging behaviour and prey size spectra of larval herring Clupea harengus. Marine Ecology Progress Series, 80: 149 – 158.
Nash, R. D. M., and Dickey-Collas, M. 2005. The influence of life history dynamics and environment on the determination of year class strength in North Sea herring (Clupea harengus L.). Fisheries Oceanography, 14: 279 –291.
Newcombe, R. G. 1998. Two-sided confidence intervals for the single proportion: comparison of seven methods. Statistics in Medicine, 17: 857 – 872.
Payne, M. R. 2010. Mind the gaps: a state-space model for analysing the dynamics of North Sea herring spawning components. ICES Journal of Marine Science, 67: 1939 –1947.
Payne, M. R. 2013. The North Sea autumn spawning Herring (Clupea harengus L.) Spawning Component Abundance Index (SCAI). doi:10.1594/PANGAEA.823680, Supplement to: Payne, M.R. 2010. Mind the gaps: a state-space model for analysing the dynamics of North Sea herring spawning components. ICES Journal of Marine Science, 67: 1939 – 1947.
Payne, M. R., Hatfield, E. M. C., Dickey-Collas, M., Falkenhaug, T., Gallego, A., Gro¨ger, J., Licandro, P.,et al.2009. Is a changing envir-onment making sustainable exploitation of North Sea herring more difficult? ICES Journal of Marine Science, 66: 272 – 277.
Payne, M. R., Ross, S. D., Clausen, L. W., Munk, P., Mosegaard, H., and Nash, R. D. 2013. Recruitment decline in North Sea herring is ac-companied by reduced larval growth rates. Marine Ecology Progress Series, 489: 197 – 211.
Rankine, P. W. 1986. Herring spawning grounds around the Scottish coast. ICES CM 1986/H: 15.
Rosenthal, H. 1967. Parasites in larvae of the herring (Clupea harengus
L.) fed with wild plankton. Marine Biology, 1: 10 – 15.
Schnack, D. 1972. Studies on the food ecology of herring larvae, [transl. from German by E. Parsons, No. 1942 of DAFS, Aberdeen]. Ber. dt. Wiss. Kommn Meeresforsch, 22: 273 – 343.
Tolonen, A., and Karlsbakk, E. 2003. Parasites of herring (Clupea haren-gus L.) larvae from a local Norwegian fjord stock. Sarsia, 88: 154 – 157.
Williams, H. H., MacKenzie, K., and McCarthy, A. M. 1992. Parasites as biological indicators of the population biology, migrations, diet, and phylogenetics of fish. Reviews in Fish Biology and Fisheries, 2: 144 – 176.
Handling editor: Claire Paris
at University of Strathclyde on August 6, 2014
http://icesjms.oxfordjournals.org/