System Usage Trends for Off-grid Renewable Energy Users
in Developing Communities
Peter Dauenhauer1, Henry Louie2
204 George St, Glasgow, Scotland, G1 1XW, UK +44(0)141 444 -7266
Introduction
With 1.3 billion people currently lacking access to electricity and a significant share of new rural access in the next 15 years expected to be off-grid (70% of total) [1], efforts to ensure the sustainability of these systems is paramount. Transferring technologies that exhibit both scalability and appropriateness for the context, or likewise, developing such technologies is key objective for engineers interested in energy for development.
Remote monitoring is one technology that can be deployed in tandem with off-grid renewable energy systems. Remote monitoring allows for near real-time monitoring and analysis of off-grid systems and provides several channels for improvement in sustainability of these projects including during operation and as a research tool. With the current portfolio of off-grid deployments, little empirical data are typically available for load estimation, load growth and analysis of consumer behavior resulting in heavier dependence on potentially imprecise assumptions. Generating data for analysis and research will reduce error in estimation during the project/system planning stage of project development.
Purpose
In this paper, we seek to demonstrate the value of captured data in improving understanding of how off-grid systems actually operate and how differences in uses impact that operation. The data set includes seven original and individual off-grid systems in Malawi and Kenya that were fitted with remote monitoring systems. All systems are solar-PV but represent a range of different use cases from primary schools, restaurants, small businesses and health centers.
1Department of Electronic and Electrical Engineering, University of Strathclyde, Glasgow, UK
Method
The Kenyan data are from three small businesses in the village of Ololailumtia. The businesses receive electricity at 50 Hz, 230VAC from a 2.1 kWp solar-PV microgrid installed by PowerGen [2], a private Kenyan company. Cumulative energy consumption is reported hourly and broadcast through the cellular network. Although several other businesses are connected to the microgrid, for concision, only three are considered: a restaurant, video hall and salon. The data set covers approximately one year, with the electrification of the first business (the salon) occurring on 12 March 2014, and the last business (the restaurant) on 4 June 2014. The data cover until 14 March 2015. Electricity was provided under a pay-as-you-go scheme, with prices ranging from approximately US$2/kWh to US$5/kWh, depending on the quantity of energy purchased. Undoubtedly, the price of electricity influenced the consumption patterns, although a deep analysis into that relationship is beyond the scope of this paper.
The Malawi data come from two separate public institutions: a primary school and a health center located in the remote region of Chikhwawa. The projects are installed as part of the MREAP program [3]. Each project consisted of multiple small solar PV systems that were not interconnected, but managed under one organization. Due to space restrictions, only four systems were selected for analysis. The data capture technique was equivalent to the Kenyan systems. For this data set, data is available for 13 months for the primary school (two systems) starting January 2014, 10 months for the health center Maternity Ward and 5 months for the Recovery Ward starting May 2014. The Malawian systems do not have a fee associated with a usage. After data cleaning, we analyze loading currents to compare hourly load profiles per system and calculate weekly consumption to determine trends over time. We split the analysis into two segments based on location: Malawi or Kenya. Two main parameters were compared between systems: daily load profiles and cumulative energy usage. Interpretation and analysis followed which is informed by anecdotal knowledge of the system usages.
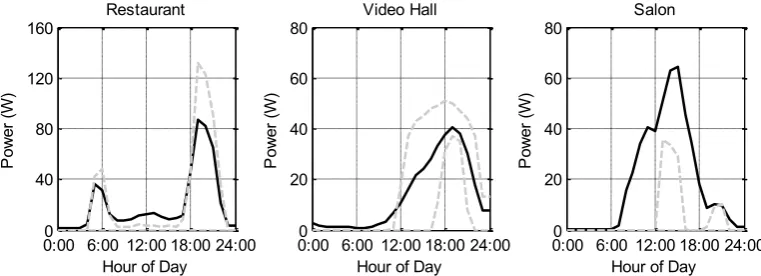
The load profile with 25% and 75% percentiles for the Kenyan businesses are provided in Figure 1. The overall consumption is low—between 13 and 21 W on average. Each business has a distinct profile. The restaurant load peaks during typical breakfast and dinner hours. Lunch-time load is notably muted. The video hall’s consumption generally occurs from 12:00 to 24:00. The salon uses electricity
throughout the day.
[image:3.595.103.484.382.520.2]The comparison of the mean to the quartiles provides insight into the symmetry or asymmetry of the power consumption for a given point in time. For example, the mean consumption of the salon is often greater than the 75% quartile. This indicates that there are outliers of large power consumption that occur. The mean consumption of the restaurant, on the other hand, generally lies between the 25% and 75% percentile. All businesses exhibit a very low load factor—ranging from 1 to 14 percent. It is clear that the businesses tend to limit consumption outside of business hours, with their base load dropping to zero or near-zero for many hours per day, usually overnight.
Figure 1. Daily load profile of the Kenyan businesses with the mean (solid black) and 25th and 75th percentiles (dashed gray) shown.
The weekly and cumulative energy consumption for the businesses are shown in Figure 2. After approximately one year after the connection of the first business, the three businesses in total consumed 410 kWh. However, the data show an accelerating trend of consumption.
0:00 6:00 12:00 18:00 24:000
40 80 120 160
Hour of Day
P
ow
er
(
W
)
Restaurant
0:00 6:00 12:00 18:00 24:000
20 40 60 80
Hour of Day
P
ow
er
(
W
)
Video Hall
0:00 6:00 12:00 18:00 24:000
20 40 60 80
Hour of Day
P
ow
er
(
W
)
Figure 2. Weekly and cumulative energy consumption of the Kenyan businesses.
The daily load profile with mean usage, 25% and 75% percentiles usage is shown for the systems in Malawi in Figure 3. As with the Kenyan systems, overall usage is quite low; peak average load at the primary school‘s classroom was only 12W and 7.8W at the staff room. The classroom profile has three distinct elements, a low morning usage, a buildup of load over the course of the day, and a moderate but decreasing night time load. Daytime usage in the classroom is typically zero, although occasional, relatively large loads are connected to the system. The load consists of mobile phones connecting to the system throughout the day and then removed by the early evening, an early evening television show often on the weekend around 19:00, night time studying held in the classroom (18:00 – 21:00), and a security light left on from 23:00-~5:30. The staff room’s profile in contrast has several peaks in daytime usage around 9:00, 16:00, and 19:00 which likely correspond to mobile phone charging and lighting (morning peak) and periodic usage of lighting near the end of the school day. It is interesting to note that unlike the Kenyan systems, load rarely drops entirely to zero for most of the Malawian systems. Several explanations are possible including a higher and more diverse set of loads on the system or different nature of loads associated with public institutions versus businesses. Another explanation is pricing. The Malawian systems do not pay a per unit or access fee for their electricity use and therefore may not have the incentive, as do the Kenyan systems, to reduce usage when not absolutely required.
0 5 10 15 20 25 30 35 40 45 50 55
0 2 4 6 8 10 12 14 16
Week
W
ee
kl
y
E
ne
rg
y
(k
W
h)
Restaurant Video Salon Salon
0 5 10 15 20 25 30 35 40 45 50 55
0 50 100 150 200 250 300 350 400 450
Week
C
um
ul
at
iv
e
E
ne
rg
y
(k
W
h)
Figure 3. Daily load profile of the Malawi consumers with the mean (solid black) and 25th and 75th percentiles (dashed gray) shown.
The profile at the two health center systems have a similar form with a relatively higher evening usage compared to daytime usage. By far the largest consumption is on the recovery ward with a peak mean load of 68 Watts at 20:00, whereas the daytime hovers around 15-20W. The profile is not surprising given the types of uses for the Maternity and Recovery systems, delivering babies and caring for mothers recovering from childbirth, respectively. It is interesting to note that the system sizing are identical with a total of 500Wp of installed solar PV capacity.
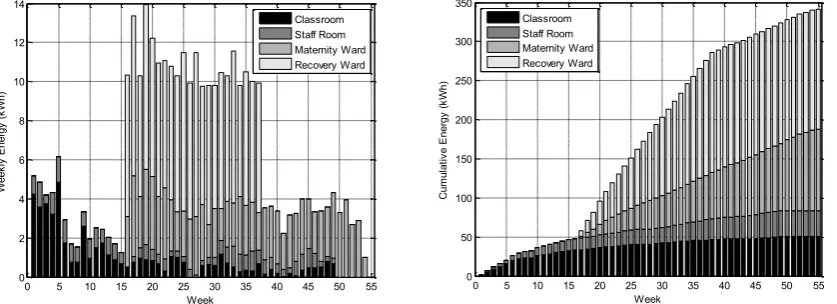
Figure 4. Weekly and cumulative energy consumption of the Malawi consumers.
Usage over time for Malawi systems remains fairly stable as shown in Figure 4. Overtime, there have been no significant increases in load, indeed the primary school classroom load has significantly dropped after the first 10 weeks from 2.61kWh/week to 0.62 kWh/week in the remaining weeks. This reduction is expected to be the result of change in user behavior following an operator directive. Users were connecting an
0:000 6:00 12:00 18:00 24:00 5
10 15 20
Hour of Day
P ow er ( W ) Classroom
0:000 6:00 12:00 18:00 24:00 5
10 15 20
Hour of Day
P ow er ( W ) Staff Room
0:000 6:00 12:00 18:00 24:00 10
20 30 40
Hour of Day
P ow er ( W ) Maternity Ward
0:000 6:00 12:00 18:00 24:00 25
50 75 100
Hour of Day
P ow er ( W ) Recovery Ward
0 5 10 15 20 25 30 35 40 45 50 55
0 2 4 6 8 10 12 14 Week W ee kl y E ne rg y (k W h) Classroom Staff Room Maternity Ward Recovery Ward
0 5 10 15 20 25 30 35 40 45 50 55
[image:5.595.89.508.447.599.2]amplifier to the system that was identified by the operator through the real-time system monitoring. A second trend is faintly visible at the school where load drops off at both the classroom and staff room around week 20, 31, and 45. The most likely explanation is this corresponds to breaks between the three school terms.
Conclusion
Despite persistence of sustainability challenges of off-grid renewable energy projects in developing countries, inclusion of remote monitoring technology in project design is not a common practice. As a result, little data see the light for future project designers to analyze, much less optimize performance while the project is still operating. This paper presented and analysis of an original data set combining technical performance data load consumption of seven systems (including restaurant, video hall, primary school, salon and health center) using prototype remote monitoring equipment. In particular, we compare different usage profiles and usage trends over the data set. In both locations, we find that energy use is on average quite low but have distinctive profiles depending on types of usage. Initial indication of trends of usage showed that some systems experienced load growth (Kenyan systems). The Malawian systems did not have any load growth over the monitoring period but experienced an interesting reduction of load corresponding to an operator directive. Further, a seasonal trend of usage based on the primary school schedule was identified.
References
1. IEA (2012), "World energy outlook 2012," IEA, Paris.
2. H. Louie, E. O’Grady, V. Van Acker, S. Szablya, N. P. Kumar, R. Podmore, “Rural Off-Grid Electricity Service in Sub-Saharan Africa,“ IEEE Electrification Magazine, vol. 3, no. 1, pp. 7-15 Mar. 2015.
3. Frame, D.F.; Dauenhauer, P.M.; Tembo, K.; Currie, C.; Ault, G.W., "An integrated approach to energy for development: Case study of the Malawi Renewable Energy Acceleration Programme," Global Humanitarian Technology Conference (GHTC), 2013 IEEE , vol., no., pp.72,77, 20-23 Oct. 2013
Acknowledgement