Kinematics Analysis Multimedia System for
Rehabilitation
Minxiang Ye1, Cheng Yang1,Vladimir Stankovic1, Lina Stankovic1 and Andrew Kerr2
1
Department of Electronic and Electrical Engineering, University of Strathclyde, Glasgow, UK
2 Biomedical Engineering Department, University of Strathclyde, Glasgow, UK
Abstract. Driven by recent advances in information and communica-tions technology, tele-rehabilitation services based on multimedia pro-cessing are emerging. Gait analysis is common for many rehabilitation programs, being, for example, periodically performed in the post-stroke recovery assessment. Since current optical diagnostic and patient assess-ment tools tend to be expensive and not portable, this paper proposes a novel marker-based tracking system using a single depth camera which provides a cost-effective solution that enables tele-rehabilitation services from home and local clinics. The proposed system can simultaneously generate motion patterns even within a complex background using the proposed geometric model-based algorithm and autonomously provide gait analysis results using a customised user-friendly application that facilitates seamless navigation through the captured scene and multi-view video data processing, designed using feedback from practitioners to maximise user experience. The locally processed rehabilitation data can be accessed by cross-platform mobile devices using cloud-based ser-vices enabling emerging tele-rehabilitation practices.
Keywords:multimedia signal processing, gait analysis, optical marker, multimedia content analysis
1
Introduction
The recent emergence of tele-rehabilitation services that aim to provide clin-ical rehabilitation diagnostics to patients in the comfort of their own home, calls for a radical shift in rehabilitation technology: from bulky, expensive equipment ideal for large rehabilitation facilities, to portable and affordable technology that can be operated in the home setting. The advances in information and commu-nications technology have been making this shift possible through novel, cheap, and compact communications and media processing tools, with a large devel-opment space in terms of user-friendliness and accuracy of diagnostics. Further-more, post-stroke rehabilitation with pleasant user experience would significantly benefit from tele-rehabilitation.
motion capture systems such as VICON [2]. These systems provide accurate walking patterns by tracking markers attached to relevant joints using multiple cameras, at the cost of high expense, operational expertise and large laboratory space.
To provide the service to patients who do not have access to these facilities, simple marker-based or markerless tracking systems using multiple or single RGB camera have been proposed. However, these systems have limitations, such as operational expertise and time-consuming processing [3], and requirement for specific colour of the underlying cloths, such as the single RGB camera systems of [4], [5], [1] and multiple RGB camera systems, such as [6]. An attractive alternative is to use Microsoft (MS) Kinect sensor [7] with its own SDK capable of tracking 25 skeleton joints. However, it is demonstrated in [8], [9], [10] that Kinect’s skeleton results are too noisy and not suitable for clinical applications. In this paper, we develop a novel application using a single depth camera (MS Kinect), combining the benefits of the 3D reconstruction ability of Kinect and high accuracy from VICON-like optical marker-based tracking. The pro-posed multimedia system provides a convenient solution for tracking multiple retro-reflective markers simultaneously, solving a geometric model-based iden-tification problem even within a complex background. Our proposed geometric model detector automatically locates all labelled markers and constructs the cor-responding digital models. We use a blob detector to detect all markers, introduce a novel algorithm to estimate the depth value in the center region of each marker to restore its 3D trajectory, which is in turn used to calculate the required 3D joint angles. In experiments, we adopt the cubic Bezier curve interpolation [11] for gap filling, calculate the joint angles, visualize movement patterns, analyze gait cycle and measure step and stride length, swing and stance phases.
Our designed multimedia application provides visualization for all raw and processed data autonomously and potentially provides an interactive multimedia communication service with mobile terminal devices via cloud servers. Result validation with VICON clearly shows the ability to reconstruct sagittal view gait cycles accurately.
2
Proposed System
2.1 Preparation
[image:3.612.306.482.222.362.2]Data acquisition is done by capturing infrared (IR) and depth image se-quences using MS Kinect v2 [7]. We adopt a depth-map projection method from [13] to map space coordinates of tracked markers to the camera space. To keep the region of interest on the IR map and remove background, we model offline the scene by a virtual trapezoidal cylindrical model shown in Fig.1 due to blob noise from reflective materials that introduce redundant high intensity pixels into IR images and blank holes into depth images.
Fig. 1.Virtual Scene. In Fig. 1, we define the central
point x for subject modeling whose distance Lto the Kinect sensor can be estimated by extracting the floor square corners (p1, p2, p3, p4 in Fig.1). The start and end points of a straight walking line and a valid scene region (solid line shown in Fig.1) can be estimated by a field of view angles βw = 70◦ and βh =
60◦ and a predefined reliable depth range [14]. In this way, our multime-dia application will present the
[image:3.612.138.289.403.569.2]ac-tual start and end points within the RGB stream using mapping functions from MS Kinect v2 SDK [7], which simplifies walking line calibration.
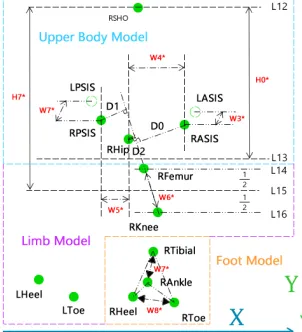
Fig. 2. Sagittal Model (Right Hand Side). 12 visible markers are marked with green circles. 2 partial invisible markers are shown in circle outlines.
Next, we split the defined sagittal subject model into three parts: upper body, limb and foot model. We locate and label all markers by validating their camera space coordinates along with axes X,Y, and measureH0∗,H7∗, andW4∗to W8∗as sagittal model parameters shown in Fig. 2.
2.2 Tracking
In this section, we introduce the pro-posed tracker for detecting and identify-ing the optical markers attached on the subject during the walking exercise, on a frame-by-frame basis using both IR and depth images.
and ellipse and minimum area rectangle fitter of [16] [17] to detect each blob’s centroid. (b) Remove redundant blobs (due to reflection phenomenon) by forming concentric cycles around each blob centroid. Let RM arker be the radius of the
marker in pixels, and Centre as blob centroid. Let C(Rn) be the pixel values
forming an imaginary circle centred atCentrewith radiusRn [in pixels], where
Rn = 1, . . . , RM arkerpixels. (c) Apply a histogram filter on allC(Rn) to obtain
the significant pixel values κn for each concentric cycle. Let κm be the mean
of κn for Marker m. Then, for Marker m find the smallest indexim such that κm
i
κm i+1
>2. (d) LetAm=P
j=1,imRj and obtain the marker detection threshold
T as the mean of allκm weighted by Am
PM l=1A
l where M is the total number of
visible markers in the floor square.
During marker detection, we apply the contour algorithm from [15] to lo-cate concentric contours Ω=ω0, ω1, ...for each blob in the binary image using threshold T. Let |Ω| be the number contours in the set Ω. Then, each marker centroid is located by:
Centroid=
F itEllipse(Ω) if|Ω|>5
F itM inRect(Ω) if|Ω| ∈(2,5) ω0+ω1
2 if|Ω|= 2 andF itDepth[Grow(Ω, δ)] = 1
ω0 if|Ω|= 1 andF itDepth[Grow(Ω, δ)] = 0
(1)
whereF itEllipseandF itM inRectuses the algorithm of [16], [17] to locate the
centroid given each blob’s contoursΩ. In order to deal with extreme cases that |Ω| < 3, we adopt functionGrow given by (2) to generate a new rectangular window by applying kernel incrementδon pixelsPi,jfrom contoursω0(andω1).
G=Grow(Pi,j, δ) =M ini,Pi,j∈Ω(Pi,j)−δ
| {z }
left
, M inj,Pi,j∈Ω(Pi,j)−δ
| {z }
top
,
M axi,Pi,j∈Ω(Pi,j) +δ
| {z }
right
, M axj,Pi,j∈Ω(Pi,j) +δ
| {z }
bottom
(2)
where δ is set to 3 and 2 for the case |Ω| = 2 and |Ω| = 1, respectively. Function F itDepth in (1) determines the validity of eachCentroid by scanning
a new windowGgrown by (2) as:
F itDepth=
1, forN > τ
0, forN=τ (3)
where we setτ= 0 andN as the number of pixels inGwhose corresponding depth value is in the Kinect’s reliable range of (500,4500] mm. As a result, we regard all blobs centred at Centroidas the final detected markers.
proposed clustering algorithm, reducing the noise from sensors as well as uncer-tain overlap conditions. We set the recovery radius δ= 3 for growing the high IR Pi,j region by Eq.2 and calculate the weight value as the significant mean
[image:5.612.136.345.171.390.2]relative distance between depth pixels to the centroid in each histogram bin.
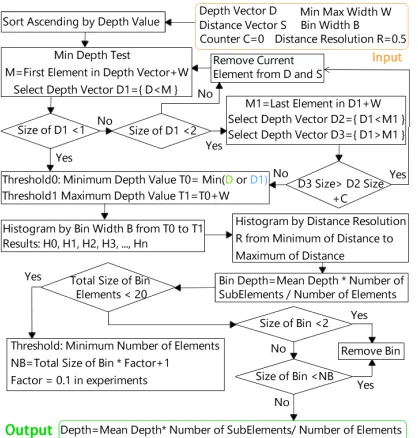
Fig. 3.Histogram Clustering Workflow.
In Fig. 3, we provide the flowchart of the proposed his-togram clustering algorithm applied on knee, ankle, heel, and toe markers. Two situa-tions are analyzed based on histogram bin width: (1) Bot-tom of the nearest pixels with occlusion (such as hip, fe-mur) - using T0 = M in(D), T1 = M ax(D1) and T0 = T0−W, whereD,W, andD1 are distances shown in Fig. 2. (2) Top of surrounding pixels (such as shoulder), in which case setT0=M in(D1).
We use the subject model defined in Sec. 2.1 to inspect all potential groups for upper body, limb and foot models (see Fig. 2). In particular, we order all markers between L12 and L13 by X-coordinate and validate the distances D0, D1, D2 for obtaining the most likely groups as the first look-up table. Then for the upper limb, we sort markers under L13 by Y-coordinate and X-coordinate and evaluate the nearest six markers to the ground by splitting them up into two groups with the triangular foot model shown in Fig. 2. Finally, we categorize the remaining left markers in the up-per limb region by Y-coordinates and solve foot position by examining relative position to the right knee marker and histories over time.
3
Visual Analysis
We design a user-friendly interface for kinematics reconstruction with an interactive multi-view scene manager. For testing, we adopt relative knee angle (based on hip, knee and ankle trajectories) and gait phases (detecting local extremum and inflection ranges) defined in [12] for kinematics analysis. The multi-view tracking snapshot of the software is shown in Fig. 4.
Fig. 4.Multi-view Tracker Snapshot
[image:6.612.138.278.396.608.2]dispatched to cloud servers. The designed multimedia system provides a plat-form service for online/offline analysis, interaction and rehabilitation. Therefore, users can easily share all authorized local measurements across platforms with provided high quality multimedia content analysis and visualization as local and remote interaction services for tele-rehabilitation.
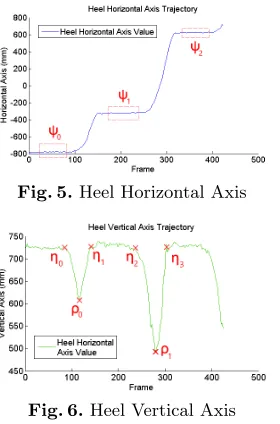
Fig. 5.Heel Horizontal Axis
Fig. 6.Heel Vertical Axis
For analyzing a gait cycle, we follow the gait phases definitions from [12] and adopt trajectories (100 fps) of heel, ankle, knee and hip markers to calculate step and stride length, stance and swing phases. The main task is to calculate vertical thigh segment an-gle, tibia segment anan-gle, and find inflection points and local peaks of heel markers’ hori-zontal and vertical axis values shown in Figs. 5 and 6.
The task of measuring step and stride length can be simplified into examining the stable valuesψ0,ψ1,ψ2using window match-ing for the region between inflection points in Fig. 5. Once the left and right heels horizon-tal stable values are found, the step and stride length can be calculated using the adjacent stable values over time.
4
Experimental Results & Discussion
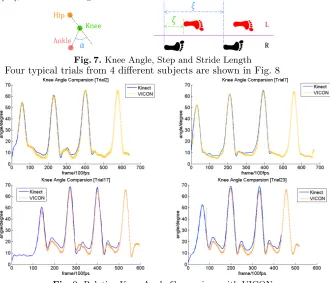
[image:7.612.145.475.165.448.2]We tested the system using 40 independent trials for 5 subjects by measuring knee angle α, step length ζ, stride length ξ, stance and swing phases defined in [12], as shown in Fig. 7.
Fig. 7.Knee Angle, Step and Stride Length Four typical trials from 4 different subjects are shown in Fig. 8
Fig. 8.Relative Knee Angle Comparison with VICON
It is obvious that our sagittal plane knee angle results have high accuracy benchmarked to the state-of-the-art industrial standard VICON. Furthermore, we closely followed the definitions of each gait event [12], and manually selected the key frames from the recorded IR and depth sequences as gait cycle references. Then we validated the step and stride lengths, and stance and swing phases with manually measured values that are based on [12]. The mean percentage error and standard derivation of the error [in percentage] on 40 sets of results are listed in Table 1.
Table 1. Performance of the proposed method for measuring step and stride length, and stance and swing phases
Error Step Stride Stance Swing
Mean(%) 1.05 1.17 1.82 1.10
Std(%) 5.33 4.76 5.83 4.37
5
Conclusion
It is more attractive than typical optical motion capture systems since it is portable and cheaper for clinic and home use. As a convenient indoors kine-matics diagnosis system, it only uses single MS Kinect v2 and needs low oper-ational expertise within a user-friendly application. Validation results indicate good agreement for the sagittal plane gait analysis benchmarked with the com-mercial industry standard VICON.
References
1. Yang, C., Ugbolue, U., Carse, B., Stankovic, V., Stankovic, L., Rowe, P.: Multiple marker tracking in a single-camera system for gait analysis. In: ICIP IEEE Int. Conf. Image Processing. pp. 3128–3131. IEEE (Oct 2013)
2. VICON: Gait Analysis (2015), http://www.vicon.com
3. Ugbolue, U.C., et al.: The evaluation of an inexpensive, 2d, video based gait as-sessment system for clinical use. Gait & Posture 38, 483–489 (July 2013)
4. Leu, A., Ristic-Durrant, D., Graser, A.: A robust markerless vision-based hu-man gait analysis system. In: Applied Computational Intelligence and Informatics (SACI), 2011 6th IEEE International Symposium on. pp. 415–420 (May 2011) 5. Liao, T.Y., Miaou, S.G., Li, Y.R.: A vision-based walking posture analysis system
without markers. In: Signal Processing Systems (ICSPS), 2010 2nd International Conference on. vol. 3, pp. V3–254–V3–258 (July 2010)
6. Li, Y.R., Miaou, S.G., Hung, C., Sese, J.: A gait analysis system using two cam-eras with orthogonal view. In: Multimedia Technology (ICMT), 2011 International Conference on. pp. 2841–2844 (July 2011)
7. Kinect for Window software development kit (May 2015), http://www.microsoft.com/en-us/kinectforwindowsdev
8. kook Jun, S., Zhou, X., Ramsey, D.K., Krovi, V.N.: A com-parative study of human motion capture and analysis tools, http://citeseerx.ist.psu.edu/viewdoc/summary?doi=10.1.1.391.73
9. Nguyen, H., Meunier, J.: Gait Analysis from Video: Camcorders vs. Kinect, Lec-ture Notes in Computer Science, vol. 8815, book section 8, pp. 66–73. Springer International Publishing (2014)
10. Clark, R., Vernon, S., Mentiplay, B., Miller, K., McGinley, J., Pua, Y., Paterson, K., Bower, K.: Instrumenting gait assessment using the kinect in people living with stroke: reliability and association with balance tests. Journal of NeuroEngineering and Rehabilitation 12(1), 15 (2015)
11. Agosto, M.K.: Bezier curves. In: Computer Graphics and Geometric Modelling: Implementation & Algorithms. pp. 396–404 (2005)
12. D.Casey Kerrigan, M.S., N.Wen, M.: Gait analysis. In: Rehabilitation Medicine: Principles and Practice. pp. 167–174 (1998)
13. Lachat, E., Macher, H., Mittet, M.A., Landes, T., Grussenmeyer, P.: First experi-ences with kinect v2 sensor for close range 3d modelling. ISPRS - Int. Archives of the Photogr., Remote Sens. Spatial Inform.Sciences XL-5/W4, 93–100 (2015) 14. Kinect for Windows features: Kinect sensor key features and benefits (May 2015),
https://www.microsoft.com/en-us/kinectforwindows/meetkinect/features.aspx 15. Suzuki, S., be, K.: Topological structural analysis of digitized binary images by
border following. Comp. Vision, Graphics, and Image Proc. 30(1), 32 – 46 (1985) 16. Fitzgibbon, A.W., Fisher, R.B.: A buyer’s guide to conic fitting. In: Proc. of the 6th
British Conf. Machine Vision (Vol. 2). pp. 513–522. BMVC, BMVA Press (1995) 17. Toussaint, G.: Solving geometric problems with the rotating calipers. In: IEEE