On the Effect of the Atmosphere on the Evaporation of Sessile
Droplets of Water
K. Sefiane1, S. K. Wilson2∗, S. David1, G. J. Dunn2, and B. R. Duffy2
1School of Engineering, The University of Edinburgh,
The King’s Buildings, Mayfield Road, Edinburgh EH9 3JL, United Kingdom
2Department of Mathematics, University of Strathclyde,
Livingstone Tower, 26 Richmond Street, Glasgow G1 1XH, United Kingdom
(Dated: 6th November 2008, revised 3rd March and 3rd April 2009)
Abstract
An experimental and theoretical study into the effect of the atmosphere on the evaporation of
pinned sessile droplets of water is described. The experimental work investigated the evaporation
rates of sessile droplets in atmospheres of three different ambient gases (namely, helium, nitrogen
and carbon dioxide) at reduced pressure (from 40 to 1000 mbar) using four different substrates
(namely, aluminium, titanium, Macor and PTFE) with a wide range of thermal conductivities.
Reducing the atmospheric pressure increases the diffusion coefficient of water vapour in the
atmo-sphere and hence increases the evaporation rate. Changing the ambient gas also alters the diffusion
coefficient and hence also affects the evaporation rate. A mathematical model that takes into
ac-count the effect of the atmospheric pressure and the nature of the ambient gas on the diffusion of
water vapour in the atmosphere and the thermal conductivity of the substrate is developed, and
its predictions are found to be in encouraging agreement with the experimental results.
∗ Author for correspondence. Email: s.k.wilson@strath.ac.uk, Telephone: + 44 (0) 141 548 3820, Fax:
I. INTRODUCTION
When liquid droplets are deposited on a solid substrate in an unsaturated atmosphere they will experience some degree of evaporation. This apparently simple phenomenon is encountered in everyday life as well as in a wide range of physical and biological processes, and was studied more than a century ago by Maxwell1 and Langmuir2. However, over the last decade renewed interest in the subject has been sparked by new developments in appli-cations such as cooling technologies, desalination, painting, DNA synthesis and patterning technologies. Unlike in the case of aerosol droplets, in the case of sessile droplets three phases co-exist: solid (substrate), liquid (droplet) and gas (atmosphere). A full understanding of the physics and controlling mechanisms for evaporating sessile droplets thus requires a thor-ough analysis of the heat and mass transfer across the interfaces as well as the interaction between the three phases.
Extensive studies of the evaporation of sessile droplets have been undertaken to elucidate the underlying mechanisms, notably those by Picknett and Bexon3 and Bourges-Monnier and Shanahan4. While there are situations in which the contact line of the droplet moves throughout the evaporation process (for example, Poulard et al.5 studied the evaporation of droplets of completely wetting liquids with receding contact lines), typically it is found that on real (i.e. rough) surfaces the contact line remains pinned for much of the lifetime of the droplet. Deegan6 investigated the evaporation of pinned droplets and the formation of the so-called “ring stain” or “coffee stain” that can occur. The standard theoretical model used by Picknett and Bexon3, Deegan6, Hu and Larson7 and Popov8 and several others (hereafter referred to as the “basic model”) assumes that the rate-limiting mechanism for evaporation is the diffusive relaxation of the locally saturated vapour at the free surface of the droplet to its far-field value (which occurs on a timescale of 10−4 s over 100µm for water
vapour in air; see, for example, Poulard et al.9) and not the much faster transfer rate of molecules across the interface itself (which occurs on a timescale of 10−10s; see, for example,
al.11 compared the evaporation of small pendant (i.e. hanging) and sessile droplets of water and found the results to be identical, raising questions about the role of buoyancy. The basic model predicts that the evaporation is integrably singular at the contact line and that the overall evaporation rate is proportional to the perimeter of the base of the droplet, in agreement with experimental studies such as that by Birdi et al.12. However, the basic model decouples the concentration of vapour in the atmosphere from the temperature of the droplet and the substrate, and hence does not account for the effect of the thermal properties of the droplet and the substrate on the evaporation rate. Indeed, it is fair to say that until recently the role of the thermal properties of the substrate has been more or less overlooked: different investigators have conducted experiments on different substrates to reach general conclusions without fully taking into account the influence of the thermal properties of the substrate. However, recently David et al.13 carried out an experimental investigation of evaporating droplets of various liquids on a variety of substrates with different thermal properties. David et al.13showed that the evaporation rate of such droplets varies significantly with the thermal conductivity of the substrate. Dunn et al.14,15 developed a mathematical model for the evaporation of a droplet on a substrate taking into account the temperature dependence of the saturation concentration of vapour at the free surface of the droplet, and found that its predictions are in excellent quantitative agreement with the experimental results of David et al.13.
The theory describing diffusion in binary gas mixtures is well developed. Solving the Boltzmann equation, Reid et al.16 derived the following theoretical expression for the diffu-sion coefficient in a binary gas system:
DAB= 3 16
(4πKT /MAB)1/2 nπσ2
ABΩD
fD, (1)
which, with the ideal gas law, may be rewritten as DAB =
0.00266T3/2 P MAB1/2σ2
ABΩD
fD, (2)
Another important effect related to the phase-change process is evaporative cooling. Ward and Duan17 investigated the cooling induced during the evaporation of water in an atmo-sphere of water vapour at reduced pressure. Substantial cooling of the liquid interface was reported and the temperature drop was found to increase with increasing evaporation rates. The objective of the present work is to investigate the effect of the atmosphere on the evaporation of pinned sessile droplets of water. The results are presented for droplets in atmospheres of three different ambient gases (namely, helium, nitrogen and carbon dioxide) at reduced pressure using four different substrates (namely, aluminium, titanium, Macor and PTFE) with a wide range of thermal conductivities. A mathematical model that takes into account the effect of the atmosphere and the substrate is developed, and its predictions are found to be in encouraging agreement with the experimental results.
II. EXPERIMENTAL SET UP AND PROCEDURE
The essence of the experiment consisted of depositing a liquid droplet of controlled volume on a substrate and allowing it to evaporate spontaneously. All of the experiments reported here were realised with droplets of pure deionised water resting on four different substrates chosen for their wide range of thermal conductivities, namely aluminium (Al), titanium (Ti), Macor and PTFE. The substrates had dimensions of 10 mm × 10 mm × 1 mm (length ×
width×thickness), and the thermal conductivities of the substrates used in the experiments are given in Table I.
Two instruments were used to characterise the surface properties of substrates. These two instruments are complementary as they characterise the surface at two different scales: a NewView 100TM from ZYGO Corporation which uses scanning white light interferometry (SWLI), and an MFP-1DTM Atomic Force Microscope (AFM) from Asylum Research which uses contact force microscopy (CFM). All of the substrates were found to be relatively rough, and the contact lines of the droplets were found to be pinned during the first stage of the evaporation process.
Substrate Al Ti Macor PTFE
Thermal Conductivity (W m−1 K−1) 237 21.9 1.46 0.25
TABLE I: The thermal conductivities of the substrates used in the experiments, ks, taken from
David et al.13.
Ambient Gas He N2 CO2
Diffusion Coefficient (m2 s−1) 8.26×10⁻⁵ 2.47×10⁻⁵ 1.45×10⁻⁵
TABLE II: The reference values of the diffusion coefficients of water vapour into the ambient gases
used in the experiment, Dref, at pressure 1 atm and temperature 295 K, obtained from Reid et
al.16.
coefficients of the ambient gases used in the experiments are given in Table II.
In order to quantify the amount of evaporative cooling of a droplet relative to the atmo-spheric temperature, the bulk temperature inside the droplet was measured with a miniature thermocouple which was inserted into the droplet near its apex along the vertical axis, as shown in Figure 5. The thermocouple was 100 µm in size, and, as Figure 5 shows, the perturbation to the droplet due to the thermocouple was minimal.
III. MATHEMATICAL MODEL
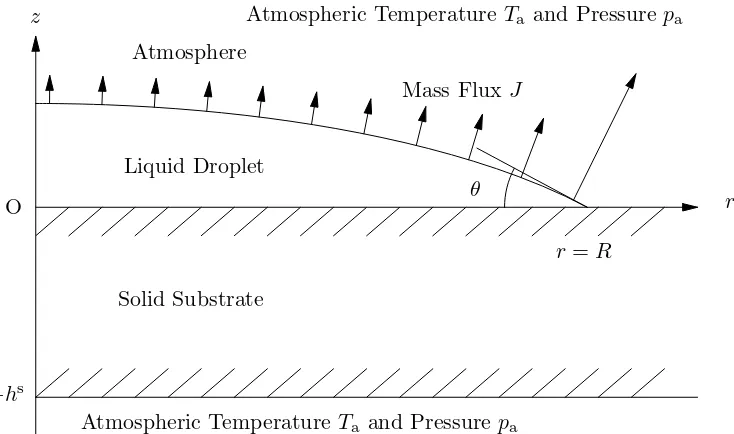
The mathematical model used in the present work represents the quasi-steady diffusion-limited evaporation of a pinned axisymmetric droplet of Newtonian fluid with constant viscosity, density ρ, surface tension γ, and thermal conductivity k resting on a horizontal substrate of constant thickness hs with constant thermal conductivityks. Referred to cylin-drical polar coordinates (r, θ, z) with origin on the substrate at the centre of the droplet with the z axis vertically upwards, the shape of the free surface of the droplet at time t is denoted by z =h(r, t), the upper surface of the substrate by z = 0, and the lower surface of the substrate by z =−hs, as shown in Figure 6.
For a sufficiently small droplet18, the droplet shape can be approximated as a simple quasi-steady spherical cap,
h = r
R2 sin2θ −r
2− R
tanθ, (3)
and hence the relation between the volumeV =V(t) and the contact angleθ=θ(t) is given by
V = πhm(3R 2+h2
m)
6 , (4)
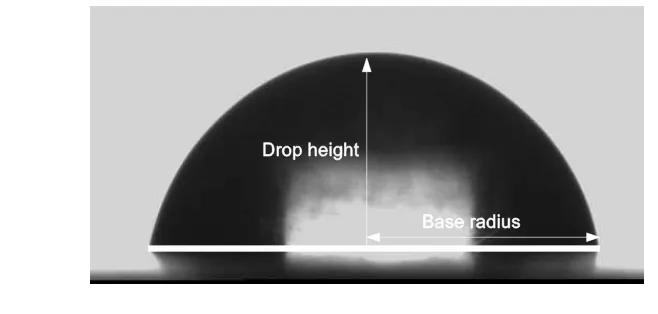
where R and hm = hm(t) = h(0, t) = Rtan(θ/2) are the base radius and the maximum height of the droplet, respectively. The total evaporation rate is given by
−dV dt = 2π ρ Z R 0 J s 1 + ∂h ∂r 2
rdr, (5)
where J =J(r, t) (≥0) is the local evaporative mass flux from the droplet.
satisfy Laplace’s equation ∇2T = ∇2Ts = 0. The mass flux from the droplet satisfies the local energy balance
LJ =−k∇T ·n on z =h for r < R, (6) where L is the latent heat of vaporisation and n is the unit outward normal to the free surface of the droplet. We assume that the temperature and the heat flux are continuous between the droplet and the substrate,
T =Ts and −k∂T
∂z =−k s∂Ts
∂z on z = 0 for r < R, (7)
and that the temperature is continuous between the substrate and the atmosphere,
Ts =Ta on z = 0 for r > R and on z =−hs. (8) Assuming that transport of vapour in the atmosphere is quasi-steady and is solely by diffusion, the concentration of vapour, denoted by c=c(r, z, t), satisfies Laplace’s equation
∇2c = 0.19 At the free surface of the droplet we assume that the atmosphere is saturated with vapour and hence
c=csat(T) on z =h for r < R, (9) where the saturation value of the concentration csat = csat(T) is an increasing function of temperature, approximated quartically inTa−T by
csat(T) = 4 X
i=0
αi(Ta−T)i, (10)
where the coefficients αi for i= 0, . . . ,4 were chosen to fit values calculated from the data for the specific volume of water vapour given by Raznjevic20, leading to α
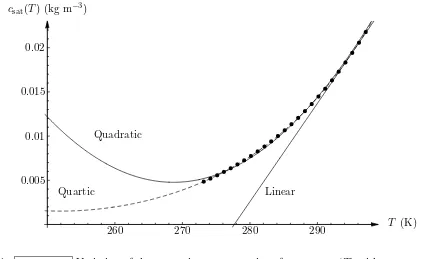
0 = 1.93×10⁻², α1 = 1.11×10⁻³,α2 = 2.77×10⁻⁵,α3 = 3.80×10⁻⁷ andα4 = 2.66×10⁻⁹ in units of kg m−3 K−i. Figure 7 shows the quartic approximation (10) together with the corresponding linear
and quadratic approximations and the values calculated from the data of Raznjevic20. In particular, Figure 7 reveals that while a linear approximation is sufficient for situations with a relatively small evaporative cooling of a few degrees K, such as those considered by David et al.13 and Dunn et al.14,15, the quartic approximation (10) is necessary for situations with a larger evaporative cooling of up to 20 K, such as those considered in the present work. On the dry part of the substrate there is no mass flux,
∂c
and, since the chamber is much larger than the droplets used in the experiments, far from the droplet the concentration of vapour approaches its far-field value of zero,
c→0 as (r2+z2)1/2 → ∞. (12)
Once cis known the local evaporative mass flux from the droplet is given by
J =−D∇c·n on z =h for r < R, (13)
where Dis the coefficient of diffusion of vapour in the atmosphere. As discussed in Section I and expressed in equation (2), a standard result from the theory of gases is that D is inversely proportional to pressure, and hence we write
D= Drefpref pa
, (14)
where Dref denotes the appropriate reference value of D at the reference pressure pref = 1 atm. Note that the diffusion coefficient is the only parameter in the model that depends on either the nature of the ambient gas or its pressure pa.
In the special case csat ≡ csat(Ta), corresponding to setting αi = 0 for i = 1, . . . ,4 in equation (10), the saturation concentration is constant and we recover the basic model in which the problem for the concentration of vapour in the atmosphere is decoupled from the problem for the temperature of the droplet and the substrate. Based on a numerical solution obtained using a finite element method Hu and Larson7 approximated the evaporation rate in the basic model as
−dV
dt =
πRDcsat(Ta)
ρ (0.27θ
2+ 1.30). (15)
This approximation is consistent with the exact analytical results
−dV
dt =
4RDcsat(Ta)
ρ when θ = 0 (16)
and
−dV
dt =
2πRDcsat(Ta)
ρ when θ =
π
2 (17)
for the basic model, and provides a useful check on the accuracy of the numerical procedure in this case.
MATLAB-based finite element package COMSOL Multiphysics (formerly FEMLAB), using a semi-circular domain whose radius was chosen to be 320 times the radius of the droplet and mesh points that were much more densely populated near the contact line. Comparison with equation (17) in the special case csat ≡csat(Ta) suggests that this procedure entails at most a 1% numerical error. At each time step the system of equations described above was solved to obtain dV /dt. Euler’s forward method was then used to estimate V, and hence θ and h, and hence the geometry at the next time step.
IV. EXPERIMENTAL RESULTS AND COMPARISON WITH MODEL
As the typical experimentally measured evolutions in time of the volume and the base radius of a droplet shown in Figure 4 illustrate, typically the evaporation process can be divided into two stages. In the first stage, the droplet is pinned and so the base radius is constant while the volume decreases very nearly linearly in time and hence the evaporation rate is very close to being constant in time. In the second stage, the droplet depins and so both the base radius and the volume decrease until complete evaporation. Henceforth we will restrict our attention to the first stage, i.e. to the situation in which the droplet is pinned and the evaporation rate is very close to being constant in time, and hence it is sufficient to use the average evaporation rate, which both the basic model and experimental studies, such as that by Birdi et al.12, indicate is proportional to the perimeter of the base of the droplet.
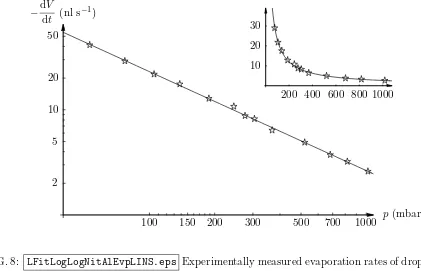
Figure 8 shows the effect of reducing the atmospheric pressure on the experimentally measured evaporation rate of droplets of water on an aluminium substrate in an atmosphere of nitrogen. The evaporation rate increases from around 3 nl s−1 at atmospheric pressure to
more than 40 nl s−1 at the lowest pressure investigated (around 40 mbar). On a logarithmic
scale the experimental data can be reasonably approximated by a straight line, leading to a simple numerical fit in the form −dV /dt = αpβ
a, where α and β ≃ −0.941 are fitting parameters, which is also shown in Figure 8. The inset in Figure 8 shows the same results plotted on a linear (rather than a logarithmic) scale. The corresponding approximations for evaporation into the other two ambient gases studied (not shown for brevity) yield β ≃ −0.867 for helium and β ≃ −0.873 for carbon dioxide, confirming that the evaporation
Ambient Gas He N2 CO2
Diffusion Coefficient (m2 s−1) 6.61×10⁻⁵ 2.15×10⁻⁵ 1.23×10⁻⁵
TABLE III: The fitted reference values of the diffusion coefficients of water vapour into the ambient
gases used in the experiments, Dref, at pressure 1 atm and temperature 295 K.
pressure, as assumed in the mathematical model.
In what follows we compare the experimental results with the corresponding theoretical predictions of the mathematical model described in Section III.
Figure 9 shows the effect of reducing the atmospheric pressure on the experimentally measured evaporation rate of droplets of water on an aluminium substrate in atmospheres of helium, nitrogen and carbon dioxide. In particular, Figure 9 illustrates that for a given substrate (in this case aluminium, but the same trend occurs for the other substrates studied) ambient gases with higher diffusion coefficients showed higher evaporation rates. Figure 9 also shows (as dashed lines) the theoretical predictions of the mathematical model using the parameter values given in Section III and reveals that, while the predictions of the model are qualitatively correct, they tend to over-predict the evaporation rate somewhat, and so in order to improve the quantitative predictions of the model a simple fitting of the value of the diffusion coefficient was performed. Specifically, for each of the ambient gases studied the value of the diffusion coefficient at the reference pressure (i.e.Dref in equation (14)) was fitted by comparing the experimental results for evaporation on an aluminium substrate with the corresponding theoretical predictions. Figure 9 also shows (as solid lines) the fitted theoretical predictions of the mathematical model and demonstrates that by tuning the value of a single parameter for each ambient gas we were able to obtain good agreement between theory and experiment across the entire range of atmospheric pressures studied. The fitted reference values of the diffusion coefficients of the ambient gases used in the experiments are given in Table III, and vary by at most 20% from the values given in Table II, i.e. comparable with the uncertainty in the theoretical values.
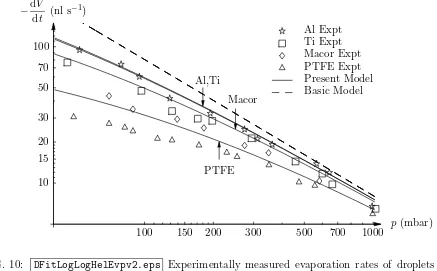
Figures 10 – 12 contain many of the main results of the present work and show some very clear trends. In particular, they show that for all the combinations of ambient gases and substrates studied, reducing the atmospheric pressure increases the evaporation rate. Furthermore, droplets on substrates with higher thermal conductivities evaporate more quickly than those on substrates with lower thermal conductivities, although the differences are less marked for ambient gases with smaller diffusion coefficients (e.g. the differences for helium shown in Figure 10 are more significant than those for carbon dioxide shown in Figure 12). Figures 10 – 12 also show that the theoretical predictions of the mathematical model using the values of the diffusion coefficients fitted for an aluminium substrate are in reasonable agreement with the experimental results for the other three substrates studied. (Obviously we could obtain even better agreement if we fitted the values of the diffusion coefficients separately for each substrate, but since the value of the diffusion coefficient should be independent of the nature of the substrate we chose not to do this.) Inspection of Figures 10 – 12 reveals that the agreement between theory and experiment is poorest for the substrate with the lowest thermal conductivity (namely PTFE), and the deviation is more pronounced for ambient gases with larger diffusion coefficients and at lower atmospheric pressures. Figures 10 – 12 also show that the corresponding predictions of the basic model, which are independent of the thermal properties of the droplet and the substrate, consistently over-predict the evaporation rate.
of 20 K was observed at the lowest values of pressure investigated (around 40 mbar). A comparison between the experimental results shown in Figure 13 and the corresponding theoretical predictions of the mathematical model will be presented in Section V.
V. DISCUSSION
within the droplet, and a comparison of these predictions with experimental measurements is a good test of the validity of the model. Figure 15 shows a comparison between the experimental measurements and the corresponding theoretical predictions of the evaporative cooling, ∆T, as a function of the atmospheric pressure for droplets on aluminium and PTFE substrates evaporating in an atmosphere of helium. For this purpose the theoretical value of the bulk temperature was defined to be
1 hm(0)
Z hm(0)
0
T(0, z,0) dz, (18)
wherehmis again the maximum height of the droplet. Considering the approximations made in deriving the mathematical model, the fact that it captures the qualitative trend and order of magnitude of the experimental results is rather encouraging. One obvious uncertainty in the comparison shown in Figure 15 is the exact location at which the temperature is measured in the experiments (see, for example, the measurements of temperatures at different locations within an evaporating droplet reported by David et al.13), and how this relates to the average value of the temperature calculated theoretically according to (18). Both of these aspects could be improved in future studies.
As Figures 10 – 13 show, the agreement between theory and experiment is poorest for substrates with the lowest thermal conductivities, and the deviation is more pronounced for ambient gases with larger diffusion coefficients and at lower atmospheric pressures, i.e. situations with the largest evaporation rates and strongest evaporative cooling.
Perhaps the most likely cause of the poorer agreement in situations with larger evapo-ration rates is the presence of thermocapillary-driven (Marangoni) flow within the droplet. Thermocapillary-driven flows within evaporating droplets have recently been studied by sev-eral authors, including Hu and Larson21, Ristenpart et al.22and Xu and Luo23. However, the excellent agreement between their theory and experiments conducted at atmospheric pres-sure led Dunn et al.14,15to suggest that thermocapillary effects were probably not significant in these experiments, a conclusion subsequently confirmed by the results of the numerical computations undertaken by Girard et al.24. However, stronger evaporation will tend to enhance the thermocapillary effect, making it a potential cause of the poorer agreement.
model, leading to non-equilibrium effects at the free surface of the droplet (as discussed by, for example, Sultan et al.25).
VI. CONCLUSIONS
An experimental and theoretical study into the effect of the atmosphere on the evap-oration of pinned sessile droplets of water has been described. The experimental work investigated the evaporation rates of sessile droplets in atmospheres of three different am-bient gases at reduced pressure using four different substrates with a wide range of thermal conductivities. Reducing the atmospheric pressure increases the diffusion coefficient of water vapour in the atmosphere and hence increases the evaporation rate. Changing the ambient gas also alters the diffusion coefficient and hence also affects the evaporation rate. A mathe-matical model that takes into account the effect of the atmospheric pressure and the nature of the ambient gas on the diffusion of water vapour in the atmosphere was developed, and its predictions were found to be in encouraging agreement with the experimental results. A more refined mathematical model incorporating thermocapillary and non-equilibrium effects would probably yield significantly improved theoretical predictions for the evaporation rate and the evaporative cooling of rapidly evaporating droplets.
Acknowledgments
The present work was supported by the United Kingdom Engineering and Physical Sci-ences Research Council (EPSRC) via joint research grants GR/S59444 (Edinburgh) and GR/S59451 (Strathclyde). The first author (KS) gratefully acknowledges valuable discus-sions with Prof. L. Tadrist (Laboratoire IUSTI, Marseille, France).
1 J. C. Maxwell, “Diffusion” inThe Scientific Papers of James Clerk Maxwell, Vol. 2, ed. W. D.
Niven (Cambridge University Press, 1890, reprinted Dover, New York, 1952). pp. 625–646.
2 I. Langmuir, “Evaporation of small spheres”, Phys. Rev. 12, 368 (1918).
3 R. G. Picknett and R. Bexon, “The evaporation of sessile or pendant drops in still air,” J. Coll.
4 C. Bourg`es-Monnier and M. E. R. Shanahan, “Influence of evaporation on contact angle,”
Langmuir 11, 2820 (1995).
5 C. Poulard, O. B´enichou, and A. M. Cazabat, “Freely receding evaporating droplets,” Langmuir
19, 8828 (2003).
6 R. Deegan, “Pattern formation in drying drops,” Phys. Rev. E61, 475 (1998).
7 H. Hu and R. G. Larson, “Evaporation of a sessile droplet on a substrate,” J. Phys. Chem. B
106, 1334 (2002).
8 Y. O. Popov, “Evaporative deposition patterns: spatial dimensions of the deposit,” Phys. Rev.
E 71, 036313 (2005).
9 C. Poulard, G. Gu´ena, and A. M. Cazabat, “Diffusion-driven evaporation of sessile drops,” J.
Phys.: Condens. Matter 17, S4213 (2005).
10 N. Shahidzadeh-Bonn, S. Rafa¨ı, S., A. Azouni, and D. Bonn, “Evaporating droplets,” J. Fluid
Mech.549, 307 (2006).
11 G. Gu´ena, C. Poulard, and A. M. Cazabat, “The leading edge of evaporating droplets,” J. Coll.
Int. Sci.312, 164 (2007).
12 K. S. Birdi, D. T. Vu, and A. Winter, “A study of the evaporation rates of small water drops
placed on a solid surface,” J. Phys. Chem.93, 3702 (1989).
13 S. David, K. Sefiane, and L. Tadrist, “Experimental investigation of the effect of thermal
prop-erties of the substrate in the wetting and evaporation of sessile drops,” Colloids and Surfaces
A: Physiochem. Eng. Aspects298, 108 (2007).
14 G. J. Dunn, S. K. Wilson, B. R. Duffy, S. David, and K. Sefiane, “A mathematical model for
the evaporation of a thin sessile liquid droplet: comparison between experiment and theory,”
Colloids and Surfaces A: Physiochem. Eng. Aspects323, 50 (2008).
15 G. J. Dunn, S. K. Wilson, B. R. Duffy, S. David, and K. Sefiane, “The strong influence of
substrate conductivity on droplet evaporation,” J. Fluid Mech. 623, 329 (2009).
16 R. C. Reid, J. M. Prausnitz, and B. E. Poling,The Properties of Gases and Liquids, 4th edn.
(McGraw-Hill, New York, 1987).
17 C. A. Ward and F. Duan, “Turbulent transition of thermocapillary flow induced by water
evaporation,” Phys. Rev. E69, 056308 (2004).
18 The assumption that the droplet shape can be approximated by a spherical cap is appropriate
which holds for the droplets considered in the present work.
19 The assumption that the transport of vapour in the atmosphere is quasi-steady is appropriate
when the characteristic timescale for diffusion, R2/D, where D is the coefficient of diffusion
of vapour in the atmosphere, is much less than the lifetime of the droplet, a condition that is
amply satisfied even at the lowest pressures (and hence highest evaporation rates) considered
in the present work.
20 K. Raznjevic, Handbook of Thermodynamic Tables, 2nd ed. (Begell House, New York, 1995).
Table 3-1, p. 85.
21 H. Hu and R. G. Larson, “Marangoni effect reverses coffee-ring depositions,” J. Phys. Chem. B
110, 7090 (2006).
22 W. D. Ristenpart, P. G. Kim, C. Domingues, J. Wan, and H. A. Stone, “Influence of substrate
conductivity on circulation reversal in evaporating drops,” Phys. Rev. Lett.99, 234504 (2007). 23 X. Xu and J. Luo, “Marangoni flow in an evaporating water droplet,” Appl. Phys. Lett. 91,
124102 (2007).
24 F. Girard, M. Antoni, and K. Sefiane, “On the effect of Marangoni flow on evaporation rates of
heated water drops,” Langmuir24, 9207 (2008).
25 E. Sultan, A. Boudaoud, and M. Ben Amar, “Evaporation of a thin film: diffusion of the vapour
Observation
Window
Gas
Supply
Injection
System
To Vacuum Pump
(40 − 1000 mbar)
Pressure
Gauge
[image:17.595.94.506.66.366.2]‘‘Low Pressure’’
Chamber
FIG. 1: lowpressurechamber.eps The “low pressure” chamber connected to a gas supply and a
FIG. 2: apparatus.eps The DSA100TM Droplet Shape Analysis (DSA) system with the “low
pressure” chamber: (a) focus and magnification adjustment knobs, (b) charge-coupled device
(CCD) camera, (c) light source, (d) injection system, and (e) low pressure chamber on the three-axis
V (µl)
t(s)
R (mm) Volume
Radius
Pinned Unpinned
2 4 6 8 10
0 50 100 150 200 250 300 350
[image:20.595.121.506.86.291.2]0.25 0.5 0.75 1.0 1.25 1.5 1.75 2.0
FIG. 4: VolRadEvo.eps Typical examples of the experimentally measured evolutions in time of
the volume (left hand axis) and the base radius (right hand axis) of a droplet of water on an
FIG. 5: thermocouple.eps Example of the insertion of a miniature thermocouple into a droplet
z
r
Solid Substrate Liquid Droplet Atmosphere
Mass FluxJ
θ
r =R
Atmospheric TemperatureTa and Pressurepa
Atmospheric TemperatureTa and Pressurepa
[image:22.595.115.482.73.290.2]−hs O
csat(T) (kg m−3)
T (K) Linear
Quadratic
Quartic 0.02
0.015
0.01
0.005
[image:23.595.97.518.68.327.2]260 270 280 290
FIG. 7: cvTv2.eps Variation of the saturation concentration of vapourcsat(T) with temperature
T showing the quartic approximation (10) (marked with the dashed line) together with the
corre-sponding linear and quadratic approximations (marked with solid lines) and the values calculated
−dV
dt (nl s
−1)
p (mbar) 2
5 10 20 50
100 150 200 300 500 700 1000 10
20 30
[image:24.595.87.508.70.341.2]200 400 600 800 1000
FIG. 8: LFitLogLogNitAlEvpLINS.eps Experimentally measured evaporation rates of droplets of
water on an aluminium substrate in an atmosphere of nitrogen for different atmospheric pressures.
The inset shows the same data on a linear (rather than a logarithmic) scale. In both plots the line
−dV
dt (nl s−
1)
p (mbar) Unfitted Theory
Fitted Theory
He
N2
CO2 2
5 10 20 50 100
[image:25.595.88.524.62.333.2]100 150 200 300 500 700 1000
FIG. 9: CombLogLogAlEvp.eps Experimentally measured evaporation rates of droplets of water
on an aluminium substrate in atmospheres of helium, nitrogen and carbon dioxide for different
atmospheric pressures, together with the corresponding theoretical predictions of the mathematical
model using the parameter values given in Section III (“Unfitted Theory”, marked with a dashed
line) and using the fitted reference values of the diffusion coefficients given in Table III (“Fitted
−dV
dt (nl s−
1)
p (mbar) Al,Ti
Macor
PTFE
Al Expt Ti Expt Macor Expt PTFE Expt Present Model Basic Model
10 15 20 30 50 70 100
[image:26.595.90.527.66.337.2]100 150 200 300 500 700 1000
FIG. 10: DFitLogLogHelEvpv2.eps Experimentally measured evaporation rates of droplets of
water in an atmosphere of helium on various substrates for different atmospheric pressures, together
−dV
dt (nl s−
1)
p (mbar) Al,Ti
Macor
PTFE
Al Expt Ti Expt Macor Expt PTFE Expt Present Model Basic Model
5 10 20 50
[image:27.595.100.517.66.324.2]100 150 200 300 500 700 1000
−dV
dt (nl s−
1)
p (mbar) Al,Ti
Macor
PTFE
Al Expt Ti Expt Macor Expt PTFE Expt Present Model Basic Model
2 5 10 20
[image:28.595.91.519.66.320.2]100 150 200 300 500 700 1000
∆T (K)
p(mbar) Al Expt
PTFE Expt
2.5 5 7.5 10 12.5 15 17.5
[image:29.595.82.525.66.338.2]200 400 600 800 1000
FIG. 13: ExpHelTvp.eps.eps Experimentally measured evaporative cooling of droplets of water
−dV
dt (nl s−
1)
D(×10−3 m2 s−1)
Al Expt Ti Expt Macor Expt PTFE Expt Present Model Basic Model
Al Ti
Macor
PTFE
20 40 60 80 100
[image:30.595.82.560.66.335.2]0.2 0.4 0.6 0.8 1.0 1.2
FIG. 14: DFitEvD.eps Experimentally measured evaporation rates of droplets of water in
at-mospheres of all three ambient gases on all four substrates plotted as functions of the diffusion
coefficient D together with the corresponding theoretical predictions of the mathematical model
∆T (K)
p(mbar) Al Expt
PTFE Expt Present Model
Al PTFE
2.5 5 7.5 10 12.5 15 17.5
[image:31.595.86.524.65.335.2]200 400 600 800 1000
FIG. 15: DFitHelTvp.eps Comparison between the experimentally measured evaporative cooling
of droplets of water in an atmosphere of helium on aluminium and PTFE substrates for different
atmospheric pressures shown in Fig. 13 and the corresponding theoretical predictions of the