
DRIVETRAIN AVAILABILITY IN OFFSHORE WIND
TURBINES
James Carroll Alasdair McDonald
University of Strathclyde University of Strathclyde
[email protected] [email protected]
Julian Feuchtwang David McMillan
University of Strathclyde University of Strathclyde
[email protected] [email protected]
Abstract
With a wide and rich array of candidate wind turbine drivetrains it is difficult to judge which is the best for offshore applications. In order to evaluate which drivetrain and generator type will lead to the lowest cost of energy for offshore wind, wind turbine availability must be
considered. Through the creation and
adaptation of new and current availability models, this paper provides an availability overview for a number of different offshore drivetrain configurations.
Keyword
Drive train, Turbine Configurations, Offshore,
Availability, Reliability, Failure Rates,
Downtime.
1. Introduction
The availability of a wind turbine contributes to the overall cost of energy; typically a lower availability will lead to a higher cost of energy. As a result of this wind farm developers will try to select a turbine with low failure rates, low mean time to recovery (MTTR) and high availability. Due to accessibility issues, the failure rate and availability of turbines become even more important as offshore wind generation increases. When a failure occurs in onshore turbines, the downtime consists of lead time and repair time. Offshore, however, this downtime can be greatly extended due to varying sea conditions as turbines can become inaccessible if sea conditions are above a certain threshold. It is for this reason that the
issue of turbine reliability must be considered when selecting offshore turbines.
Currently, one of the areas where turbines can vary greatly is in drivetrain configuration; a range of options for generators, gearboxes and converters is available. This paper concentrates on how these drivetrain options influence the overall wind turbine availability.
There is some comparative data for older turbines which focuses on direct-drive versus geared wind turbines and synchronous
generators versus induction generators.
However, these comparisons are based on onshore data as offshore wind turbine data is limited or not published [1]. The assumption that failure rates are constant from onshore to offshore wind turbines is also used in this paper. With this assumption as the foundation, onshore reliability will be modelled based on
past gearbox, generator and converter
reliability publications. The availability based on this onshore data will then be adjusted to provide offshore availability using a model to include the delay time, travel time and positioning time.
It should be noted that the assumption of equivalence from onshore to offshore failure rates is an area of further work. In reality, onshore and offshore failure rates will not be identical due to different conditions offshore. In
comparison to onshore, the offshore
2. Drivetrain Options
a. Gearbox
The gearboxes used in wind turbines can consist of a number of stages, these stages usually consisting of planetary or parallel gears. In the past, three stage high-speed gearboxes were the most commonly used; however two stage medium speed gearboxes are becoming more popular.
b. Generator
Wind turbine generators are either
synchronous or asynchronous. In a
synchronous machine the machine rotor is connected to the shaft that is driven by the wind turbine blades; the speed of this shaft may be stepped up by the use of a gearbox. The rotor is magnetised through DC current
excitation (wound rotor) or through a
permanent magnet (permanent magnet
synchronous generator). As the magnetised machine rotor rotates it creates a rotating flux in the air gap which cuts the conductor windings on the stator and produces AC current in accordance with the Maxwell-Faraday equation. In an induction generator the machine rotor is again connected to the shaft that is driven by the wind turbine blades via a gearbox. In a „squirrel-cage‟ induction machine, the stator flux induces a current in the simple rotor windings due to a difference in rotational speed. This magnetises the rotor. There is some speed variation from the synchronous speed. To increase this speed variation a converter must be used to effectively alter the synchronous speed. In a doubly fed induction generator (DFIG) the wound rotor is fed with variable frequency currents and so speed variations can be significant. Brushes and slip rings are used in this type of DFIG [1]. There is however, a brushless low speed DFIG generator being developed, it is called BDFM a brushless doubly fed machine. It operates by using two stator windings that have different pole numbers in the same frame, this allows for no coupling between them. A rotor type that can couple both fields is then used. [4]
c. Converter
[image:2.595.335.495.284.418.2]The drivetrain on a wind turbine with a certain rated power can consist of a fully rated converter (FRC) or a smaller converter as used in a DFIG turbine. The fully rated converter completely decouples the wind turbine from the grid and the converter size matches the rated power of the wind turbine. In a DFIG generator the converter only partially decouples the generator from the grid and the converter rating is not the same as the turbines rated power; it is smaller. Drivetrains that use a FRC and DFIG configuration can be seen in figure 1.
Figure 1: FRC and DFIG configurations [5]
3. Drive train configurations
used in this study.
This paper looks at the failure rates, downtime and both onshore and offshore availability for twelve different drivetrain configurations. The twelve different configurations consist of the following:
a. FRC, Permanent Magnet
Synchronous Generator (PMSG),
Direct Drive (DD) and with 3, 2 and single stage gearboxes.
b. FRC, Wound Rotor Synchronous Generator (WRSG), DD and with 3, 2, and single stage gearboxes.
c. FRC, Squirrel cage induction
generator (SCIG) with a 3 stage gearbox.
d. DFIG, Wound Rotor (WR), with a 3 stage gearbox.
4. Method
a. Overview
Onshore availability figures are calculated using onshore failure rates for the different turbine subsystems based on LWK and Windstats data from reference [6]. These failure rates are adjusted for the different drivetrain types based on references [7], [8] and [9] depending on which generator, gearbox, or converter type is used. The overall turbine failure rates are then used to calculate turbine availabilities for the different drivetrain
configurations. These turbine availability
figures vary due to the change in the drive train failure rates, specifically the change in generator, gearbox and the converter failure
rates. The onshore failure rates and
downtimes are then added to an offshore adjustment model for calculating offshore delay time, offshore travel time and positioning time. This allowed offshore downtimes and availabilities to be calculated.
b. Adjusting the failure rates for the
different
generator,
gearbox
and
converter types.
An average failure rate for each turbine type was calculated. The failure rate is the number of failures per turbine per year. These failure rates were adjusted depending on the generator, gearbox, or converter type used.
The generator failure rates were adjusted based on reference [7], which provides the reasons for generator failure and how often each issue causes the overall failure of the generator. These generator failure modes could then be used to adjust the failure rate for the different generator types. For example, reference [6] lists a baseline generator failure rate of 0.245 failures per year for generators, and it is known from reference [7] that 10.8% of generator failures are caused by issues related to rotors, brushes or slip rings. As a PMSG would not have any of these issues it was assumed that the PMSG failure rate could be reduced by 10.8% compared to the WRSG. Failure rates for each of the generators were estimated in a similar manner.
The gearbox failure rates based on an FMEA were provided in reference [8]. It states a failure rate of 0.096 for a three stage gearbox consisting of two planetary stages and one parallel stage as shown in figure 2. It provides a second failure rate of 0.097 for a 3 stage gearbox with one planetary stage and two parallel stages. An average of both these 3 stage gearboxes was taken to get an overall three stage gearbox failure rate of 0.0965.
[image:3.595.343.498.221.339.2]
Figure 2: Three stage gearbox consisting of two planetary stages and one parallel stage [8]
A failure rate of 0.068 was given for a two stage gearbox. The paper does not provide a failure rate for a single stage gearbox; however, it does contain failure rate data for each gearbox component, so a failure rate could be calculated by adding the failure rates for the components required to make a single stage gearbox. Through adding the failure rates of a single planetary stage, housing, lubrication and accessories a failure rate of 0.042 was obtained.
and two stage gearbox saw the stator failure rate adjusted linearlly as above.
Fully rated converters can be expected to have a failure rate at least 2.2 times greater than that for the smaller converters used with a DFIG [9]. This leads to a failure rate of 0.1883 for a FRC and 0.0856 for a DFIG converter.
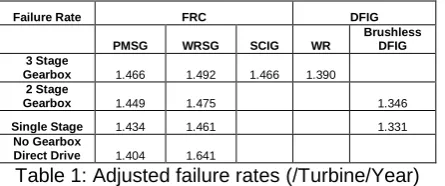
The adjusted onshore failure rates for turbines with the different drive drain configurations can be seen in the following table:
Failure Rate FRC DFIG
PMSG WRSG SCIG WR
Brushless DFIG 3 Stage
Gearbox 1.466 1.492 1.466 1.390
2 Stage
Gearbox 1.449 1.475 1.346
Single Stage 1.434 1.461 1.331
No Gearbox
[image:4.595.67.290.234.327.2]Direct Drive 1.404 1.641
Table 1: Adjusted failure rates (/Turbine/Year)
c. Calculating Onshore Availability.
With the onshore failure rates determined, mean time to recovery (MTTR) data for each subsystem [6] was used to work out annual downtimes. Annual downtime was then divided by the number of hours in a year and multiplied by 100 to work out the annual onshore availability.
d. Onshore availability to offshore
availability
For offshore availability it is not sufficient to look at onshore lead time and repair time. Delays due to sea conditions and the travel and positioning times of the vessels must also be included. The model used to estimate
offshore availability is based on the
probabilistic-statistical approach detailed in reference [10] and implemented in reference [11].Given a number of statistical parameters related to the wave regime at the wind farm site and data on reliabilities and repair times for different components, delays are calculated directly in a spread sheet. This avoids the need to run multiple lengthy simulations and makes it simple to explore the effect of changes in parameters, such as, in this case, failure rates.
The model takes into account delay time predicted from sea conditions, travel time from
the position of the site and average positioning time depending on the vessel type required to repair the failure. The onshore repair time is then added to the delay times calculated from the model to determine the overall downtime. Full details on the operation of the model can be found in reference [10] and an overview is provided in the following paragraphs.
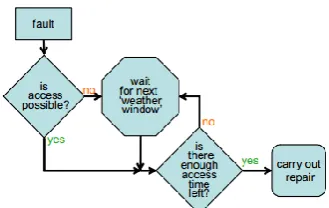
Three different vessel types are used in the model and each turbine failure is allocated to the vessel type required to repair that failure. Each vessel type has a sea condition threshold above which it cannot operate, and is then used, along with the past sea condition data, to calculate an expected delay time using the probabilistic model developed in reference [10]. The model is based on a number of simplifying assumptions given below:
- A failure will occur independently and unsystematically. In reality a failure will not be independent; it will be influenced by factors like wind speed, wave conditions etc. Higher wind speeds and rougher sea states would in reality lead to higher failure rates and reduced access, which in turn would lead to reduced availability [2].
- The repair will occur in a single trip and not be broken into multiple trips;
- Sea condition forecasts will always be available for the length of time required to complete the repair [10].
From the event tree in figure 3 , and a more detailed one that can be developed from it, probabilities and expected delay times are allocated to each branch of the tree. These probabilities and times are calculated directly from parameters of the wave height probability
distribution and wave height duration
Figure 3: Repair event tree
The analysis for this report was based on a site that is 16km from shore. The wave height duration distribution for this site was derived using the method in reference 12 and the wave height distribution figures from reference 13. The sites wave and wind characteristics can be seen in table 2. The modelled offshore availability figures depend on the wind and wave characteristics, and would vary as these inputs vary, further work could look at the sensitivities of variance to these inputs.
Wave location parameter 0.36 m
Wave shape parameter 1.36
Wave scale parameter 1.031 m
Wind location parameter 1.53 m/s
Wind shape parameter 2.12
Wind scale parameter 9.16 m/s
Table 2: Wave and Wind Characteristics
5. Results and Discussion
Table 3 shows the onshore availability results calculated by adjusting failure rates for the different drivetrain types as described in
section 4b. When these onshore failure rates and availabilities are applied to the offshore model described in section 4d the offshore availabilities for the different drivetrain configurations seen in table 4 are obtained.
The offshore availabilities range from 91.21% for the FRC DD WRSG to 93.40% for the single stage brushless DFIG
It is evident that the PMSG outperforms the WRSG consistently throughout the 3 different gearbox types and most notably so in the direct drive. A big driver for this improved reliability in the PMSG over the WRSG is the removal of failure modes such as rotor, brush and slip ring related failures. It can also be seen that the single stage gearboxes outperform the two and three stage gearboxes across all generator and converter types. The most reliable configurations modelled across both failure rate data samples used is the low speed brushless DFIG drivetrain. This is a concept that is still at the prototype stage of development [4].
The modelled offshore availability figures are in line with actual offshore availability figures stated in the Crown Estate/GL Garrad Hassan‟s publication “A Guide to UK Offshore Wind Operations and Maintenance” [14] which states that currently offshore wind farms
operate between 90-95% availability.
Onshore Availability FRC DFIG
PMSG WRSG SCIG WR Brushless DFIG
3 stage High Speed Gearbox 97.66% 97.61% 97.66% 97.68%
2 stage gearbox 97.74% 97.69% 97.82%
Single Stage 97.82% 97.76% 97.90%
No Gearbox Direct Drive 97.95% 97.47%
Table 3: Onshore availability for the varying drivetrain configurations
Offshore Availability FRC DFIG
PMSG WRSG SCIG WR Brushless DFIG
3 stage High Speed Gearbox 92.62% 92.38% 92.62% 92.78%
2 stage gearbox 92.83% 92.59% 93.22%
Single Stage 93.00% 92.76% 93.40%
No Gearbox Direct Drive 93.35% 91.21%
[image:5.595.81.268.359.417.2]Figure 4: Offshore availability
It can be seen that two drivetrain
configurations that have similar availabilities onshore may not be so similar offshore. The reason for this is that the offshore model is not linear. It breaks down the failure types into how often they are estimated to require a certain type of vessel for repair, an example of this is shown for the gearbox, generator and converter in table 5.
Vessel Type 1 Vessel Type 2 Vessel Type 3 Gearbox Failure 10.00% 26.00% 64.00%
Generator Failure 10.00% 26.00% 64.00%
[image:6.595.171.425.71.203.2]Converter Failure 4.00% 18.00% 78.00%
Table 5: Vessel requirement for different failure types [10]
The 3 different vessel types incur different delays so a repair requiring a type 1 vessel will incur greater delays than a type 3 vessel. A type 3 vessel would be equivalent to a Crew Transfer Vessel (CTV); type 2, a Field Support Vessel (FSV) and type 1 a Jack-up vessel. The vessel type required influences the overall delay time due to effects on vessel acquisition time, positioning time and travel time [9]. For example, a generator failure would require a type 1 vessel that incurs a longer delay 10% of the time. A DD WRSG has a high generator failure rate in comparison to other turbine sub-systems in the other drivetrain types. It is for these reasons that the FRC DD WRSG availability is a lot closer to the FRC 3 Stage Gearbox WRSG onshore than offshore, with a difference in availability of 0.14% and 1.17% respectively.
Based on the availability of the best and worst performing drivetrain, a rough estimate of the cost of lost production was carried out. It assumes a conservative annual production of
12000 MWh for a 5-6MW turbine [15] taking the 2013 ROC rate of £46/MWh and two ROCs/MWh for offshore [16] an annual revenue of £1,104,000/turbine is achieved. If market prices were used in this calculation instead of ROCs an even higher income per turbine per year would be achieved. The average offshore wind farm constructed in 2011 had 26 turbines and a design life of 20 years [17]. This gives an overall design life difference of ~ £12,500,000 for a wind farm that uses turbines with a single stage brushless DFIG instead of DD FRC WRSG. This calculation excludes any operation and maintenance cost or the cost of the turbines itself; it is only based on the cost of the lost production
6. Conclusion
From section 5 it can be seen that the choice of drivetrain has an impact on availability, a difference in availabilities between the best and worst performing drivetrains of ~ 2 % is seen. As mentioned in the introduction, this has an impact on the overall cost of energy and the results presented show that on an average wind farm the choice of drivetrain could save millions of pounds in loss of production alone.
Out of the technologies that are already fully developed and available, the Direct Drive Permanent Magnet Synchronous Generator with a Fully Rated Converter shows the best availability at 93.35%. However the low speed brushless DFIG concept under development shows the highest theoretical availability of all 12 configurations examined with 93.40% for a single stage gearbox. The normal wound rotor DFIG outperforms all of the other turbines with
90.00% 91.00% 92.00% 93.00% 94.00%
FRC PMSG FRC WRSG FRC SCIG DFIG WR Brushless DFIG
Offshore Availability
3 Stage Gearbox 2 Stage gearbox
3 stage gearboxes, but its availability is lower than the Direct Drive Permanent Magnet Synchronous Generator with a Fully Rated Converter. As a result of the wound rotor generator having too high a failure rate when it is directly driven, it cannot compete with the other technologies in terms of availability. However, employing direct drive with a permanent magnet generator seems to remove enough of the failure modes to make it one of the more reliable drivetrains.
A number of different opportunities exist to improve the results presented in this paper. Ideally, an availability analysis for different turbine drivetrain configurations could be carried out based on real offshore data. Until such data become available in the public domain, the modelling approach will have to be used. This leaves room for two areas of improvement; the first would be to obtain better onshore failure rate data for turbines that are as large as possible and that can be split into the different drivetrain configurations e.g. PMSG, WRSG, FRC, DFIG, etc. The second area for further work could be the model used to predict the offshore delays; this model has never been validated. A method of validating it could be to obtain a wind farms offshore availability and sea state data for a certain turbine type; then using the model with the same sea state data determine the modelled offshore availability. Finally, a comparison between the actual offshore
availability and the modelled offshore
availability could be carried out.
Additionally, since offshore availability for each configuration is dependent on the particular offshore conditions, it would be worth examining the sensitivities of the availability to those conditions as well as to the relative failure rates of the different configurations and their subsystems.
References
[1]. Polinder, H. ; van der Pijl, F.F.A. ; de Vilder, G.-J. ; Tavner, P.J. Comparison of Direct-Drive and Geared Generator. IEEE Vol 21, Iss 3, 2006.
[2] Faulstich, S. ; Hahn, B. ; Lyding, P. ; Tavner, P. Reliability of offshore turbines identifying risks by onshore experience. EWEA. 2009
[3] Van der Zee, T. ; Lindenburg, C. Wave direction effects on design loads of a 10 MW offshore wind turbine wind turbine. EWEA Offshore. 2013
[4]. Wind Technologies.
http://www.windtechnologies.com/Wind/Wind-Technologies/Show/49/65/67/Technology/Inno vative-drivetrain/Brushless-DFIG.aspx. [Online] 24 07 2013.
[5] Tavner,P. ; Higgins, A. ; Arabian, H. ; Long, H. ; Feng, Y. Using an FMEA method to compare prospective wind turbine design reliabilities. EWEC. 2010
[6]. Spinato, F. ; Tavner, P. ; vab Bussel, GJW. ; Koutoulakos, E. Reliability of wind turbine subassemblies. IET Renew Power Generation, Vol 3, Iss 4, 2009.
[7]. Alewine, K. Wind Turbine Generator Failure modes analysis and occurance. NREL, 2011.
[8]. Smoulders, K. ; Long, H. ; Feng, Y. ; Tavner, P. Reliability Analysis and Prediction of Wind Turbine Gearboxes. Warsaw : EWEC, 2010.
[9]. Tavner, Peter. Offshore Wind Turbines, Reliability Availability and Maintenance. s.l. : IET, 2012. Converters: Pg 66. Vessels: Pg 146.
[10]. Feuchtwang, J. ; Infield, D. The offshore access problem and turbine availability probabilistic modelling of expected delays to repairs. EWEA Offshore 2009.
[11]. Feuchtwang, J. ; Infield, D. Estimating the cost of offshore maintenance and the benefit from condition monitoring. EWEA Offshore 2011
[12]. Kuwashima, S. ; Hogben, N. The estimation of wave height and wind speed persistence statistics from cumulative
[13] Fugro GEOS. Wind and wave frequency distributions for sites around the British Isles. Health and Safety Executive. 2001
[14]. GL Garrad Hassan. A Guide to UK Offshore Wind Operations and Maintenance. Scottish Enterprise and the Crown Estate 2013
[15]. EWEA. http://www.ewea.org/wind-energy-basics/wind-energy-faq/. [Online] 24 07 2013.
[16]. Gov.uk.
https://www.gov.uk/government/policies/increa
sing-the-use-of-low-carbon-
technologies/supporting-pages/the-renewables-obligation-ro. [Online] 24 07 2013.
![Figure 1: FRC and DFIG configurations [5]](https://thumb-us.123doks.com/thumbv2/123dok_us/1628088.116022/2.595.335.495.284.418/figure-frc-and-dfig-configurations.webp)
![Figure 2: Three stage gearbox consisting of two planetary stages and one parallel stage [8]](https://thumb-us.123doks.com/thumbv2/123dok_us/1628088.116022/3.595.343.498.221.339/figure-stage-gearbox-consisting-planetary-stages-parallel-stage.webp)
![Table 5: Vessel requirement for different failure types [10]](https://thumb-us.123doks.com/thumbv2/123dok_us/1628088.116022/6.595.171.425.71.203/table-vessel-requirement-different-failure-types.webp)
