Edited by:
Anna Occhipinti-Ambrogi, University of Pavia, Italy
Reviewed by:
Jan Marcin Weslawski, Institute of Oceanology (PAN), Poland Maria Sini, University of the Aegean, Greece
*Correspondence:
Marnie L. Campbell marnie.campbell@murdoch.edu.au
Specialty section:
This article was submitted to Marine Ecosystem Ecology, a section of the journal Frontiers in Marine Science
Received:15 June 2018
Accepted:28 August 2018
Published:24 September 2018
Citation:
Campbell ML, Leonard K, Primo C and Hewitt CL (2018) Marine Biosecurity Crisis Decision-Making: Two Tools to Aid “Go”/“No Go” Decision-Making. Front. Mar. Sci. 5:331. doi: 10.3389/fmars.2018.00331
Marine Biosecurity Crisis
Decision-Making: Two Tools to Aid
“Go”/“No Go” Decision-Making
Marnie L. Campbell1,2*, Kaeden Leonard1, Carmen Primo3and Chad L. Hewitt2,4
1Environmental Research Institute, University of Waikato, Hamilton, New Zealand,2Harry Butler Institute, Murdoch University,
Murdoch, WA, Australia,3Institute for Marine and Antarctic Studies, University of Tasmania, Launceston, TAS, Australia, 4The School of Science, University of Waikato, Hamilton, New Zealand
Determining if a newly detected marine species is introduced to an area is an important first step when considering if control or eradication should be attempted. This step is often challenging, especially when data and introduced species expertise is limited: yet decisions about responding to a new invasion needs to occur in a timely manner. The crux is that biosecurity crisis decisions are often made in a vacuum. To improve this process, we consider expanded criteria to determine if a species is native, cryptogenic or introduced and outline application in a rapid response approach that uses a non-probabilistic decision tree to support decision makers. Effective use of the rapid response decision-tree and species criteria requires a multi-disciplinary approach drawing upon biology (taxonomy, phylogeny, genetics, ecology, biogeography) and monitoring. We assessed the expanded criteria against 213 bryozoan species present in Australian waters. A multivariate evaluation highlighted that a weight of evidence approach using the expanded criteria was successful in differentiating between native and introduced status. Our assessment highlighted that five criteria provide a high level of congruence with heuristic assignments, and provide a precautionary assignment of species’ status by reducing mis-classifications of introduced species as native species (Type I error) in comparison to the original criteria. However, differentiating between introduced and cryptogenic species remains problematic, especially when using the original criteria. We highlight the critical need for taxonomic identification, appropriate application of assigning cryptogenic status, and monitoring requirements to enable use of the criteria in a rapid response context. Using both the rapid response decision tree and the criteria provides a quantifiable mechanism to aid decision-makers in deciding whether to respond to a marine species introduction.
Keywords: bryozoan, environmental management, incursion response, introduced species, non-indigenous species, non-native species, cryptogenic species, rapid response
INTRODUCTION
the global community expends millions of dollars trying to understand, prevent, control, and eradicate introduced species, especially pest species affecting economic interests (Pimentel et al., 2001; Williams and Grosholz, 2008).
To aid in these endeavors, management tools such as biosecurity frameworks, risk analysis, risk management and incursion response are remain areas of ongoing development but are readily available (Gollasch, 1996; Hewitt and Hayes, 2002; Andow, 2003; Hayes and Sliwa, 2003; Floerl et al., 2005; Coutts and Forrest, 2007; Campbell, 2008, 2011; Campbell et al., 2009; Cliff and Campbell, 2012; Blackburn et al., 2014; Ojaveer et al., 2015), however determination of the native/introduced status of a newly detected marine species remains problematic. This problem is relevant in terrestrial and freshwater systems (e.g.,
Simberloff, 2003; Blackburn et al., 2014) however, the magnitude of knowledge gaps is significantly greater in a marine context (Ojaveer et al., 2015), with the marine environment often treated as being “out of sight, out of mind” or for marine biosecurity “too connected and therefore too difficult to effectively manage.”
When a new species is detected (typically referred to as an “incursion”), it is imperative that informed decisions are enabled to guarantee appropriate management action (eradication or control) is undertaken (often referred to as rapid response). Early detection and rapid response to an incursion within a marine context is considered crucial for successful eradication (e.g.,May, 1992; Anderson, 2005; Williams and Grosholz, 2008). InFigure 1, the steps of a rapid response decision tree for post-incursion management processes are illustrated. Each step of the decision tree allows for a “go/no go” decision to be made by an environmental manager and hence informs whether a response should proceed. A critical component of this decision tree is the determination of a species’ status: is the species native, cryptogenic or introduced?
Determining a species’ status in marine ecosystems is complicated by a fundamental lack of baseline biodiversity data (e.g.,May, 1992; Gray, 1997; Blackburn et al., 2014; Ojaveer et al., 2015) for the majority of the world’s marine and estuarine areas. Without baseline data, it is difficult to determine if a species is: (1) new to an area (introduced either through natural processes or through human facilitation); (2) native, but has not been sampled in that region before (due to effort and/or sample methods); or (3) native, but an undescribed species that is new to science. Rapidly determining a species’ status (and taxonomic identity) is critical to aid decision-makers in selecting an appropriate management action (such as attempting eradication). By applying the precautionary approach, the species’ status must be determined to ameliorate risks to the environment from both invasive species and conservation perspectives. Attempting to eradicate a “new” species without this knowledge involves a high level of risk that an endemic and/or rare native species may be eradicated or severely impacted upon.
Chapman and Carlton (1991, 1994) (Table 1) developed
criteria to help determine if a marine species was native, cryptogenic or introduced. Components of the Chapman and Carlton (1991, 1994) 10-point criteria (or derivatives thereof) have been used relatively successfully to infer a species status
(e.g., Cranfield et al., 1998; Coles et al., 1999; Hewitt et al., 1999, 2004; Wasson et al., 2001; Eldredge and Carlton, 2002; Orensanz et al., 2002; Toft et al., 2002; Glasby et al., 2007). These criteria were originally developed to provide substantive evidence when investigating if a species was a paleo-endemic (a relict species;sensu;Menzies and Miller, 1972) or an introduced species (Chapman and Carlton, 1991). The criteria evaluate species’ ecological, geographical and evolutionary attributes, using deductive reasoning to aid in the determination of a species’ status. Therefore, application of the criteria requires knowledge from many biology sub-disciplines, with any errors of judgement potentially leading to mis-determination of status, resulting in management actions that could lead to the unwanted eradication of a rare, native species (statistically referred to as Type II error) or leaving a potential pest introduced species unmanaged (Type I error).
Subsequently,Carlton (1996)proposed the term “cryptogenic” [hidden origin] to describe species that could not be demonstrably determined to be either native or introduced. Carlton has argued that all species are cryptogenic until they have been evaluated and defined as native or introduced. Unfortunately, the subsequent use of this term in the literature and by management agencies has become diluted to mean “species that are suspected introductions but for which insufficient evidence exists to support the suspicion” (pers. obsv.).
To date, these criteria have been used to train a number of countries in determining a marine species status, as a component of introduced species surveys, surveillance and monitoring (Campbell, 2003a; Campbell et al., 2007). The criteria have weaknesses, however to date they are the only scientifically tested criteria for determining the introduced status of marine species. Thirty-eight papers have been published that either stated that they used the criteria (with no description of how the criteria were used), or used the criteria with a description of how they applied the criteria. At least seven research groups (Kelly et al., 2003; Xavier et al., 2009; Concepcion et al., 2010; Geller et al., 2010; de Araujo Bumbeer and da Rocha, 2012; Campbell et al., 2016; Pociecha et al., 2016) have suggested alterations to the criteria. The alterations being either consideration of whether a species is detected on artificial substrate(s) (Kelly et al., 2003; de Araujo Bumbeer and da Rocha, 2012; Pociecha et al., 2016), or the use of molecular tools (Xavier et al., 2009; Concepcion et al., 2010; Geller et al., 2010). We note however, that these suggested alterations already match existing criteria (criterion 5 and criterion 13). Until an improved set of criteria is presented, they remain best practice and, if used in a consistent manner, aid determination of a species’ status that is comparable between localities, both nationally and internationally.
FIGURE 1 |Simplified introduced species incursion response decision-tree.
authors to aid management responses to the black-striped mussel (Mytilopsis sallei) invasion in Darwin Harbor (Willan et al., 2000) and two unpublished fanworm (Sabella spallanzanii) invasions in Esperance, Western Australia (delayed management decision to respond led to an inability to eradicate) and Eden, New South
Wales (where a rapid response and continued surveillance led to an initial eradication).
As a starting point, the Chapman and Carlton (1991,
1994) criteria have been used with the addition of five new
TABLE 1 |Criteria used to determine if a marine species is introduced, cryptogenic or native.
Geography Criterion Description
Provincial 1 Sudden local appearance
Provincial 2 Subsequent local spread
Provincial 3 Distribution associated with human mechanisms of dispersal
Provincial 4 Trophic dependence (and symbioses) on known introduced marine species
Provincial 5 Most prevalent in, or restricted to, new or artificial environments
Provincial 6 Local distribution restricted compared to native species
Provincial 7 Local distribution wider when compared to native species Provincial 8 Regional distribution wider when compared to native species
Global 9 Disjunct global distribution
Global 10 Widespread global distribution
Global 11 Active dispersal mechanisms are inadequate to attain current global distribution without human aid
Global 12 Passive dispersal mechanisms are inadequate to attain current global distribution without human aid
Global 13 The species is most similar morphologically, or genetically, to species in other regions of the world
Global 14 Only one sex of a dimorphic species can be detected
Global 15 This genus is not present in the country/island/continent (higher taxonomic affinities are lacking)
The criteria are modified fromChapman and Carlton (1991, 1994), with the addition of new criteria that are highlighted inboldfont.
that occur in shallow Australian waters (<50 m depth) and
that were present in the Australian port surveys (Hewitt and Campbell, unpublished). These species were then scored against the original Chapman and Carlton criteria and the expanded criteria with information available in the scientific literature.
A-prioriknowledge of each species’ status (native, cryptogenic, introduced) determined through heuristics (expert taxonomic and ecological opinion) was used as the base comparison to assess criteria model performance.
DEFINITIONS
Herein, a nativespecies is defined as one that lives in an area where it has been present in geologic time or to which it arrived through non-human-mediated means; inferring a location where it “originated.” An introduced species is defined as one that has been recognizably transported by the agency of humans to a new biological region where it previously did not exist (sensu Carlton, 1996). Terms that we treat as synonymous with introduced include: “alien,” “adventive,” “exotic,” “non-native,” and “non-indigenous” (e.g., Occhipinti-Ambrogi and Galil, 2004). Consistent with the original definition, acryptogenic
species cannot be identified as either introduced or native; it has an unknown origin (sensu Carlton, 1996). A species’ status is not ubiquitous: a species may be introduced in one region, native in another and cryptogenic in a further region. Consequently, a native species to Australia, may also have a history of introductions elsewhere.
MATERIALS AND METHODS
Test Case Taxa
Bryozoa (Ectoprocta) are aquatic (freshwater and marine), filter-feeding invertebrates that form colonies. They are a diverse group with at least 131 recognized families in the world. Marine bryozoa
were selected as test case taxa because: (1) they have a long fossil history, which provides a well-defined geographic record (e.g., McKinney, 1986; Smith, 1995; Gordon, 1999; Hageman et al., 2000; Amini et al., 2004); (2) both the fossil and recent bryozoan fauna are relatively well studied (e.g., Ryland, 1977; Bock, 1982; Gordon, 1999; Campbell et al., 2003; Barnes and Griffiths, 2008; Tilbrook, 2012); (3) they are fouling organisms that are associated with a number of different transport/dispersal vectors: biofouling, ballast water, and mariculture (Cariton and Geller, 1993; Gollasch, 2002; Godwin, 2003; Campbell et al., 2004, 2017; Hewitt et al., 2004; Levings et al., 2004; Piola et al., 2009); and (4) they have a demonstrable invasion history (e.g.,Cohen and Carlton, 1995; Hewitt, 2002; Hewitt et al., 2004; Mackie et al., 2006, 2012; Leonard et al., 2017).
We selected the target species for this analysis from the bryozoan species that were collected and identified from the Australian national port surveys that occurred from 1995 to 2001 (e.g.,Hewitt et al., 1997a,b, 1999, 2000, 2004; Hewitt and
Campbell, 2001; Hewitt, 2002). The original CSIRO national
port surveys identified and verified 201 bryozoans (Campbell et al., 2003). Additional Australian port surveys that Campbell was involved with identified a further 14 bryozoans from ports (e.g., Campbell, 2003b) that were subsequently added to our analysis to bring the total to 215 bryozoan species (subsequent taxonomic reclassifications have reduced this number to 213). The Australian national port surveys were undertaken by CSIRO with partner agencies, and involved taxonomic training for CSIRO personnel in a range of phyla.
Arnold (Queensland Museum); Dr. Dennis Gordon (NIWA), Dr. Rad Nair (University of New South Wales), and Dr. Kevin Tilbrook (University Oxford Museum of Natural History and Museum of Tropical Queensland). Prior to submission, scientific names of all species were verified using the following taxonomic databases: World Register of Marine Species (WoRMS; http:// www.marinespecies.org/); Integrated Taxonomic Information System (ITIS; http://www.itis.gov/); and Global Biodiversity Information Facility (GBIF; http://www.gbif.org/).
Taxonomic experts were asked to provide their judgement as to whether the specimens were native, introduced, or if the species’ status could not be identified (i.e., cryptogenic) for the locations where the specimens were collected. Expert judgement was used as the a priori classification of a species’ status (Supplementary Table S1). As discussed in Carlton and colleagues (Carlton et al., 1999) and Campbell et al. (2007), heuristic classification of a species’ status undertaken by taxonomic or invasion ecology experts is not always correct, and hence, further development of theChapman and Carlton (1991, 1994)is crucial to provide greater accuracy.
Criteria
We expanded the established 10-point (Chapman and Carlton, 1991, 1994) criteria to include five additional criteria (Table 1) after evaluating outcomes of the national and international port survey data sets (Australia, South Africa, Brazil; e.g., Pollard and Hutchings, 1990a,b; Hewitt et al., 1997a,b, 1999, 2000, 2004; Hewitt and Campbell, 2001; Hewitt, 2002; Campbell, 2003a) and international species data readily available within the published literature (e.g.,Ribera and Boudouresque, 1995; Brattegard and Holthe, 1997; Zaitsev and Mamaev, 1997; Cranfield et al., 1998; Zaitsev and Alexandrov, 1998; Coles et al., 1999; Boudouresque and Verlaque, 2002; CIESM, 2002; Galil et al., 2002; Hewitt, 2002; Leppäkoski et al., 2002; Orensanz et al., 2002; Occhipinti-Ambrogi and Savini, 2003; Castilla et al., 2005). A description of each criterion is provided inTable 1.
A “weight of evidence” approach was used to determine a species’ status based on these criteria. This was undertaken using binary scoring of each species against each criterion (see
Supplementary Table S1): if a species matched a criterion it was given a score of “1,” with a score of “0” applied to criterion that the species did not match. A species’ score was summed to provide an overall score against the criteria. If a species overall score was between “0 and 5,” then it was classified as a native species. For scores “6–8,” the species was classified as “cryptogenic” and species that scored “>8” were considered to be introduced. In
a similar manner toPociecha et al. (2016), greater confidence occurred at either ends of the scoring scale, with intermediate values ranked as an indeterminate (i.e., cryptogenic) species’ status. Ana prioriclassification of a species status was derived from expert opinion and used as a “baseline of knowledge.”
There are two criteria [criteria 4 (trophic dependence and symbioses on known introduced marine species) and 14 (only one sex of a dimorphic species can be detected)] that are rarely met, yet when they are met they provide strong evidence that a species is introduced.
The new criteria were developed to capture trends evident in the data we analyzed (port surveys, baseline data and published literature), such as:
(1) The local distribution of introduced species is often wider compared to native species distributions—at a later stage of invasion, the affinity of introduced species with human mediated transport mechanisms leads to a broader local distribution than may be observed by naturally dispersing natives (criterion 7);
(2) The regional distribution (within bioregion) of introduced species are wider when compared to native species—at a later stage of invasion, the affinity of introduced species with human mediated transport mechanisms leads to a broader regional distribution than may be observed by naturally dispersing natives (criterion 8);
(3) Widespread global distribution—the affinity of introduced species with human mediated transport mechanisms leads to a broader global distribution than may be observed by naturally dispersing natives (criterion 10);
(4) Only one sex of a dimorphic species can be detected—due to random chance, particularly where the initial introduction size is small, only a single sex may be transferred to a new location as a “founder effect” (criterion 14); and
(5) This genus is not present in the country/island/continent (higher taxonomic affinities are lacking)—this criterion is commonly used as a first “flag” for taxonomists and biogeographers that the species being examined may not be native (criterion 15).
Species’ geographic distributions (used to score criteria 2, 6, 7, 8, 9) were assessed using modified IUCN (World Conservation Union) bioregionalisations (Kelleher et al., 1995). We have modified the IUCN bioregions in the following ways: (1) distances have been limited to 200 nautical miles from shore, thus representing each country’s Exclusive Economic Zone (EEZ); (2) additional sites have been developed for small island states; and (3) we have incorporated the Global Open Oceans and Deep-sea Habitats (GOODS) bioregional classification (Agnostini et al., 2008; Vierros et al., 2008, 2009).
Analyses
To test the validity of all 15 criteria, 213 bryozoan species were assessed to create a criteria-matrix. Each species was examined against the criteria using Australia as the recipient country. For example, for criterion 1, you would ask “did the bryozoan,
Schizoporella unicornis,appear in the Australian environment suddenly.” For the assessment of model efficacy, criteria were not weighted and status determination did not require all 15 criteria to be addressed. The analyses were controlled for taxonomic differences by using a single phylum (Bryozoa) and controlled for region by using a single, well-studied region (Australia).
of a-priori status, decision trees were constructed (Breiman
et al., 1984; Ripley, 1996), using XLSTAT (version 2017.5).
The a priori categorisations of species’ status were used as the dependent variable within the decision trees. Decision tree models illustrated the relevance ofa-posterioriclassification using the original and expanded criteria. To ensure that a robust model was achieved, different algorithms were tested [Chi-squared Automatic Interaction Detector (CHAID), exhaustive CHAID (exh CHAID), Classification and Regression Trees (C&RT), and Quest], with a maximum tree depth restricted to three levels to facilitate interpretation. A confusion matrix (Visa et al., 2011) was used to evaluate the models. The decision trees with the greatest level of accuracy were achieved using the C&RT algorithm, with the Gini index.
A comparison of a-prioristatus vs. results from the nMDS analyses was used to identify prediction accuracy. To provide a measure of prediction efficacy, we compared the original criteria against the expanded criteria to determine the model accuracy in determining a species’ status.
RESULTS
Original Criteria
A-prioriexpert knowledge categorized the species as 158 (74%) native, 21 (10%) cryptogenic and 35 (16%) introduced species. Scoring the species against the Chapman and Carlton (1991, 1994) criteria and assigning status based on cumulative score (0–5=native; 6–8=cryptogenic; 9–10=introduced) resulted
in 174 (81%) native, 39 (18%) cryptogenic, and 1 (0.04%) introduced species. A comparison of the a-prioriclassification and assignments based on the original criteria shows that the original criteria incorrectly identified 7 introduced and 11 cryptogenic species as native species, 2 native and 28 Introduced species as cryptogenic, and 1 cryptogenic species as introduced. Thus, the original criteria downgraded the status of 35 species from introduced to either cryptogenic or native, leading to a greater likelihood of Type II (false negative) errors from a biosecurity perspective. This equates to an increased likelihood of missing an introduction of a species.
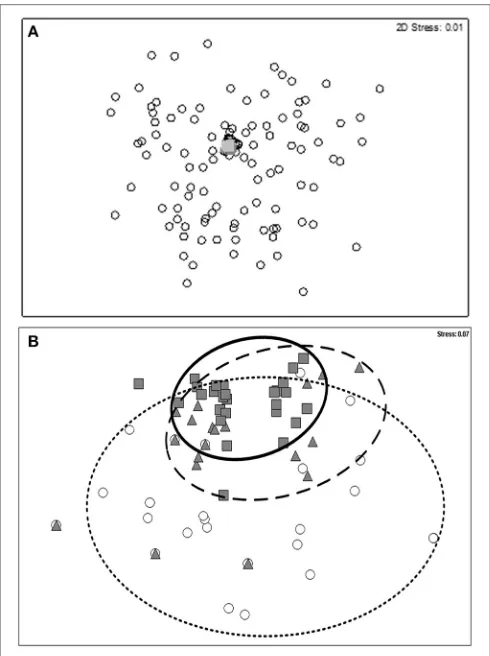
The original criteria failed to clearly differentiate introduced and cryptogenic species from native species, or introduced and cryptogenic species from each other when using classification/ordination analyses (Figure 2A, stress=0.01). At a
30% similarity threshold, there were three distinct groupings and 98 species outliers that do not group (Figure 3). The 98 species outliers consist of 96 native species and two cryptogenic species. The aggregated group “A” consists of 29 native species, group “B” consists of 3 native and 1 cryptogenic species, and group “C” is a mix of status types: 30 native, 18 cryptogenic, and 35 introduced species.
The optimal C&RT analysis for the original (Chapman and Carlton, 1991, 1994) 10-point criteria selected five variables that best predicted the status (native, cryptogenic, or introduced) of test species (Figure 4):
• Criterion 3 distribution associated with human mechanisms of
[image:6.595.305.550.62.390.2]dispersal;
FIGURE 2 |2-dimensional nMDS plot of native, cryptogenic and introduced bryozoan species (n=215) based on the:(A)original (Chapman and Carlton,
1991, 1994) 10-point criteria for identifying a species status (stress=0.01);
and(B)the expanded criteria for identifying a species status (stress=0.07).
Open circle denotes native species; closed triangle denotes cryptogenic species; and the closed square denotes introduced species.
• Criterion 13 the species is most similar morphologically, or
genetically, to species in other regions of the world;
• Criterion 2 subsequent local spread; • Criterion 9 disjunct global distribution; and • Criterion 1 sudden local appearance.
The model correctly identified 88.84% of species’ status. Notably, two introduced species were mis-identified as being native and seven natives were incorrectly identified as being introduced (Table 2). The model (Figure 4) also confirms the nMDS outcomes (Figure 2) that the original criteria leads to a greater likelihood of Type II errors.
Expanded Criteria
Using the same classification scheme (0–5 = native; 6–
8= cryptogenic; >8 =introduced) the 213 bryozoan species
FIGURE 3 |Dendrogram plot of native, cryptogenic and introduced bryozoan species (n=215) based on the original (Chapman and Carlton, 1991, 1994) 10-point
criteria. Species are referenced as numbers (linked to scientific name and authority inSupplementary Table S1).
species as native species, 22 native and 3 introduced species as cryptogenic, and 1 native and 7 cryptogenic species as introduced. Thus, the new criteria upgraded the status of 23 species from native to cryptogenic (22) or introduced (1), leading
FIGURE 4 |Regression tree model for the classification of species status [native (green), cryptogenic (orange), and introduced (red)] based onChapman and Carlton (1991, 1994)10-point criteria. At each node the number of species (n) and purity (P) is presented where P is the percentage of species correctly classified within each node. Criteria number is provided in parentheses after the criteria name.
TABLE 2 |Confusion matrix of original (Chapman and Carlton, 1991, 1994) 10-point criteria predicting species status with yes/no answers to criteria as sorting parameters.
Prior/Posterior Species status Total % correct
Cryptogenic Introduced Native
Native 0 7 152 159 95.60
Cryptogenic 6 8 7 21 28.57
Introduced 0 33 2 35 94.29
Total 6 48 161 215 88.84
An nMDS comparison of the original criteria and the a-prioriclassification against the expanded criteria shows that the expanded criteria correctly identified each of the introduced and cryptogenic species (100% correct) but potentially mis-identified seven native species as introduced and nine native species as cryptogenic. The nMDS (Figure 2) provides evidence that the expanded criteria provided a more conservative estimate of species’ status, from an introduced species management context [i.e., increased Type I (false positive) error].
The expanded criteria were relatively effective at assessing species aggregations into either native, or cryptogenic and introduced status (Figure 2B; stress 0.07) but the differentiation between introduced and cryptogenic species was indistinct in
several instances. Criterion 14 (only one sex of a dimorphic species can be detected) could not be assessed because no bryozoans met this criterion. This is discussed further below.
At a 45% similarity threshold, there were three distinct groupings of species (Figure 5). The aggregated group “A” consists of 28 native species, group “B” consists of 103 native and 3 cryptogenic species, and group “C” is a mix of status types: 27 native, 18 cryptogenic, and 35 introduced species. Thus, some blurring (representing 0.5–1.4% uncertainty) between status groups occurred, predominately between the introduced and cryptogenic species.
The C&RT analysis for the expanded criteria selected six variables that best predicted status (cryptogenic, native, or introduced) of test species. Much like the original criteria, five of the variables were the same, but an additional, new criterion was identified:
• Criterion 3 distribution associated with human mechanisms of
dispersal;
• Criterion 13 the species is most similar morphologically, or
genetically, to species in other regions of the world;
• Criterion 2 subsequent local spread; • Criterion 9 disjunct global distribution; • Criterion 1 sudden local appearance; and
• New criteria 10 widespread global distribution
FIGURE 5 |Dendrogram plot of native, cryptogenic and introduced bryozoan species (n=215) based on the expanded criteria. Species are referenced as numbers
(linked to scientific name and authority inSupplementary Table S1).
Similar to the original criteria 88.84% of species status were correctly identified however, unlike the original criteria; two previously mis-identified introduced species were assigned as cryptogenic instead of native, thus reducing Type II errors (Table 3). Based on both the nMDS (Figure 2) and the decision
FIGURE 6 |Regression tree model for the classification of species status [native (green), cryptogenic (orange), and introduced (red)] based on expanded criteria. At each node the number of species (n) and purity (P) is presented where P is the percentage of species correctly classified within each node. Criteria number is provided in parentheses after the criteria name.
TABLE 3 |Confusion matrix of expanded criteria predicting species status with yes/no answers to criteria as sorting parameters.
Prior/Posterior Species status Total % correct
Cryptogenic Introduced Native
Native 1 10 148 159 93.08
Cryptogenic 10 6 5 21 47.62
Introduced 2 33 0 35 94.29
Total 13 49 153 215 88.84
DISCUSSION
The ability to rapidly differentiate a newly detected species as either native, cryptogenic or introduced is the first step in effectively managing incursions. Typically, management aims to maximize eradication opportunities in the early stages of an incursion, before population growth becomes exponential or further spread occurs (Williamson, 1996). Criteria have been
developed to aid this endeavor, however criticism of the original Chapman and Carlton 10-point criteria exists (e.g.,Tavares and
de Melo, 2004) and has on occasions detracted from its use
as a management tool (pers. obs.). Therefore, to improve the ability of managers to determine a species’ status and to aid in their determination of whether to respond to an incursion, we have critically examined theChapman and Carlton (1991, 1994)
criteria and suggested an expanded set based on observations from baseline marine species surveys. We evaluated the original and expanded criteria against 213 bryozoan species present in shallow Australian waters. We found that the expanded criteria performed better against a-priori classifications with a simple “weight of evidence” approach, clustering approaches, and C&RT analyses. More importantly, the expanded criteria resulted in a more precautionary classification of species with a reduced Type II error (false negative) than the original (Chapman and Carlton, 1991, 1994) 10-point criteria.
relatively poor (Figure 2A) when relying solely on an nMDS statistical approach whereas the expanded criteria manage to differentiate native species from introduced and cryptogenic species more effectively (Figure 2B). The expanded criteria did not differentiate all introduced and cryptogenic species clearly. We note that the accuracy of the expanded criteria to differentiate cryptogenic species was relatively high (47.62% correct) compared to the accuracy of original criteria (28.57% correct). Uncertainty exists when differentiating cryptogenic species, but this uncertainty is reduced when using the expanded criteria. Overall, the new criteria improves the accuracy of determining a species’ status when compared with the original criteria, erring on the side of precaution (Figure 2;Tables 2,3).
A common concern raised by scientists using theChapman and Carlton (1991, 1994)criteria is the apparent lack of ability to differentiate endemic natives from introduced species (Campbell, 2003a). The original criteria were first developed to aid with this very problem (1991, 1994) but implementation has been difficult because of limited data availability. The decision tree analyses illustrate that the original criteria differentiate between species status relatively effectively (when examining the test group of bryozoan species), but the expanded criteria improve the accuracy (Tables 2,3) and are able to differentiate the majority of native species from those that are introduced or cryptogenic (stress 0.07;Figure 2B). Nonetheless, adequate data is essential to assess the species against the individual criteria.
The initial, and crucial, step in determining a species’ status is to assign taxonomic identity. In its absence, species must be assigned cryptogenic status and the determination of a name made a priority. Data availability for aspects of taxonomic and biogeographic determination have improved greatly since the original criteria were developed. The development of information facilities provide readily accessible global information on taxonomy and biogeography (e.g., WoRMS; http://www.marinespecies.org/; ITIS; http://www.itis.gov/) (GBIF; http://www.gbif.org/) enabling rapid assessment of several criteria (e.g., 3, 9, 10, 13).
We note that criteria (1, 2) require monitoring at the local/regional scale to determine “sudden local appearance” and “subsequent local spread” and criteria 6, 7, and 8 infer that active surveillance is operating to infer species distributions. While these monitoring and surveillance activities may not be active in all regions, they are increasingly becoming an active part of global efforts to manage marine environments to achieve natural resource management, conservation, and biosecurity outcomes. Given the relative importance of criteria 1 and 2 to rapid assessment of species’ status, we recommend establishment of appropriate baselines and monitoring activities to address these criteria.
Our assessment has focused on Australian bryozoan species as a well-known group with readily accessible taxonomic, ecological and biogeographic information globally and in Australia. The identified criteria with greatest predictive power (1, 2, 3, 9, 10, 13) are unsurprising and have largely been identified in previous studies using other taxonomic groups with different ecological habits (e.g., sponges—Kelly et al., 2003; multiple species—Hewitt et al., 2004; soft corals—Concepcion et al., 2010; de Araujo
Bumbeer and da Rocha, 2012; Campbell et al., 2016). None of
the identified six criteria are explicitly aligned to any taxonomic group and would not be expected to change but instead are descriptive of widely successful invading species.
Uncertainty exists when differentiating between species that are native in one region but are introduced or cryptogenic elsewhere, and hence these species have the potential to influence some of the provincial and global criteria (e.g., criteria 8, 9, and 10). For example, blurring of the boundaries between native Australian species that have been introduced or are considered cryptogenic elsewhere occurred in the analysis (e.g.,
Celleporaria aperta, Virididentula dentata). In our analyses, a number of species (n = 23) that are native to Australia, but
are also recognized as introduced or cryptogenic elsewhere, and/or a number of species that have wide (“cosmopolitan”) distributions, were further differentiated by incorporating background information and ensuring that the criteria are assessed from an appropriate regional perspective (i.e., Australia, in this analysis). This would be an essential consideration when applying these criteria for decision-making.
What the criteria (both original and expanded) fail to do with any great degree of accuracy is differentiate introduced and cryptogenic species. Given the very definition of cryptogenic, this is not surprising; however, one would expect that an equal lack of differentiation should be observed between native and cryptogenic. This may suggest that the use of cryptogenic by experts to define a priori status does not comply with
Carlton’s (1996)intent, but is largely restricted to those species that are “thought to be introduced, but there is insufficient evidence to support the supposition.” While we acknowledge that application of the criterion-based approach requires a certain threshold level of information and without this information a species’ status cannot be easily ascertained and we concur with
Carlton (1996)use of the term cryptogenic in these situations. But this approach also has subsequent implications—given the operational use of the term “cryptogenic,” assigning a species implies that it is “guilty” of being introduced until it is proven otherwise. This stance provides good surety for biosecurity management; however it may be problematic for biodiversity management, where a rare species would inadvertently be considered introduced until proof exists otherwise.
The alternative, and currently applied stance, is that all species are “innocent until proven guilty,” which places the burden of proof onto scientists or managers to demonstrate that a species is introduced. In such circumstances, the time spent to prove an introduction may work against a control effort. For example, the late identification ofAsterias amurensisin Tasmania led to a situation where eradication could not occur, with control of the species being impractical (and believed to be impossible) once it was decided that the sea star was introduced. Thus, both of these stances have positive and negative aspects that need further elucidation. These stances may be better resolved via the operational regulatory frameworks in place within a country that consider the trade-offs required when making a biosecurity decision (e.g.,Campbell et al., 2009; Dahlstrom et al., 2011).
with both parameters being significantly interlinked thus biasing the weightings and subsequent analyses. While taxonomy and biogeography are inter-related, the criteria allow for a clear accumulation of weight of evidence rather than a definitive determination.
These criticisms suggest that application of the criteria remains a critical aspect of their utility. Subjective assessments to categorize each of the various criteria may best be supported by an agreed suite of exemplars to aid application. The identified failure of the original criteria to provide a definitive differentiation between endemic native and introduced species was not observed in our assessment of bryozoans using the expanded criteria. As illustrated in Figure 2B, the expanded criteria differentiate introduced and cryptogenic species from native species for the suite of bryozoans in Australia. The majority of native species fail to meet many of the criteria and aggregate distinctively and separately from the introduced and cryptogenic species (Figure 3).
Testing Criterion 14
We could not assess criterion 14 using the Bryozoa test case taxa group. Obviously, this criterion needs further study to statistically validate its usefulness. We consider examples from a number of species which validate this criterions inclusion. For example, the seagrass Halophila johnsoniiis most likely an introduction ofHalophila ovalis. We did not examine different seagrasses in this paper, and hence we have refrained from postulating about seagrasses. Instead, we feel that criterion 14 should be included within assessments of a species’ status acknowledging that the criterion may not always be assessed.
CONCLUSIONS
It is widely acknowledged that to effectively eradicate or control an introduced marine species requires a rapid response. We present a rapid response decision tree that is underpinned by a set of expanded criteria that help determine if a newly detected species is introduced, cryptogenic or native. Armed with the rapid response decision tree and the expanded criteria, biosecurity managers can make important decisions on whether
to proceed with attempting to manage (including eradicate) a species. The expanded criteria presented in this paper enable the differentiation between a native species and a cryptogenic or introduced species in most instances. As such, the expanded criteria provide a transparent tool that biosecurity management can use in a consistent manner to determine a species status when a “new” and potentially introduced species is detected. The differentiation between introduced and cryptogenic species adds complexity and is a difficult task that the criteria did not adequately address (original: 28.57% correct; expanded: 47.62% correct). This is further complicated by the flow-on effects that this may represent to biodiversity managers, such as the eradication of rare or threatened species. Further research into effective criterion that can differentiate between cryptogenic and introduced species is needed to improve certainty around whether a species is introduced or may in fact be a native.
AUTHOR CONTRIBUTIONS
MC and CH developed and implemented the method and study described. MC, CH, and KL analyzed and interpreted the data, and wrote the manuscript text. MC, CH, and KL prepared all Figures. All authors reviewed and edited the manuscript.
ACKNOWLEDGMENTS
MC would like to thank individuals involved in the GloBallast Phase I project whose lively discussions motivated this paper many years ago. This manuscript has greatly benefited from discussions that have occurred over the years with colleagues at the Smithsonian Environmental Research Center (SERC), NIWA, and the New Zealand Ministry of Primary Industries biosecurity teams.
SUPPLEMENTARY MATERIAL
The Supplementary Material for this article can be found online at: https://www.frontiersin.org/articles/10.3389/fmars. 2018.00331/full#supplementary-material
REFERENCES
Agnostini, V., Briones, E. E., Cresswell, I., Gjerde, K., Niewijk, D. J. A., Polacheck, A., et al. (2008). “Draft Global Open Oceans and Deep-Sea Habitats (GOODS) bioregional classification,” in Scientific Experts Workshop on Biogeographic Classification Systems in Open Oceans and Deep Seabed Areas Beyond National Jurisdiction(Mexico: CBD COP-9 Workshop).
Amini, Z. Z., Adabi, M. H., Burrett, C. F., and Quilty, P. G. (2004). Bryozoan distribution and growth form associations as a tool in environmental interpretation, Tasmania, Australia.Sedim. Geol.167, 1–15. doi: 10.1016/j.sedgeo.2004.01.010
Anderson, L. W. J. (2005). California’s reaction to Caulerpa taxifolia: a model for invasive species rapid response. Biol. Invasions 7, 1003–1016. doi: 10.1007/s10530-004-3123-z
Andow, D. A. (2003). “Pathways-based risk assessment of exotic species invasions,” inBioinvasions: Pathways, Vectors, and Management Strategies, eds G. M. Ruiz and J. T. Carlton (Washington DC: Island Press), 439–455.
Barnes, D. K. A., and Griffiths, H. J. (2008). Biodiversity and biogeography of southern temperate and polar bryozoans.Global Ecol. Biogeogr.17, 84–99. doi: 10.1111/j.1466-8238.2007.00342.x
Blackburn, T. M., Essl, F., Evans, T., Hulme, P. E., Jeschke, J. M., Kuhn, I., et al. (2014). A unified classification of alien species based on the magnitude of their environmental impacts. PLoS Biol. 12:e1001850. doi: 10.1371/journal.pbio.1001850
Bock, P. E. (1982). “Bryozoans (Phylum Bryozoa or Ectoprocta),” inMarine invertebrates of Southern Australia. Part I. eds S. A. Shepherd and I. M. Thomas (Adelaide, SA: South Australian Government Printer), 319–394.
Boudouresque, C. F., and Verlaque, M. (2002). Biological pollution in the Mediterranean Sea: invasive versus introduced species.Mar. Pollut. Bull.44, 32–38. doi: 10.1016/S0025-326X(01)00150-3
Breiman, L., Friedman, J., Olshen, R., and Stone, C. (1984).Classification and Regression Trees. Belmont, WA: Wadsworth.
Campbell, M. L. (2003a). “Training and capacity building, lessons, future needs and directions for the International Maritime Organisations GloBallast Port Survey Program,” in1st International Workshop on Guidelines & Standards for Invasive Aquatic Species Surveys & Monitoring(Arraial do Cabo), 13–17.
Campbell, M. L. (2003b).Introduced Species Port Baseline Survey.Geraldton, WA. Prepared by Corporate Process Management, Perth, for the Geraldton Port Authority.
Campbell, M. L. (2008). “An overview of risk assessment in a marine biosecurity context,” in Marine bioinvasions. Ecology, Conservation, and Management Perspectives, eds G. Rilov and J. Crooks (Dordrecht: Kluwer Academic Publishers), 353–373.
Campbell, M. L. (2011). Assessing biosecurity risk associated with the importation of microalgae.Environ. Res.111, 989–998. doi: 10.1016/j.envres.2011.02.004 Campbell, M. L., Gould, B., and Hewitt, C. L. (2007). Survey evaluations
to assess marine bioinvasions. Mar. Pollut. Bull. 55, 360–378. doi: 10.1016/j.marpolbul.2007.01.015
Campbell, M. L., Grage, A., Mabin, C., and Hewitt, C. L. (2009). Conflict between international treaties: failing to mitigate the effects of introduced marine species.Dialogue28, 46–56.
Campbell, M. L., Hewitt, C. L., and Miles, J. (2016). Marine pests in paradise: capacity building, awareness raising and preliminary introduced species port survey results in the Republic of Palau. Manage. Biol. Invasions7, 351–363. doi: 10.3391/mbi.2016.7.4.05
Campbell, M. L., Hewitt, C. L., and Nair, R. (2004).Inshore Marine Ecosystems – Bryozoa. II. Australia. Technical report prepared by Corporate Process Management, ABRS, Perth. Canberra, ACT.
Campbell, M. L., King, S., Heppenstall, L. D., van Gool, E., Martin, R., and Hewitt, C. L. (2017). Aquaculture and urban marine structures facilitate native and non-indigenous species transfer through generation and accumulation of marine debris. Mar. Pollut. Bull. 123, 304–312. doi: 10.1016/j.marpolbul.2017.08.040
Campbell, M. L., Nair, R., and Hewitt, C. L. (2003). Xenodiversity of the marine bryozoan fauna in Australian waters. Records of the South Australian Museum. Monogr. Ser.7, 31–37.
Cariton, J. T., and Geller, J. B. (1993). Ecological roulette: the global transport of nonindigenous marine organisms.Science261, 78–82.
Carlton, J. T. (1996). Biological invasions and cryptogenic species.Ecology77, 1653–1655. doi: 10.2307/2265767
Carlton, J. T., Geller, J. B., Reaka-Kudha, M. L., and Norse, E. A. (1999). Historical extinctions in the sea. Annu. Rev. Ecol. Syst. 30, 515–538. doi: 10.1146/annurev.ecolsys.30.1.515
Castilla, J. C., Uribe, M., Bahamonde, N., Clarke, M., Desqueyroux-Faundez, R., Kong, I., et al. (2005). Down under the southeastern Pacific: marine non-indigenous species in Chile. Biol. Invasions 7, 213–232. doi: 10.1007/s10530-004-0198-5
Chapman, J. W., and Carlton, J. T. (1991). A test of criteria for introduced species: the global invasion by the isopodSynidotea laevidorsalis(Miers, 1881).J. Crustac. Biol.11, 386–400. doi: 10.2307/1548465
Chapman, J. W., and Carlton, J. T. (1994). Predicted discoveries of the introduced isopod Synidotea laevidorsalis(Miers, 1881).J. Crustac. Biol. 14, 700–714. doi: 10.2307/1548863
CIESM (2002). “Alien marine organisms introduced by ships in the Mediterranean and Black Seas,” inMonaco: CIESM Workshop Monographs No 20(Monaco: CIESM. The Mediterranean Science Commission).
Cliff, N., and Campbell, M. L. (2012). Perception as a tool to inform aquatic biosecurity risk assessments. Aquat. Invasions 7, 387–404. doi: 10.3391/ai.2012.7.3.010
Cohen, A. N., and Carlton, J. T. (1995).Non-indigenous Aquatic Species in a United States Estuary: A Case Study of the Biological Invasions of the San Francisco Bay and Delta. Washington DC: Report to US Fish and Wildlife Service.
Coles, S. L., DeFelice, R. C., Eldredge, L. G., and Carlton, J. T. (1999). Historical and recent introductions of non-indigenous marine species into Pearl Harbor, Oahu, Hawaiian Islands.Mar. Biol.135, 147–158. doi: 10.1007/s002270050612 Concepcion, G. T., Kahng, S. E., Crepeau, M. W., Franklin, E. C., Coles, S. L., and Toonen, R. J. (2010). Resolving natural ranges and marine invasions in a globally distributed octocoral (genusCarijoa).Mar. Ecol. Prog. Ser.401, 113–127. doi: 10.3354/meps08364
Coutts, A. D. M., and Forrest, B. M. (2007). Development and application of tools for incursion response: lessons learned from the management of the fouling pestDidemnum vexillum.J. Exp. Mar. Biol. Ecol.342, 154–162. doi: 10.1016/j.jembe.2006.10.042
Cranfield, H. J., Gordon, D. P., Willan, R. C., Marshall, B. A., Battershill, C. N., Francis, M. P., et al. (1998).Adventive Marine Species in New Zealand. Wellington: NIWA Technical Report 34. Available online at: http://docs.niwa. co.nz/library/public/NIWAtr34.pdf (Accessed May, 1 2018).
Dahlstrom, A., Hewitt, C. L., and Campbell, M. L. (2011). A review of international, regional and national biosecurity risk assessment frameworks.Mar. Policy35, 208–217. doi: 10.1016/j.marpol.2010.10.001
de Araujo Bumbeer, J., and da Rocha, R. M. (2012). Detection of introduced sessile species on the near shore continental shelf in southern Brazil.Zoologia29, 126–134. doi: 10.1590/S1984-46702012000200005
Eldredge, L. C., and Carlton, J. T. (2002). Hawaiian marine bioinvasions: a preliminary assessment.Pac. Sci.56, 211–212. doi: 10.1353/psc.2002.0012 Floerl, O., Inglis, G. J., and Hayden, B. (2005). A risk-based predictive tool to
prevent accidental introductions of nonindigenous marine species.Environ. Manage.35, 765–778. doi: 10.1007/s00267-004-0193-8
Galil, B., Froglia, C., and Noël, P. (2002).CIESM Atlas of Exotic Species in the Mediterranean. Monaco: CIESM Publishers.
Geller, J. B., Darling, J. A., and Carlton, J. T. (2010). Genetic perspectives on marine biological invasions. Ann. Rev. Mar. Sci. 2, 367–393. doi: 10.1146/annurev.marine.010908.163745
Glasby, T. M., Connell, S. D., Holloway, M. G., and Hewitt, C. L. (2007). Nonindigenous biota on artificial structures: could habitat creation facilitate biological invasions?Mar. Biol.151, 887–895. doi: 10.1007/s00227-006-0552-5 Godwin, L. S. (2003). Hull fouling of maritime vessels as a pathway for marine species invasions to the Hawaiian Islands.Biofouling 9, 123–131. doi: 10.1080/0892701031000061750
Gollasch, S. (1996).Untersuchungen des Arteintrages Durch den Internationalen Schiffsverkehr Unter Besonderer Berücksichtigung Nichtheimischer Arten. Ph.D. thesis, University of Hamburg.
Gollasch, S. (2002). The importance of ship hull fouling as a vector of species introductions into the North Sea. Biofouling 18, 105–121. doi: 10.1080/08927010290011361
Gordon, D. P. (1999). “Bryozoan diversity in New Zealand and Australia,” inThe Other 99%. The Conservation and Biodiversity of Invertebrates, eds W. Ponder and D. Lunney (Mosman: Royal Zoological Society of New South Wales), 32–37.
Gray, J. S. (1997). Marine biodiversity: patterns, threats and conservation needs. Biodivers. Conserv.6, 153–175. doi: 10.1023/A:1018335901847
Hageman, S. J., James, N. P., and Bone, Y. (2000). Cool-water carbonate production from epizoic bryozoans on ephemeral substrates.Palaios15, 33–48. doi: 10. 1669/0883-1351(2000)015<0033:CWCPFE>2.0.CO;2
Hayes, K. R., and Sliwa, C. (2003). Identifying potential marine pests–a deductive approach applied to Australia. Mar. Pollut. Bull. 46, 91–98. doi: 10.1016/S0025-326X(02)00321-1
Hewitt, C. L. (2002). The distribution and diversity of tropical Australian marine bio-invasions.Pac. Sci.56, 213–222. doi: 10.1353/psc.2002.0016
Hewitt, C. L., and Campbell, M. L. (2001). The Australian distribution of the introduced sphaeromatid isopod,Paracerceis sculpta.Crustaceana74, 925–936. doi: 10.1163/15685400152682674
Hewitt, C. L., Campbell, M. L., Moore, K. M., Murfet, N. B., and McEnnulty, F. (2000).Introduced Species Survey of Fremantle, Western Australia. A report for the Fremantle Port Authority. Hobart, TAS: CRIMP,CSIRO Marine Research. Hewitt, C. L., Campbell, M. L., Thresher, R. E., and Martin, R. B. (eds.). (1999). The Introduced Species of Port Phillip Bay, Victoria.Hobart, TAS: Centre for Research on Introduced Marine Pests Technical Report No. 20. CSIRO Marine Research. Available online at : https://publications.csiro.au/rpr/pub?list=BRO& pid=procite:aa957857-37e0-49f9-9c0c-c7fb775729b1 (Accessed May, 1 2018). Hewitt, C. L., Campbell, M. L., Thresher, R. E., Martin, R. B., Boyd, S., Cohen, B. F.,
et al. (2004). Introduced and cryptogenic species in Port Phillip Bay, Victoria, Australia.Mar. Biol.144, 183–202. doi: 10.1007/s00227-003-1173-x. Hewitt, C. L., Gibbs, P., Campbell, M. L., Moore, K. M., and Murfet, N. B. (1997a).
Introduced Species Survey of Eden and Twofold Bay, New South Wales. A report for the New South Wales Office of Marine Affairs. Hobart, TAS: CRIMP, CSIRO Division of Fisheries.
the South Australian Ports Corporation. Hobart, TAS, CRIMP, CSIRO Marine Research.
Hewitt, C. L., and Hayes, K. R. (2002). “Risk assessment of marine biological invasions,” inInvasive Aquatic Species of Europe: Distribution, Impact and Management, eds E. Leppäkoski, S. Gollasch, and S. Olenin (Dordrecht: Kluwer Academic Publishers), 456–466.
Kelleher, G., Bleakley, C., and Wells, S. (1995).A Global Representative System of Marine Protected Areas, Vol. 1–4.Washington DC: The Great Barrier Reef Marine Park Authority, The World Bank and, The World Conservation Union (IUCN).
Kelly, M., Hooper, J., Paul, V., Paulay, G., Van Soest, R., and de Weerdt, W. (2003). Taxonomic inventory of the sponges (Porifera) of the Mariana Islands. Micronesia35–36, 100–120.
Leonard, K., Hewitt, C. L., Campbell, M. L., Primo, C., and Miller, S. D. (2017). Epibiotic pressure contributes to biofouling invader success.Sci. Rep.17:5173. doi: 10.1038/s41598-017-05470-2
Leppäkoski, E., Gollasch, S., and Olenin, S. (eds.). (2002). Invasive Aquatic Species of Europe - Distribution, Impact and Management.Dordrecht: Kluwer Academic Publishers.
Levings, C. D., Cordell, J. R., Ong, S., and Piercey, G. E. (2004). The origin and identity of invertebrate organisms being transported to Canada’s Pacific coast by ballast water.Can. J. Fisheries Aquat. Sci.61, 1–11. doi: 10.1139/f03-135 Mackie, J. A., Darling, J. A., and Geller, J. B. (2012). Ecology of cryptic invasions:
latitudinal segregation amongWatersipora(Bryozoa) species.Sci. Rep.2:871. doi: 10.1038/srep00871
Mackie, J. A., Keough, M. J., and Christidis, L. (2006). Invasion patterns inferred from cytochrome oxidase I sequences in three bryozoans,Bugula neritina, Watersipora subtorquata, andWatersipora arcuata.Mar. Biol.149, 285–295. doi: 10.1007/s00227-005-0196-x
May, R. M. (1992). Bottoms up for the oceans. Nature 357, 278–279. doi: 10.1038/357278a0
McKinney, F. K. (1986). Historical record of erect bryozoan growth forms.Proc. R. Soc. B Biol. Sci.228, 133–149. doi: 10.1098/rspb.1986.0047
Menzies, R. J., and Miller, M. A. (1972). “Systematics and zoogeography of the genus Synidotea (Crustacea: Isopoda) with an account of California species,” in Smithsonian Contributions to Zoology, 1–33. Available online at: https://repository.si.edu/bitstream/handle/10088/5267/SCtZ-0102-Lo_res. pdf?sequence=2&isAllowed=y (Accessed May 1, 2018).
Occhipinti-Ambrogi, A., and Galil, B. S. (2004). A uniform terminology on bioinvasions: a chimera or an operative tool?Mar. Pollut. Bull.49, 688–694. doi: 10.1016/j.marpolbul.2004.08.011
Occhipinti-Ambrogi, A., and Savini, D. (2003). Biological invasions as a component of global change in stressed marine ecosystems.Mar. Pollut. Bull. 46, 542–551. doi: 10.1016/S0025-326X(02)00363-6
Ojaveer, H., Galil, B. S., Campbell, M. L., Carlton, J. T., Canning Clode, J., Cook, E., et al. (2015). Classification of non-indigenous species based on their impacts: the marine perspective. PLoS Biol. 13:e1002130. doi: 10.1371/journal.pbio.1002130
Orensanz, J. M., Schwindt, E., Pastorino, G., Bortolus, A., Casas, G., Darrigran, G., et al. (2002). No longer the pristine confines of the world ocean: a survey of exotic marine species in the southwestern Atlantic.Biol. Invasions4, 115–143. doi: 10.1023/A:1020596916153
Pimentel, D., McNair, S., Janecka, J., Wightman, J., Simmonds, C., O’Connell, C., et al. (2001). Economic and environmental threats of alien plant, animal, and microbe invasions. Agric. Ecosyst. Environ. 84, 1–20. doi: 10.1016/S0167-8809(00)00178-X
Piola, R. F., Dafforn, K. A., and Johnston, E. L. (2009). The influence of antifouling practices on marine invasions. Biofouling 25, 633–644. doi: 10.1080/08927010903063065
Pociecha, A., Solarz, W., Najberek, K., and Wilk-Wozniak, E. (2016). Native, alien, cosmopolitan, or cryptogenic? A framework for clarifying the origin status of rotifers. Aquat. Biol.24, 141–149. doi: 10.3354/ab00644
Pollard, D. A., and Hutchings, P. A. (1990a). A review of exotic marine organisms introduced to the Australian Region. I. Fishes.Asian Fish. Sci.3, 205–221. Pollard, D. A., and Hutchings, P. A. (1990b). A review of exotic marine organisms
introduced to the Australian Region. II. Invertebrates and algae.Asian Fish. Sci. 3, 223–250.
Ribera, M. A., and Boudouresque, C. F. (1995). “Introduced marine plants, with special reference to macroalgae: mechanisms and impact,” inProgress in
Phycological Research,Vol. 11, eds F. E. Round and D. J. Chapman (Bristol: Biopress Ltd.), 187–268.
Ripley, D. B. (1996). Pattern Recognition and Neural Networks. Cambridge: Cambridge University Press.
Ryland, J. S. (1977). Physiology and ecology of marine bryozoans.Adv. Mar. Biol. 14, 285–443. doi: 10.1016/S0065-2881(08)60449-6
Simberloff, D. (2003). How much information on population biology is needed to manage introduced species? Conserv. Biol. 17, 83–92. doi: 10.1046/j.1523-1739.2003.02028.x
Smith, A. M. (1995). Palaeoenvironmental interpretation using bryozoans: a review.Geol. Soc. Lond.83, 231–243.doi: 10.1144/GSL.SP.1995.083.01.11 Tavares, M., and de Melo, G. A. S. (2004). Discovery of the first known
benthic invasive species in the Southern Ocean: the north Atlantic spider crab Hyas araneusfound in the Antarctic Peninsula.Antarctic Sci.16, 129–131. doi: 10.1017/S0954102004001877
Tilbrook, K. J. (2012). Bryozoa,Cheilostomata: first records of two invasive species in Australia and the northerly range extension for a third.Check List8, 181–183. doi: 10.15560/8.1.181
Toft, J. D., Cordell, J. R., and Fields, W. C. (2002). New records of crustaceans (amphipoda, isopoda) in the Sacramento/San Joaquin Delta, California, and application of criteria for introduced species.J. Crustac. Biol.22, 190–200. doi: 10.1163/20021975-99990222
Vierros, M., Cresswell, I., Briones, E. E., Rice, J., and Ardron, J. (2008). Global Open Oceans and Deep Sea–Habitats (GOODS) Bioregionalisation Classification.Draft Report to UNEP Convention on Biological Diversity, from the Subsidiary Body on Scientific, Technical and Technological Advice. UNEP/CBD/SBSTTA/13/INF/19. Available online at: http://unesdoc.unesco. org/images/0018/001824/182451e.pdf (Accessed May, 1 2018).
Vierros, M., Cresswell, I., Briones, E. E., Rice, J., and Ardron, J. (2009). Global Open Oceans and Deep Seabed (GOODS) Biogeographic Classification. UNESCO. Available online at: https://www.iode.org/index.php?option=com_ oe&task=viewDocumentRecord&docID=3931 (Accessed May 1, 2018). Visa, S., Ramsay, B., Ralescu, A., and van der Knaap, E. (2011). “Confusion
matrix-based feature selection,” inProceedings of the 22nd Midwest Artificial Intelligence and Cognitive Science Conference (MAICS’11)(Cincinnati, OH), 120–127.
Wasson, K., Zabin, C. J., Bedinger, L., Diaz, M. C., and Pearse, J. S. (2001). Biological invasions of estuaries without international shipping: the importance of intraregional transport. Biol. Conserv. 102, 143–153. doi: 10.1016/S0006-3207(01)00098-2
Willan, R. C., Russell, B. C., Murfet, N. B., Moore, K. L., McEnnulty, F. R., Horne, S. K., et al. (2000). Outbreak of Mytilopsis sallei (Recluz, 1849) (Bivalvia: Dreissenidae) in Australia. Molluscan Res. 20, 25–30. doi: 10.1080/13235818.2000.10673730
Williams, S. L., and Grosholz, E. D. (2008). The invasive species challenge in estuarine and coastal environments: marrying management and science. Estuaries Coasts31, 3–20. doi: 10.1007/s12237-007-9031-6
Williamson, M. (1996).Biological Invasions. London: Chapman and Hall. Xavier, R., Santos, A. M., Lima, F. P., and Branco, M. (2009). Invasion
or invisibility: using genetic and distributional data to investigate the alien or indigenous status of the Atlantic populations of the peracarid isopod, Stenosoma nadejda. Mol. Ecol. 18, 3283–3290. doi: 10.1111/j.1365-294X.2009.04260.x
Zaitsev, Y., and Mamaev, V. (1997).Marine Biological Diversity in the Black Sea. A Study of Change and Decline.New York, NY: United Nations Publications. Zaitsev, Y. P., and Alexandrov, B. G. (1998).Black Sea Biological Diversity, Ukraine.
New York, NY: United Nations Publications.
Conflict of Interest Statement: The authors declare that the research was
conducted in the absence of any commercial or financial relationships that could be construed as a potential conflict of interest.