Rochester Institute of Technology
RIT Scholar Works
Theses
Thesis/Dissertation Collections
2004
Experimental investigation of surface roughness
microstructures and their effects on pressure drop
characteristics in rectangular minichannels
Derek J. Schmitt
Follow this and additional works at:
http://scholarworks.rit.edu/theses
This Thesis is brought to you for free and open access by the Thesis/Dissertation Collections at RIT Scholar Works. It has been accepted for inclusion
in Theses by an authorized administrator of RIT Scholar Works. For more information, please contact
Recommended Citation
EXPERIMENTAL INVESTIGATION OF SURFACE
ROUGHNESS MICROSTRUCTURES AND THEIR EFFECTS
ON PRESSURE DROP CHARACTERISTICS IN
RECTANGULAR MINI CHANNELS
by
Derek J. Schmitt
A Thesis Submitted in
Partial Fulfillment of the
Requirement for the
MASTER OF SCIENCE
IN
MECHANICAL ENGINEERING
Approved by:
Dr. Satish G. Kandlikar
Satish G. Kandlikar
Department of Mechanical Engineering
(Thesis Advisor)
Dr. James B. Taylor
James B. Taylor
Department of Industrial & Systems Engineering
Dr. Andres
L.
Carrano
Andres L. Carrano
Department of Industrial
&
Systems Engineering
Dr. Jeffrey D. Kozak
Jeffrey D. Kozak
Department of Mechanical Engineering
Dr. Edward C. Hensel
Edward Hensel
Department Head of Mechanical Engineering
DEPARTMENT OF MECHANICAL ENGINEERING
ROCHESTER INSTITUTE OF TECHNOLOGY
THESIS REPRODUCTION PERMISSION STATEMENT
Title of Thesis: Experimental Investigation of Surface Roughness Microstructures and
Their EtTects on Pressure Drop Characteristics in Rectangular Minichannels
I, Derek J. Schmitt, hereby grant permission of to the Wallace Library of the Rochester
Institute of Technology to reproduce my thesis in whole or in part. Any reproduction will
not be for commercial use or profit.
ACKNOWLEDGEMENTS
First
and
foremost,
I
would
like
to
thank
my
family
for
their
continuous
support
and
encouragement.
I
owe all
that
I
have
achieved
to you,
for
without your
years of
dedication,
love
and
support,
and constant
sacrifice,
I
would
have
never
had
the
chance
to
succeed.
Thank
you.
Next,
I
would
like
to thank
Dr. Kandlikar for
helping
me
through this
arduous
task, for
never
loosing
his
patience and
his
constant
guidance.
I
would also
like
to thank
everyone
that
I
worked with
in
the
Thermal Analysis
and
Microfluidics
Lab,
-especially
Mark
and
Levi for
your
help
and
insight.
In
addition
to the
TAMFL,
Dr. Taylor
and
Dr.
Carrano
from
the
industrial
and
systems
engineering department have been instrumental in
the
fabrication
of
the
roughness
inserts
as
well
as
measuring
the
base
of
the
minichannels
and
introducing
surface
roughness
descriptors.
I
would
also
like
to thank
Dave
Hathaway
and
Steve Kosciol
for
help
in
the
shop
and with
ordering
parts.
Finally,
I
want
to
thank
Julie for
always
being
there
for
me.
You
were
there
when
I
needed
ABSTRACT
A
literature
review
has been
conducted on pressure
drop
in
mini/microchannels
to
evaluate
major
discrepancies
in
experimental work
dealing
with pressure
drop
in
these
small passages.
The
aim of
the
present work
is
to
investigate
the
effects of surface roughness elements on
pressure
drop
in
minichannels
in
an
effort
to
determine if
conventional
friction
factor
equations are valid
in
predicting
the
friction factor in
minichannels.
In
the
present
work,
an
experimental
study is
carried out
to
investigate
the
effects of surface
roughness on air and
water
flow
through
rectangular channels with
hydraulic diameters ranging from
325um
to
1819pm.
Smooth
surface conditions are
tested
over
a range of
Reynolds
numbers
from 199
to
7206.
Friction
factors
are calculated
and compared
to
theoretical
laminar
and
turbulent
friction
factor
values
to
validate
the test
section.
The
effect
of roughness
orientation
is
studied
by
using
a repeated roughness
feature
in
(i)
aligned sawtooth roughness profile and
(ii)
offset
sawtooth
roughness
profile
on
the
two
sides
of
a
10mm
wide
rectangular
minichannel.
The
roughness profile
test
setup
consists of a rectangular
minichannel,
with
its
two
sides
featuring
a
repeating
roughness profile.
The
aligned sawtooth roughness profile
will
have
the
roughness elements
lined up
peak
to peak,
while
the
offset sawtooth roughness
profile will
have
the
roughness elements
lined up
peak
to trough.
Results
show
that
aligned
peak
to
peak
roughness
yields
friction factors higher
than
the
offset
peak
to
trough
TABLE
OF CONTENTS
Acknowledgements
iii
Abstract
iv
List
of
Tables
vii
List
of
Figures
x
List
of
Symbols
xiv
1.0 Introduction
1
2.0
Literature
Review
3
2.1
Objectives
13
3.0 Experimental
Setup
14
3.1 Introduction
14
3.2
Test
Setup
Using
Compressed Air
14
3.3 Test
Setup
Using Deionized,
Degassed Water
15
3.4
Measuring
Pressure
16
3.5 Roughness Characterization
17
3.6 Determination
of
Surface
Roughness
19
3.7
Roughness Inserts
20
3.8
Test
Section
23
3.9
Data
Acquisition
24
4.0 Calibration
25
4.1 Thermocouple
Calibration
25
4.2 Pressure Transducer
Calibration
25
5.0
Experimental Procedure
26
5.1
Airflow
Supply
26
5.2
Water
Supply
26
5.3 Test Procedure
26
5.4 Leak Elimination
27
6.0 Error Analysis
28
7.0 Data
Reduction
29
8.1 Results for Air
33
8.2 Results for Water
55
8.3
Summary
of
Discussion
on
Results
with
Air
and
Water
75
9.0
Conclusions
77
References
79
Appendix
A
-Raw Pressure
Data,
Smooth
Channel,
Air
83
Appendix
B
-Raw Pressure
Data,
Aligned Sawtooth
Roughness
Configuration,
Air
89
Appendix C
-Raw Pressure
Data,
Offset
Sawtooth
Roughness
Configuration,
Air
92
Appendix
D
-Raw
Pressure
Data,
Smooth
Channel,
Water
95
Appendix E
-Raw Pressure
Data,
Aligned Sawtooth
Roughness
Configuration,
Water
100
Appendix
F
-Raw Pressure
Data,
Offset Sawtooth
Roughness
Configuration,
Water
103
Appendix G
-Calibration
Data
106
Appendix
H
-Test
LIST
OF TABLES
Table 2.1
-Summary
of
Relevant
Studies in Mini
and
MicroChannel Pressure
Drop
....8
Table 3.1
-Pressure
Tap
Location
With
Respect
to
Inlet Plenum
16
Table 3.2
-Roughness Parameters
20
Table 8.1
-Critical Reynolds Numbers
for Rough
Channels,
Air
54
Table 8.2
-Critical Reynolds Numbers
for Rough
Channels,
Water
74
Table A.l
-Raw
Pressure
Data, Gage, kPa,
Smooth
Channel, Air, Dh=325um,
b=165um,
w=10.03mm
83
Table
A.2
-Raw Pressure
Data, Gage, kPa,
Smooth
Channel, Air, Dh=383um,
b=200um,
w=10.03mm
83
Table
A.3
-Raw
Pressure
Data, Gage, kPa,
Smooth
Channel, Air, Dh=507um,
b=260um,
w=10.03mm
84
Table
A.4
-Raw Pressure
Data, Gage,
Smooth
Channel, Air, Dh=583um,
b=300um,
w=10.03mm
84
Table
A.5
-Raw Pressure
Data, Gage, kPa,
Smooth
Channel, Air,
Dh=769um,
b=400um,
w=10.03mm
85
Table
A.6
-Raw Pressure
Data,
Gage, kPa,
Smooth
Channel,
Air, Dh=861um,
b=450pm,
w=10.03mm
85
Table A.7
-Raw Pressure
Data,
Gage, kPa,
Smooth
Channel, Air,
Dh=953um,
b=500um,
w=10.03mm
86
Table
A.8
-Raw
Pressure
Data, Gage, kPa,
Smooth
Channel, Air,
Dh=1203um,
b=640um,
w=10.03mm
86
Table
A.9
-Raw
Pressure
Data, Gage,
kPa,
Smooth
Channel, Air,
Dh=1378um,
b=740um,
w=10.03mm
87
Table
A.10
-Raw Pressure
Data, Gage, kPa,
Smooth
Channel, Air, Dh=1525um,
b=825um,
w=10.03mm
87
Table
A.ll
-Raw Pressure
Data,
Gage, kPa,
Smooth
Channel, Air, Dh=1819um,
b=1000um,
w=10.03mm
88
Table B.l
-Raw Pressure
Data, Gage, kPa,
Aligned
Roughness, Air, Dh=769um,
b=400um,
bcf=254um,
w=10.03mm
89
Table B.2
-Raw Pressure
Data,
Gage, kPa,
Aligned
Roughness, Air, Dh=953um,
b=500um, bcf=354um,
w=10.03mm
89
Table
B.3
-Raw Pressure
Data,
Gage, kPa,
Aligned
Roughness, Air, Dh=1203pm,
Table B.4
-Raw
Pressure
Data, Gage, kPa,
Aligned
Roughness, Air,
Dh=1378um,
b=740um, bcf=594um,
w=10.03mm
90
Table B.5
-Raw Pressure
Data,
Gage, kPa,
Aligned
Roughness,
Air, Dh=1525ujn,
b=830um,
bc=684um,
w=10.03mm
91
Table B.6
-Raw
Pressure
Data, Gage, kPa,
Aligned
Roughness,
Air, Dh=1819um,
b=100um, bcf=854um,
w=10.03mm
91
Table C.l
-Raw
Pressure
Data, Gage, kPa,
Offset
Roughness,
Air,
Dh=769um,
b=400um, bcf=254um,
w=10.03mm
92
Table C.2
-Raw Pressure
Data,
Gage, kPa,
Offset
Roughness,
Air, Dh=953um,
b=500um, bcl=354um,
w=10.03mm
92
Table C.3
-Raw Pressure
Data,
Gage, kPa,
Offset
Roughness, Air, Dh=1203um,
b=640um, bcf=494um,
w=10.03mm
93
Table C.4
-Raw Pressure
Data, Gage,
kPa,
Offset
Roughness, Air, Dh=1378um,
b=740um, bcf=594um,
w=10.03mm
93
Table
C.5
-Raw Pressure
Data, Gage, kPa,
Offset
Roughness, Air, Dh=1525pm,
b=830um, bc=684um,
w=10.03mm
94
Table
C.6
-Raw Pressure
Data, Gage,
kPa,
Offset
Roughness,
Air,
Dh=1819um,
b=100um, bcf=854um,
w=10.03mm
94
Table
D.l
-Raw Pressure
Data, Gage, kPa,
Smooth
Channel, Water, Dh=325um,
b=165um,
w=10.03mm
95
Table D.2
-Raw Pressure
Data, Gage, kPa,
Smooth
Channel, Water, Dh=507um,
b=260um,
w=10.03mm
95
Table D.3
-Raw Pressure
Data, Gage,
Smooth
Channel, Water, Dh=583um,
b=300um,
w=10.03mm
96
Table
D.4
-Raw Pressure
Data, Gage, kPa,
Smooth
Channel, Water, Dh=769um,
b=400u.m,
w=10.03mm
96
Table
D.5
-Raw Pressure
Data, Gage, kPa,
Smooth
Channel, Water, Dh=861um,
b=450um,
w=10.03mm
97
Table
D.6
-Raw
Pressure
Data, Gage, kPa,
Smooth
Channel, Water, Dh=953um,
b=500um,
w=10.03mm
97
Table
D.7
-Raw Pressure
Data, Gage, kPa,
Smooth
Channel, Water, Dh=1203um,
b=640um,
w=10.03mm
98
Table D.8
-Raw Pressure
Data, Gage, kPa,
Smooth
Channel, Water, Dh=1378um,
b=740um,
w=10.03mm
98
Table
D.9
-Raw Pressure
b=825um,
w=10.03mm
99
Table D.10
-Raw Pressure
Data,
Gage, kPa,
Smooth
Channel, Water, Dh=1819um,
b=1000um,
w=10.03mm
99
Table E.l
-Raw Pressure
Data,
Gage,
kPa,
Aligned
Roughness,
Water, Dh=769pm,
b=400um,
bcf=254um,
w=10.03mm
100
Table E.2
-Raw
Pressure
Data,
Gage, kPa,
Aligned
Roughness, Water, Dh=953um,
b=500um, bcf=354um,
w=10.03mm
100
Table E.3
-Raw Pressure
Data,
Gage, kPa,
Aligned
Roughness, Water, Dh=1203pm,
b=640ixm, bcf=494um,
w=10.03mm
101
Table E.4
-Raw Pressure
Data,
Gage, kPa,
Aligned
Roughness,
Water, Dh=1378um,
b=740um, bcf=594um,
w=10.03mm
,101
Table E.5
-Raw Pressure
Data,
Gage, kPa,
Aligned
Roughness, Water, Dh=1525um,
b=830um, bc=684um,
w=10.03mm
102
Table E.6
-Raw Pressure
Data,
Gage, kPa,
Aligned
Roughness, Water, Dh=1819um,
b=100um, bcf=854um,
w=10.03mm
102
Table
F.l
-Raw Pressure
Data,
Gage, kPa,
Offset
Roughness,
Water, Dh=769um,
b=400um, bcf=254um,
w=10.03mm
103
Table F.2
-Raw Pressure
Data, Gage, kPa,
Offset
Roughness, Water, Dh=953um,
b=500um, bcf=354um,
w=10.03mm
103
Table F.3
-Raw Pressure
Data,
Gage, kPa,
Offset
Roughness, Water, Dh=1203um,
b=640um,
bcf=494um,
w=10.03mm
104
Table F.4
-Raw Pressure
Data,
Gage, kPa,
Offset
Roughness, Water, Dh=1378u,m,
b=740um, bcf=594um,
w=10.03mm
104
Table
F.5
-Raw Pressure
Data,
Gage, kPa,
Offset
Roughness, Water, Dh=1525um,
b=830um, bc=684um,
w=10.03mm
105
Table
F.6
-Raw
Pressure
Data,
Gage, kPa,
Offset
Roughness, Water, Dh=1819um,
LIST
OF FIGURES
Figure 2.1
-Moody's Diagram
of
Friction Factors Based
on
Reynolds Number
and
Relative
Roughness,
Moody
(1944)
6
Figure 2.2
-Ranges
of
Channel Diameters
Employed
in
Various
Applications,
Kandlikar
(2003)
7
Figure 2.3
-FlowPatterns
Studied
by
Webb,
etal.
(1971)
9
Figure 3.1
-Experimental
Setup
Using
Air
as
the
Test Fluid
14
Figure 3.2
-Experimental
Setup Using
Water
as
the
Test
Fluid
15
Figure 3.3
-Static Pressure
Tap
16
Figure 3.4
-Absolute Pressure
Tap Setup
17
Figure 3.5
-Calculationof
Ra
and
Rq,
Carrano
(2000)
18
Figure 3.6
-p/e
Roughness
Parameters, Webb,
et al.
(1971)
19
Figure 3.7
-2-D Roughness Visualization
Using
a
Stylus Profilometer
20
Figure 3.8
-Smooth Channel
21
Figure 3.9
-Aligned Sawtooth Roughness
21
Figure
3.10
-Offset
Sawtooth
Roughness
21
Figure 3.11
-Closeup
of
Channel,
3x Magnification a) Smooth Channel
b)
Aligned
Sawtooth Roughness Channel
c)
Offset Sawtooth Roughness Channel
22
Figure 3.12
-Roughness Inserts
22
Figure
3.13
-Test Section
with
Roughness
Inserts,
Top
Plate Removed
23
Figure 3.14
-Overhead View
of
Test
Fixture,
Top
Plate Removed
24
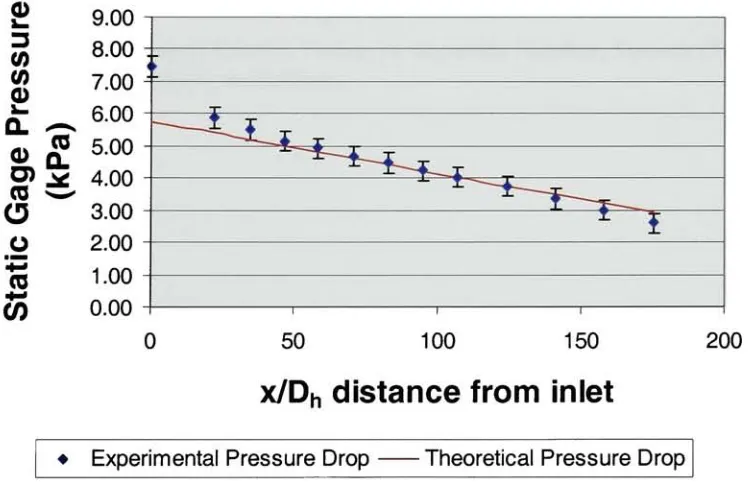
Figure 8.1
-Pressure
Drop
Along
Pipe
Axis,
Smooth
Channel,
Air,
Dh=325um,
b=165um,
w=10.03mm,
Re=2193
34
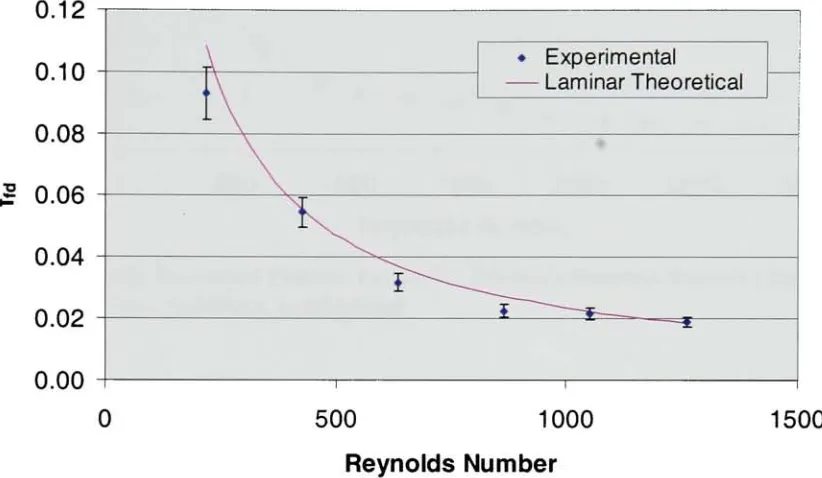
Figure 8.2
-Fully
Developed
Friction Factor Vs. Reynolds
Number,
Smooth
Channel,
Air, Dh=325pm, b=165uJm,
w=10.03mm
35
Figure
8.3
-Fully
Developed
Friction Factor Vs. Reynolds
Number,
Smooth
Channel,
Air, Dh=383um, b=200um,
w=10.03mm
35
Figure
8.4
-Fully
Developed
Friction Factor Vs. Reynolds
Number,
Smooth
Channel,
Air, Dh=507um, b=260um,
w=10.03mm
36
Figure
8.5
-Fully
Developed Friction Factor Vs. Reynolds
Number,
Smooth
Channel,
Air, Dh=583um, b=300um,
w=10.03mm
36
Figure
8.6
Figure
8.7
-Fully
Developed
Friction Factor Vs. Reynolds
Number,
Smooth
Channel,
Air,Dh=861um,b=450um,w=10.03mm
37
Figure 8.8
-Fully
Developed
Friction Factor Vs. Reynolds
Number,
Smooth
Channel,
Air, Dh=953um, b=500um,
w=10.03mm
38
Figure 8.9
-Fully
Developed
Friction Factor Vs. Reynolds
Number,
Smooth
Channel,
Air, Dh=1203um, b=640um,
w=10.03mm
38
Figure 8.10
-Fully
Developed Friction Factor Vs. Reynolds
Number,
Smooth
Channel,
Air, Dh=1378um, b=740um,
w=10.03mm
39
Figure 8.11
-Fully
Developed Friction Factor Vs. Reynolds
Number,
Smooth
Channel,
Air,Dh=1525um,b=825um,w=10.03mm
39
Figure 8.12
-Fully
Developed Friction Factor Vs. Reynolds
Number,
Smooth
Channel,
Air,Dh=1819um,b=1000um,w=10.03mm
40
Figure 8.13
-Fully
Developed Friction Factor Vs. Reynolds Number based
on:
Air,
Dh=769um, b=400um, bcf=254um,
w=10.03mm,
e/Dh=0.0910
41
Figure 8.14
-Fully
Developed Friction Factor Vs. Reynolds Number based
on:
Constricted
Flow, Air, Dh;Cf=496um, b=400um, bcf=254pm,
w=10.03mm,
e/
Dh>cf=0.1412
....42
Figure 8.15
-Fully
Developed Friction Factor Vs. Reynolds Number based
on:
Air,
Dh=953um, b=500um, bcf=354um,
w=10.03mm,
e/Dh=0.0735
43
Figure 8.16
-Fully
Developed Friction Factor Vs. Reynolds Number
based
on:
Constricted
Flow, Air,
DhjCf=684um,
b=500um, bcf=354um,
w=10.03mm,
e/
Dh,cf=0.1108
....44Figure 8.17
-Fully
Developed Friction Factor Vs. Reynolds Number based
on:
Air,
Dh=1203um,
b=640um, bcf=494um,
w=10.03mm,
e/Dh=0.0582
45
Figure
8.18
-Fully
Developed Friction Factor Vs. Reynolds Number based
on:
Constricted
Flow, Air, Dh,Cf=942um, b=640um, bcf=494um,
w=10.03mm,
e/Dh,cf=0.0812
46
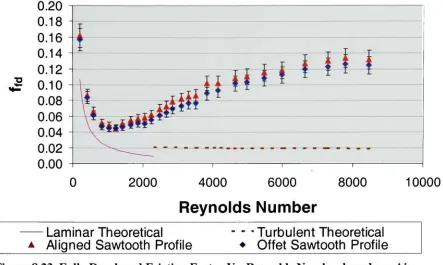
Figure 8.19
-Aligned
Sawtooth Roughness
with
Row Boundaries
47
Figure
8.20
-Offset Sawtooth Roughness
with
Flow Boundaries
47
Figure
8.21
-Fully
Developed
Friction Factor Vs. Reynolds Number based
on:
Air,
Dh=1378um, b=740um, bcf=594um,
w=10.03mm,
e/Dh=0.0529
48
Figure 8.22
-Fully
Developed Friction Factor Vs. Reynolds Number based
on:
Constricted
Flow,
Air,
Dh,Cf=l
122um,
b=740um, bcf=594um,
w=10.03mm,
e/Dh,cf=0.0650
...49
Figure
8.23
-Fully
Developed Friction Factor Vs. Reynolds Number
based
on:
Air,
Dh=1525um,
b=830um, bc=684um,
w=10.03mm,
e/Dh=0.0478
50
Figure
8.24
-Fully
Developed
Friction Factor Vs.
Reynolds
Number
based
on:
Constricted
Flow, Air,
Dh,Cf=1272um,
b=830um, bc=684um,
w=10.03mm,
e/Dh>Cf=0.0553
....51
Figure
8.25
-Fully
Developed Friction
Factor Vs. Reynolds Number based
on:
Air,
Figure
8.26
-Fully
Developed Friction Factor Vs. Reynolds Number based
on:
Constricted
Flow, Air, Dh,cf=1574um, b=100um, bcf=854um,
w=10.03mm,
e/Dh,Cf=0.0460
....53
Figure
8.27
-Pressure
Drop Along
Pipe
Axis,
Smooth
Channel, Water, Dh=1378um,
b=740um,
w=10.03mm,
Re=2026
55
Figure
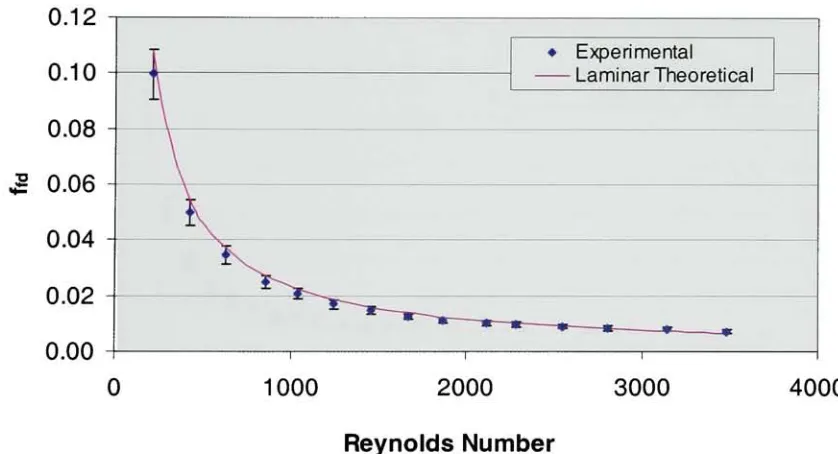
8.28
-Fully
Developed Friction Factor Vs. Reynolds
Number,
Smooth
Channel,
Water, Dh=325um, b=165um,
w=10.03mm
56
Figure 8.29
-Fully
Developed Friction Factor Vs. Reynolds
Number,
Smooth
Channel,
Water, Dh=507um, b=260um,
w=10.03mm
57
Figure 8.30
-Fully
Developed Friction Factor Vs. Reynolds
Number,
Smooth
Channel,
Water, Dh=583um, b=300um,
w=10.03mm
57
Figure 8.31
-Fully
Developed Friction Factor Vs. Reynolds
Nupiber,
Smooth
Channel,
Water, Dh=769um, b=400um,
w=10.03mm
58
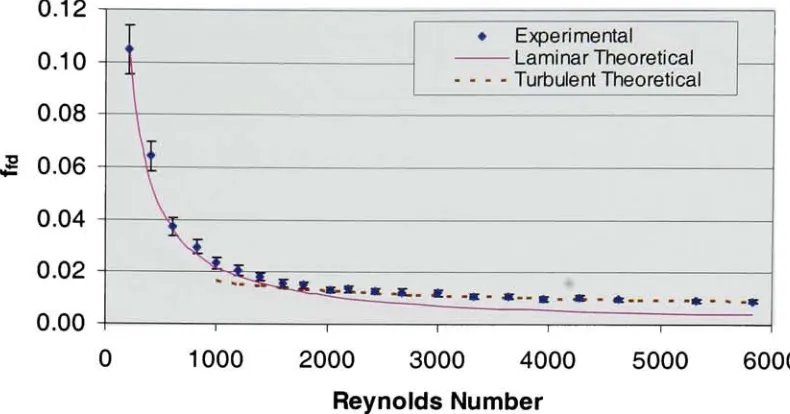
Figure 8.32
-Fully
Developed Friction Factor Vs. Reynolds
Number,
Smooth
Channel,
Water, Dh=861um, b=450um,
w=10.03mm
58
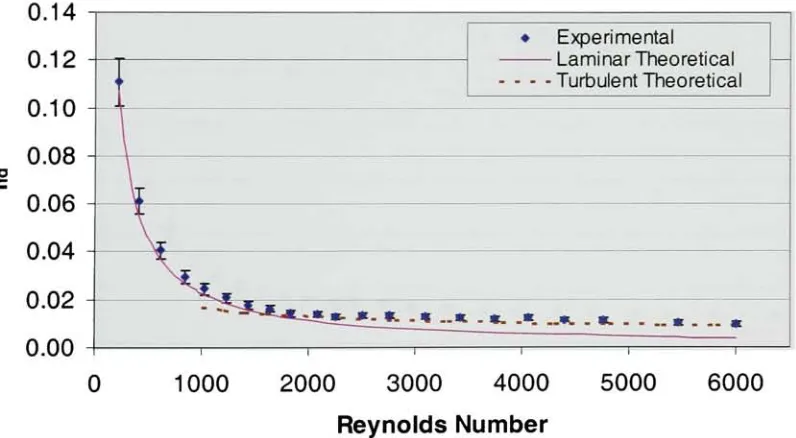
Figure 8.33
-Fully
Developed Friction Factor
Vs. Reynolds
Number,
Smooth
Channel,
Water, Dh=953um, b=500um,
w=10.03mm
59
Figure 8.34
-Fully
Developed Friction Factor Vs. Reynolds
Number,
Smooth
Channel,
Water, Dh=1203um, b=640um,
w=10.03mm
59
Figure
8.35
-Fully
Developed Friction Factor Vs. Reynolds
Number,
Smooth
Channel,
Water, Dh=1378um, b=740um,
w=10.03mm
60
Figure
8.36
-Fully
Developed Friction Factor Vs. Reynolds
Number,
Smooth
Channel,
Water, Dh=1525um, b=825um,
w=10.03mm
60
Figure
8.37
-Fully
Developed Friction Factor Vs. Reynolds
Number,
Smooth
Channel,
Water, Dh=1819um,b=1000um,
w=10.03mm
61
Figure 8.38
-Fully
Developed Friction Factor Vs. Reynolds
Number,
Water, Dh=769um,
b=400um, bcf=254um,
w=10.03mm,
e/Dh=0.0910
62
Figure
8.39
-Fully
Developed
Friction Factor Vs. Reynolds Number
based
on:
Constricted
Flow, Water, Dh,Cf=496|j,m, b=400um, bCf=254um,
w=10.03mm,
e/Dh,Cf=0.1412
63
Figure
8.40
-Fully
Developed
Friction Factor Vs. Reynolds Number
based
on:
Water,
Dh=953um,
b=500um, bcf=354um,
w=10.03mm,
e/Dh=0.0735
64
Figure
8.41
-Fully
Developed Friction Factor Vs. Reynolds Number
based
on:
Constricted
Flow, Water, Dh,Cf=684u,m, b=500u,m, bCf=354pm,
w=10.03mm,
e/Dh,Cf=0.1108
65
Figure
8.42
Figure 8.43
-Fully
Developed
Friction Factor Vs. Reynolds Number
based
on:
Constricted
Flow, Water,
Dh,Cf=942u.m,
b=640um, bcf=494u,m,
w=10.03mm,
e/DhiCf=0.0812
67
Figure
8.44
-Fully
Developed Friction Factor Vs. Reynolds Number
based
on:
Water,
Dh=1378um, b=740um, bcf=594um,
w=10.03mm,
e/Dh=0.0529
68
Figure 8.45
-Fully
Developed Friction Factor Vs. Reynolds Number
based
on:
Constricted
Flow, Water,
Dh,Cf=1122um,
b=740um, bCf=594um,
w=10.03mm,
e/Dh>cf=0.0650
69
Figure 8.46
-Fully
Developed Friction Factor Vs. Reynolds Number
based
on:
Air,
Dh=1525pm, b=830um, bcf=684um,
w=10.03mm,
e/Dh=0.0478
70
Figure 8.47
-Fully
Developed Friction Factor Vs. Reynolds Number based
on:
Constricted
Flow,
Air,
Dh,cf=
1272pm,
b=830pm, bcf=684p,m,
w=10.03mm,
e/Dh,cf=0.0553
71
Figure 8.48
-Fully
Developed Friction Factor Vs. Reynolds Number based
on:
Water,
Dh=1819pm,b=1000pm,bcf=854pm,w=10.03mm,
e/Dh=0.0401
72
Figure 8.49
-Fully
Developed Friction Factor Vs. Reynolds Number based
on:
Constricted
Flow, Water, Dh,Cf=1574um, b=1000um,
bcf=854um,
w=10.03mm,
e/Dh,cf=0.0460
73
Figure
G.l
-Calibration Curve for
0-0.25
psi
Pressure Transducer
106
Figure
G.2
-Calibration Curve
for
0-1
psi
Pressure Transducer
106
Figure
G.3
-Calibration Curve for
0-5
psi
Pressure Transducer
107
Figure
G.4
-Calibration Curve for 0-15
psi
Pressure Transducer
107
Figure
G.5
-Calibration
Curve
for 0-30
psi
Pressure Transducer
108
Figure
G.6
-Pressure Transducer Calibrator
108
Figure
H.1
=Test
Setup Including
Power
Supply,
Water
Filter,
Flow
Meters,
Test
Section,
Inlet
and
Outlet
Thermocouples
and
Pressure Manifold
1 09
Figure H.2
-National Instruments SCXI-1000 Chassis
with
SCXI-1303 32 Channel
Isothermal
Terminal Block
and
SCXI-1300 Low-Voltage Terminal Block
109
Figure H.3
-Leeson
V*
hp
Bronze Gear
Pump
with
Bypass
Loop
110
Figure
H.4
-Fisher
Scientific
Isotemp
3013
Constant Temperature Bath
with
Supply,
Return
and
Bypass Return Hoses
1 10
LIST
OF SYMBOLS
A
area,
m2b
channel
base,
m
B
bias
error
c
geometry factor
used
to
calculate/
Dh
hydraulic
diameter,
m
e
surface roughness
height
e/d
relative roughness
/
Fanning
friction
factor,
defined
by
Eq. 7.8
1
channel
length,
m
L
sample
length,
m
Le
entrance
length,
m
m
mass
flow,
kg/s
n
number of samples
P
pitch,
m
P
pressure at
any
point
x,
Pa
Pe
precision error
ppm
part per million
Pw
wetted perimeter of
the channel,
m
R
gas
constant,
J/kgK
Ra
average
roughness,
m
Re
Reynolds
number
Rku
kurtosis
of profile
Rq
root mean square
roughness,
m
Rsk
skewness of profile
Ry
maximum
height
of
profile,
m
Rz
average maximum roughness
height,
m
s
local
speed of
sound,
m/s
U
uncertainty,
%
v
velocity,
m/s
V
volumetric
flow
rate,
m3/s
w
channel
width,
m
x
distance from
channel
entrance,
m
z
profile
height deviations
from
mean
line,
m
Z(x)
profile
height
function,
m
Greek
aspect ratio
A
difference
Y
ratio of specific
heats
of an
ideal
gas
p
dynamic
viscosity,
Ns/m2p
fluid
density,
kg/m3o
standard
deviation
\j//
friction
scale
factor
\|/r
Reynolds
scale
factor
Subscripts
1,2,...,
13
denotes
pressure
tap
number
being
referenced
(see
Table
3.1)
c
critical
c,c
circular
tube
critical variable
cf
constricted
flow
eff
effective
fd
fully
developed
h
hydraulic
n
noncircular
passage
1.0
INTRODUCTION
With
the
advent of
today's
fabrication techniques,
the
world
of
heat
transfer
has
begun
a new
frontier.
Lithography
and
other
micro
machining
techniques
have
evolved
to
fabricate
microprocessors/microcircuits
that
are
quicker,
smarter
and more compact
than
ever
before.
With
the
onset of
these
new
techniques, large
quantities of
heat
are
being
generated
at a
magnitude
never
seen
before
on
microchips.
Thus,
more
efficient
techniques
must
be
developed
to
effectively dissipate
such
large
quantities of
heat. Some
of
the
methods
include
heat
pipes,
heat
sinks
(such
as annular and rectangular
fins),
forced
convection,
and small
heat
exchangers.
With
the
onset of
these
new
cooling
problems,
heat
sinks and
heat
exchangers
have been
made ever smaller with each
passing
year.
With
the
miniaturization of such
devices
comes
the
miniaturization of
the
device's
components.
In
particular,
the
dimensions
of
the
flow
channels
have become
so small
they
have
reached
the
micro scale.
Microflows,
especially
nanoflows are much more susceptible
to the
surface
finish
of
the
micro/nano channel since
relative roughness values
may far
exceed
the
maximum
5%
as given
by Moody
(1944).
It is
therefore
necessary
to
take
a closer
look
at micro channel surface roughness and
its
effects on
fluid flow in
micro/nanochannels.
Significant
attention
has been
given
to
fluid
flow in
channels
due
to the
onset of various microfluidic
devices.
Turbines,
heat
exchangers,
pumps, valves, actuators,
and other various components are
being
miniaturized.
Therefore it
is
ever
important
to
gain a
fundamental
understanding
of
the
essential microfluidic
governing
equations.
In
the
proposed work
the
pressure
drop
associated with
identical
surface roughness
features
shall
be
investigated
in
minichannels
with
hydraulic diameters ranging from
325pm
to
1819
pm.
It
is
the
orientation of
the
surface roughness
that
will
vary
from
one
trial to the
next.
Such
variations
in
surface roughness orientation pose an
interesting
situation:
while
mathematically
identical,
different
roughness orientations are
bound
to
cause
differences in
2.0 LITERATURE REVD2W
The
effects of surface roughness on pressure
drop
in
circular
and rectangular
tubes
have
been
studied
extensively
in
literature.
As early
as
the
nineteenth
century,
Darcy
(1858)
conducted
careful pressure
drop
experiments on pipes of
different
materials and roughness.
Darcy
made
measurements
on
21
pipes made of
lead,
glass,
asphalt covered cast
iron,
wrought
and cast
iron
pipes.
With
the
exception
of
the
glass
pipes,
all
pipes
were
100
meters
long
with
diameters ranging from
1.2
to
50
mm.
Darcy
established
that
the
flow
was
dependant
on
the
pipe
roughness,
pipe
diameter,
and slope and
introduced
the
concept of relative roughness.
Darcy
also
noted
that
at
a
certain
point,
friction
factor is independent
of
the
Reynolds
number.
Fanning
(1877)
later
proposed a correlation
for
the
pressure
drop
as a
function
of
surface roughness.
The pioneering
work of
quantifying
the
effect of surface roughness on pressure
drop
was
led
by
Nikuradse (1933).
Nikuradse
established
the
sand grain roughness as a major parameter
in
defining
the
friction factor
during
laminar
and
turbulent
flows.
To
create
the
relative
roughness on
the
test
pipes,
he
first
sifted sand grains so
that the
grains were of uniform size.
He
then
used
Japanese lacquer
to
stick
the
sand grains
to the
walls of
the
pipe.
Through
exhaustive
experimentation,
Nikuradse
studied
the
effect of roughness on
flow
characteristics
in
circular pipes.
Experimental data
was obtained
for
water
flowing
in
pipes of six
different
relative
roughness surfaces with
Re
ranging
from 600
to
106.
The dimensions
of
the test
pipes were
25,
50,
and
100mm. His
work
helped
established
the
effect of relative
roughness,
(e/D)
on
flow
characteristics.
It
should
be
noted
that the
pipe
diameter
used
in his
work was
the
base
diameter
of
the
pipe
before applying
the
sand
grains.
To
ensure
geometric
similarity,
Nikuradse
used
round
pipes
with
the
same
roughness.
To do
this, ordinary
building
sand was sifted
through
sieves.
The
holes
in
the
sieves varied
slightly,
but filtered
out sand grains of
the
same relative size.
Once
the
sand was
sifted,
hundreds
of
different
sand grain
diameters
were measured
using
a
Zeiss
thickness
gage accurate
to
1pm.
From
these
sand
grains,
an
arithmetical
average
was
calculated
and
was
used
as
the
surface
Once
the
sand
had been
sifted and an average grain size
computed, the
sand was
adhered
to
the
inside
of a pipe.
First,
a pipe was stood on
its
end
vertically
with
the
bottom
end
closed.
The
pipe was
then
filled
with
a
thick
Japanese lacquer
and
then
emptied.
The
pipe was
allowed
to
dry
for
30
minutes.
This
is
the
appropriate
amount of
time to
allow
the
lacquer
to
become
tacky,
but
not
completely dry.
The
pipe was
then
filled
with sand of a pre-measured
grain size.
Once
the
pipe was
full,
the
sand was emptied
through
the
pipe
bottom
and
the
pipe was
dried for 2-3
weeks
depending
on
the
moisture content
in
the
air.
Uniform
drying
was accomplished
by
using
an electric
light bulb
which circulated
air
through
the
pipe.
The
pipe was
then
re-filled with
the
Japanese
lacquer
and
allowed
to
dry
for
an additional
3-4
weeks.
This
second coat of
lacquer
helps
to
better
adhere
the
individual
sand grains
to the
inner
wall
surface of
the
pipe.
After
the
pipes are
completely
dried,
10
centimeters of pipe
was cut
from
the
pipe end
to
reduce
the
risk of
any
reduction
in diameter.
The
pipes were
then
ready
to
be
tested.
Nikuradse's
experiments yielded
these
important
results
for
circular pipes:
For
all
laminar
flows,
the
friction factor is
a
function
of
Reynolds
number.
/
=(2.1)
Re
Flow
transition
for
pipes of all
degrees
of relative roughness occurs
between
a
Reynolds
number of
2160
and
2500.
For
fully
turbulent
flows,
the
friction factor
is
independent
of
the
Reynolds
number
and
depends only
on relative roughness.
f=-
!
TT
(2-3)
[l.74
+
21ogij
Colebrook
(1939)
later
published
his findings
on
the
variation
in
surface roughness and
its
effects
on
pressure
drop.
Colebrook's
experiments
included
sixteen
spun
concrete-lined
pipes and six spun
bitumastic-lined
pipes
ranging
in
diameter from
4
inches
to
60 inches.
Also
tested
was
the
216-inch
diameter
Ontario
tunnel.
The
Ontario
tunnel
is
a concrete
walls of
the tunnel
were rubbed
down
with carborundum
brick
to
remove
any
deformities.
Average
roughness values ranged
from 0.04318
mm
to
0.254
mm.
These
pipes
were
tested
in
the transition
and
fully
turbulent
regions.
It
was
determined
that the
friction
factor
decreases
as
the
velocity increases.
Once
the
velocity
reaches
the
square
law,
the
friction
factor
remains constant
for
all
higher
velocities.
Colebrook developed
an
iterative
method
of
solving for friction factor
as such:
1
-TT
=-21gl>
'
elD
2.51
+
4f
"{
3.7
ReV/J
(2.4)
Moody (1944)
later
characterized
the
friction
factor
(f)
as a
function
of
the
Reynolds
number
and
relative
roughness
(e/D).
Through
Colebrook's
work,
the
Moody
diagram
was
established which provided engineers with a convenient method of
determining
the
pressure
drop
associated with
the
relative
roughness of circular pipes.
See Figure 2.1.
The
Moody
diagram
consists of
four
major regions:
laminar
flow,
critical
zone,
transition
zone,
and
the
completely
turbulent
zone.
The laminar
region consists of a
thick
shear
layer
which
keeps
the
flow away from
the
wall surface.
Therefore,
the
flow does
not experience
the
energy losses
associated with surface roughness.
The
critical zone
is
highly
influenced
by
entrance region
effects,
and
is
on
the
cusp
of
being
influenced
by
the
surface roughness.
During
transition
flow,
the
boundary
layer has
been
reduced such
that
some of
the
surface
roughness
peaks
break
through the
boundary
layer causing
turbulence
in
the
flow.
An
increase in Reynolds
number reduces
the
boundary
layer
which causes more peaks
to
break
through
the
boundary
layer into
the
flow
regime.
Finally,
in
fully
turbulent
flow,
the
boundary
layer is
reduced so much
that
any
change
in Reynolds
number will not cause a
change
in
the
losses due
to
surface roughness.
Thus,
the
friction factor
is
independent
of
i
i! i!
-10
i
1
illl
ai
i
i
i
i
i
[image:22.557.72.469.59.664.2]More
recently,
work
has been
extended
into
mini
and
microchannels.
As defined
by
Kandhkar
(2003),
the
following
classification scheme
is
used
to
distinguish
the
channels:
Conventional Channels:
Minichannels:
Microchannels:
Transitional
Channels:
Transitional Microchannels:
Transitional Nanochannels:
Molecular
Nanochannels:
Dh>3
mm
3
mm >
Dh
>
200
pm
200
pm
>
Dh
>
10
pm
10pm>Dh>0.1
pm
10
pm
>
Dh
>
1
pm
1
pm>Dh>0.1 pm
0.1 pm>Dh
Figure
2.2
depicts
a
graphical
representation
of
the
advancement
in
heat
exchanger
technology
plotted against
key
biological
systems.
Boilers
Power
Condensers
Compact
Heat
Exchangers
Electronics
Cooling
Refrigeration
Evaporators/
.^_^ condensers
Aorta
Laifee
veins **************andj
arteriesHenle's
Tubules
loop
m
Alveolar
Alvpolar
ducts
s3^
Capillaries
25
mm
2.5
mm
250
pun
25
jrai
2.5
nm
Figure
2.2
Ranges
of
Channel Diameters Employed
in
Various
Applications,
Kandlikar
(2003)
Channels
with
hydraulic diameters ranging
from
0.96
to
3200
pm
have
been
investigated.
Tests include
fluids
such
as
helium,
nitrogen,
argon, water,
silicone
oil, alcohol,
air and
isopropanol.
The
results
show
that the
pressure
drop
increases
more
dramatically
as
the
relative
roughness
increases.
Thus
fluids may
tend to
enter
the transition
regime at
lower
9-!
a
n
.a
D
8
d
I
a.a
a o.
'Si
d
^
3
^
^
hiS <2
01 S3
(2
T
8
o3
I
I
s aHi
- * ^ x8
I
5
e!?
sa-sil
III
I
o s fl flS
-at S .S
1!
o S a" a "
8
g
a fe z as
9
i
"2
2flJl2al>ai5
a
oH-gQtn'g P<5ll
1-6
S a _8
a^-gv-,
" O QO
8'
a3
9
A
I
3^
~ nz
111
w Bj o
e s a -a
j
J
.33
1
Is
ei
IS
s
-.MM.**
i'
HUlilm
is
E.'"'
n
9
2H
'A
1
"1
1
1
| |
ill
'ill
X BI
1
H
a
As
shown
by
Erin
gen
(1964),
the
partial
differential
equations
of motion
in
microfluidic
flow
are obtained
using
one
to
one
parameter
mapping,
which
can
fully
describe
a continuum
fluid
motion.
Using
the
right
boundary
conditions, these
equations reduce
to the
Navier-Stokes
equations.
This further
enhances
the
equations
validity
to
model micro
flow.
However,
this
analysis
only
proves
that
the
Navier-Stokes
equations
fit
the
special case of simple
micro-fluids
in
a continuum
flow
regime.
p/e
10
0.75-1.25
Row
Pattern
mmmmmgm, t x=5e to Be
I
*^t=^=L
---al
Jg^L
JEL
Figure 2.3
-Flow Patterns
Studied
by Webb,
et al
1971.
Webb,
et al.
(1971)
studied
the
separation of
flow from
the
wall of a pipe when passed over
surface
features.
These
elements,
placed
uniformly in
series,
gave
the
flow
patterns seen
in
Figure
2.3.
The
flow
was
determined
to
separate
from
the
wall
following
roughness elements
and reattach
at
a
distance
of
6-8
times the
height
of
the
element.
When
the
roughness
treatment,
the
elements are similar
in
nature and
closely
spaced.
The
flow
behavior is
most
likely
to
resemble
the
0.75-1.25
p/e spaced
elements,
where
p
is
the
distance between
the
elements and e
is
the
height
of
the
elements.
The
flow
encounters
the
leading
element
and
skims
over
a
of
circulating
liquid
before passing
over
the
following
element.
Nikuradse
used uniform sand grains
to
compose
his
roughened surfaces.
More
experimental work was
done
when
Peiyi
and
Little
(1983)
investigated
microminiature
refrigerators.
Test
sections were made
using
a
lithographic
processes on
glass and silicon
substrates.
Channels
were etched
into
a silicon substrate and a glass cover was
bonded
to the
base
to
form
a complete channel.
Channels
ranged
in
hydraulic
diameter
from
45.46
to
83.08pm
with roughness
ranging from 28
to
65pm.
When
gasses were passed
through the
channel,
they
noticed
that
the
flow
transitioned
at
low Reynolds
numbers
(400-900).
The
high
relative roughness was
determined
to
be
the
cause as
it
was
shown
that
many
factors
may
affect
the
friction factor in
micro channels.
The
method of
etching,
channel
dimensions,
channel
length,
bonding
methods,
and
test
fluid
characteristics
may
all
affect
the
friction
factor.
It is
a combination of one or more of
these
factors
that
cause
the
data
to
disagree
with
the trends
predicted
by
classical
theory.
Later,
Wu
and
Little
(1984)
used
parallel microchannels made
using
the
same
lithographic
process
by
Peiyi
and
Little
(1983).
Using
channels
with
hydraulic
diameters
of
approximately 150 pm,
they
found
that the
rate
of
heat
transfer
was
different
than
what
conventional
theory
had
predicted.
They
also noticed
that the
friction factors
were quite
large
which
may
have
caused
both
the
difference in
the
heat
transfer
prediction and an
early
transition
from
laminar
to turbulent
flow, Rec
=400-900.
An
extensive
literature
study
was performed
in 1988
by
Obot
(1988)
who
investigated
the
differences in
data for
the
frictional
pressure coefficient
between
circular and noncircular
passages.
In
addition, the
validity
of equivalent
diameters
in
noncircular passages
was
investigated
and
a critical
friction
method
(CFM)
was presented.
The CFM is
a method
derived
for
triangular,
rectangular
and concentric annular passages which reduces
data
such
turbulent
flow
in
circular
and
noncircular
passages
can
be
derived from
the
effects
of
transition
and
length
scale.
The
following
scale
factors
are used
in
the
generalization
of
friction data:
^=ReCiC/Ren,c;^=/c,c//n,c
(2.5)
where
y/R
is
the
Reynolds
scale
factor,
y/f
is
the
friction
data
scale
factor,
the
subscript c,c
refers
to
the
circular
tube
critical
variable,
and n,c refers
to the
noncircular
duct
critical
variable.
Obot
(1988)
concluded
that
passages with
the
same criterion
for dynamic similarity
will
possess
nearly identical laminar
and
transition
friction factors.
The
critical
friction
factor
will
converge
to
a universal value
for length
scales
based
on
the
hydraulic
diameter,
a
simple correction
is necessary for
the
critical
Reynolds
number.
Finally,
in
the
fully
rough
regime,
the
effects of
diameter
constriction
described
by
Webb,
et al.
(1971)
are valid
for
passages of noncircular
geometry
as
long
as
the
data is
reduced
using Dh.
Pfahler
(1991)
used a wide
variety
of
test
fluids
which
included
n-propanol
alcohol,
silicone
oil,
isopropanol,
nitrogen,
and
helium.
The
large
range of
test
fluids
allowed
for
a range of
viscosities and
subsequently
a range of
Prandtl
numbers.
Test
channels were
fabricated
in
silicon wafers
using
planar photolithographic
micromachining
techniques.
A
glass
Pyrex
piece
is anodocially bonded
to the
silicon wafer
to
seal
the
channel.
Test
results showed
that
for larger
channel
dimensions
with
a
depth
of
4.65pm,
the
pressure
drop
agreed
with
conventional
theory, but
as
the
channel
dimensions
shank
to
depths
of
0.5
pm and
3
pm, it
was apparent
that
the
friction
factor
was
higher
than
theoretically
predicted.
Peng
and
Wang (1994)
studied
heat
transfer
characteristics
using
forced
convection
through
parallel
rectangular microchannels.
The
microchannels were made
by
machining
parallel
grooves
into
stainless
steel and
sealing
them
with a
top
plate.
The
microchannels used
in
the
turbulent
at
Re~ 1000-
1500.
Thus,
the
transition
Reynolds
number
decreased
with
the
reduction of
the
channel
dimensions.
Later
Mala
(1998)
found
similar results when
he
passed
deionized
water
through
channels
with a circular cross section
880
mm
long
and
between
50-254pm
in diameter.
The
three
regions of
flow:
laminar,
transition,
and
turbulent
were
identified
as
Re<650, 650<Re<1500,
and
Re>1500
respectively.
Pressure
drop
was reported as
being
higher
than
conventional
theory
predicts
at
higher
Reynolds
numbers.
Thus
the
friction
factor
was
higher
than
predicted
using
classical
theory.
Surface
roughness
was not reported.
Pfund
et al.
(2000)
flowed
water
through
rectangular
microchannels with
hydraulic
diameters
ranging
from
112.3
to
167.8
pm.
The
width was
kept
constant at
1
cm while
the
depth
was
allowed
to
vary from 128
to
521
pm.
The
actual pressure measurements were made well
within
the
fully
developed flow
to
eliminate
the
effects
of
entrance
and
exit
effects.
Experimental
results yielded
friction factors
which were
higher
than
macroscale predictions.
This
caused an
early
transition
from
laminar
to turbulent
flow.
However,
as
the
depth
was
increased,
transition
levelled
out
to the
classical value of
Re
=2300.
Using
tubes
of circular cross section with
diameters
of
1.067mm
and
0.62mm, Kandlikar,
et
al.
(2001)
determined
that
for
small
tubes
(dia.
<
1mm),
the
surface roughness enhances
heat
transfer
and
increases
pressure
drop
as compared
to
heat
transfer
and
pressure
drop
in
smooth
channels.
It
was
also shown
that the
relative roughness value
(e/d)
increases both
the
heat
transfer
rate
and
the
pressure
drop
characteristics.
This
value
also affects
the
flows
transition
from
the
laminar
to turbulent regime, thus
producing
a
lower
critical
Reynolds
number.
It
was
Judy,
et al.
(2002)
experimental work
dealing
with error
analysis of microchannels
that
showed
possible
sources
of
error
between
micro
and
macro
scale
pressure
drop
characteristics.
Accuracy
in measuring
inlet
and outlet
pressures as well as pressure
along
the
length
of
the
channel
is important.
Also,
fluid
properties and roughness size
play
a
factor
in
the
pressure
drop
as well.
Thus,
it
was shown
that
channel
dimensions
produce
the
largest
A
major
factor
in
pressure
drop
in
microchannels
is
the
orientation
of
the
roughness.
ASME
lists
many
different
ways
to
characterize
roughness,
ASME B46. 1-2002.
Carrano
(2000)
uses eight of
these
parameters
in
describing
surface
roughness.
Of
those eight, the
following
five factors have been
considered
in
describing
the
surface roughness
in
this thesis.
These
factors
are:
1.
average roughness
[Ra]
2.
root mean square
(rms)
roughness
[Rq]
3.
average maximum
height
of
the
profile or average peak
to
valley
[Rz]
4.
kurtosis
[Rku]
5.
skewness
[RSk]
6.
roughness
length
to
height
ratio
[p/e]
These
are
the
key
roughness parameters used
to
characterize roughness and are
discussed
in
detail in Section 3.4.
This literature
review shows
that
there
are major
discrepancies in
experimental
work
dealing
with
pressure
drop
in
microchannels.
While
a number
of papers
in
this
review
show
an
increase
in
pressure
drop,
there
are
many
papers which show a
decrease,
others show
that
pressure
drop
in
microchannels
is
no
different from
pressure
drop
in
conventional
sized
channels.
It is
unclear
throughout this
literature
review
to
determine
which
values
of
roughness
have been
used
to
calculate e/d.
Thus
there
is
a need
to
determine
the
appropriate
parameters
necessary
to
properly
predict
friction
factors
in
minichannels.
2.1
Objectives
The
objectives
of
the
present work are
to
determine
the
validity
of roughness parameters on
pressure
drop
in
minichannel
flow,
quantify
the
effect of
different
roughness
orientations on
pressure
drop
in
minichannel
flow,
determine
the
effect of roughness on
laminar-turbulent
transition
in
minichannels,
and
to
determine
if
conventional
friction factor
equations are valid
3.0
EXPERIMENTAL
SETUP
3.1 Introduction
The
experiments are performed
using
air and water as
test
fluids.
Two different
setups
are
used
to
accommodate
the test
fluids. The
details
of
the
overall
test
setups
and
the test
section
are
described
in
the
following
section.
3.2 Test
Setup Using
Compressed Air
The
test
setup
used
for
air
is
shown
in Figure 3.1.
x
r
~i
x
W
Legend
P
Pressure
1
Air
Supply
2
-AirFilter
3
-Flow Meter
4
Temperature Sensor
5
-Test Section
6
Pressure Manifold
7
-Temperature Sensor
Figure 3.1
Experimental
Setup Using
Air
as
the
Test Fluid
Ultra
zero grade compressed air
is
used as
the test
fluid.
Ultra
zero grade air
is defined
by
the
following
parameters:
hydrocarbons<0.1ppm, C02<lppm, CO<lppm,
moisture<5ppm.
A
two
stage regulator
is
used
to
deliver
the
air at a pressure suitable
for
testing
(<200psi).
The
air
passes
through
a
5pm
Gelman Aero
50A
filter
to
further
reduce particulates.
A bank
of
three
Omega FL-5500-NV
rotameter
flow
meters
control
the
volumetric
flow
rate
to the
test
section.
K
type thermocouples
placed
before
and after
the test
section record
the
fluid
temperature.
Static
pressure
taps
are connected
to
a pressure manifold which sends
fluid
to
a
differential
pressure
transducer.
To
ensure
accuracy
over
the
entire range of
pressure, the
PX26
lpsi, 5psi, 15psi,
and
30psi
differential
pressure
transducer.
Once
the
air passes
through the test section,
it is
vented
to
atmosphere.
3.3 Test
Setup Using
Deionized,
Degassed
Water
The
test
setup