Rochester Institute of Technology
RIT Scholar Works
Theses Thesis/Dissertation Collections
9-1-2008
A selection framework for derivative products:
Development of an impact metric and platform
value assessment methodology
Alvano Jose Rojas Arciniegas
Follow this and additional works at:http://scholarworks.rit.edu/theses
This Thesis is brought to you for free and open access by the Thesis/Dissertation Collections at RIT Scholar Works. It has been accepted for inclusion in Theses by an authorized administrator of RIT Scholar Works. For more information, please [email protected].
Recommended Citation
Rochester
Institute
of
Technology
A
SELECTION
FRAMEWORK
FOR
DERIVATIVE
PRODUCTS:
DEVELOPMENT OF AN IMPACT METRIC AND PLATFORM VALUE
ASSESSMENT METHODOLOGY
A Thesis
Submitted in partial fulfillment of the
requirements for the degree of
Master of Science in Industrial Engineering
in the
Department of Industrial & Systems Engineering
Kate Gleason College of Engineering
by
Alvaro José Rojas Arciniegas
i
DEPARTMENT OF INDUSTRIAL AND SYSTEMS ENGINEERING
KATE GLEASON COLLEGE OF ENGINEERING
ROCHESTER INSTITUTE OF TECHNOLOGY
ROCHESTER, NEW YORK
CERTIFICATE OF APPROVAL
M.S. DEGREE THESIS
The M.S. Degree Thesis of Alvaro J. Rojas Arciniegas
has been examined and approved by the
thesis committee as satisfactory for the
thesis requirement for the
Master of Science degree
Approved by:
____________________________________ Dr. Marcos Esterman Jr., Thesis Advisor
ii
Abstract
In today’s product development environment, most companies develop product platforms due to the time and cost advantages that are reaped on subsequent development efforts. Many Research and Development (R&D) efforts conclude with the establishment of a platform that anticipates certain technologies and/or markets. However, when a new unanticipated market or technology arises, firms often struggle to assess these opportunities. Most tools to date focus on the upfront decisions while the product platform is under development. There is little work that examines these decisions with the added constraint of a preexisting platform.
This work proposes a new methodology derived from existing tools that address platform development, specifically, the development of derivative products given the constraints of existing platforms and new opportunities that were not identified during the development of the original platforms.
The methodology estimates the impact of making a change in a specific part of the platform in order to integrate new technologies and develop new derivative products, using information theory and coupling indices that capture different aspects of a platform and are combined to extract the most relevant characteristics of each tool. This estimation is fed into a Real Options decision tree model that establishes the value of the opportunity conducting simulations for certain scenarios of markets to pursue, technologies to integrate, and existing platforms to use.
The methodology is applied to a water cooler in order to illustrate the process using two different platforms under a common set of assumptions. This case study suggested that the proposed approach facilitated the decisions to integrate new technologies and pursue new markets from existing platforms.
iii
Acknowledgments
First, I want to acknowledge the work done by Jeanne Wesline, Matthew McLaughlin, and Carol-Lynn Goldstein in their thesis for the Master in Product Development at RIT because it was a starting point for my work and a clear guide in the literature review for this work.
To my professors at RIT my deepest gratitude, particularly to my tutor Dr. Marcos Esterman Jr. who has been a constant guide in my decisions at RIT and the realization of my future at the University of Illinois for my doctorate studies. His prudence and methodic approach has been a lesson that I won’t forget.
To my friends at RIT, who were partners in this journey and made my life in Rochester less cold by putting a laugh on my face. I’ll value their friendship for the rest of my life.
iv
TABLE OF CONTENTS
Page
Abstract ... ii
Acknowledgments ... iii
1 Introduction ... 1
2 Problem Statement... 5
3 Literature Review ... 6
3.1 Modularity Measures ... 7
3.2 Value Measures ... 14
3.3 Research Opportunities ... 19
4 Decision Framework ... 20
4.1 Overview of the Methodology ... 20
4.2 Alternatives Assessment ... 23
4.2.1 Affected Modules Identification ... 24
4.2.2 Impact Assessment... 24
4.2.3 Value Assessment ... 31
5 Application Case ... 37
5.1 Impact Assessment... 39
5.2 Value Assessment ... 43
6 Discussion... 49
7 Conclusions and Future Work ... 51
v
LIST OF TABLES
Number Page
Table 1. CI Rating system for sensitivity [36] ... 13
Table 2. Equivalencies in real options application [51] ... 18
Table 3. MDL estimation for Water cooler Platform A. ... 39
Table 4. MDL estimation for Water cooler Platform B. ... 39
Table 5. CI Matrix for the Water Cooler [36] ... 41
Table 6. IM estimation for Water cooler... 42
Table 8. Pint-success estimation for Water cooler change with platform A. ... 44
Table 9. Distributions attributes for simulation parameters. ... 45
Table 10. Simulation parameters for Water cooler change with platform A. ... 45
Table 11. I0 estimation for Water cooler change with platform B. ... 47
vi
LIST OF ILUSTRATIONS
Number Page
Figure 1 Framework Overview [10] ... 3
Figure 2 Combined component and team interaction DSM [29] ... 12
Figure 3 Generalized platform-based product family development [51]. ... 17
Figure 4 Process Framework Overview ... 22
Figure 5 Research Approach Overview ... 23
Figure 6 Graph example adapted from [25] ... 25
Figure 7 CI and MDL comparison on a water cooler. ... 28
Figure 8 First attempt on the development of the impact metric. ... 29
Figure 9 Successful attempt on the development of the impact metric. ... 30
Figure 10 Decision Tree for technology integration ... 32
Figure 11 Water cooler [36] ... 37
Figure 12 Water cooler’s Platform A ... 38
Figure 13 Water cooler’s Platform B ... 38
Figure 14 MDL comparison for water cooler’s Platform A and B ... 41
Figure 15 Metric comparison for water cooler ... 42
Figure 16 Beta estimation for Water Cooler ... 44
Figure 17 Decision Tree for technology integration in Water Cooler platform A ... 45
Figure 18 Simulation Result for Value of Alternative with platform A ... 46
Figure 19 Simulation result for cases of positive outcome with platform A ... 46
Figure 20 Decision Tree for technology integration in Water Cooler platform B ... 47
Figure 21 Simulation Result for Value of Alternative with platform B ... 48
1
1
Introduction
Meyer and Lenherd [1] have defined a product platform as “a set of subsystems and interfaces that form a common structure from which a stream of derivative products can be efficiently developed and produced.” Similar definitions of a product platform exist through much of the product development literature [2-4]. It has been well established, that product platform strategies give firms competitive advantages in the marketplace due to their ability to leverage existing platforms by rapidly introducing appropriate derivative products that meet new market demands. Dahmus et al. [5] highlight this and other advantages of developing product families over platforms, however, the product development literature typically focuses specifically on processes and tools to develop new standalone products and product platforms [6, 7]. Nevertheless, manufacturing firms must frequently both update and broaden their product lines not only to grow, but to survive as a company [8], but little attention is paid to the case in which a company wants to develop new derivative products from an existing platform based on information about new technologies and changes in the market. The company needs to decide which of these new opportunities to implement in one or more of its derivative products. Due to the competitive nature of the marketplace, these decisions need to be made quickly.
According to Wesline et al. [9, 10] corporations often have difficulties in determining the “best” derivative product(s) to develop from an existing product platform. “Best” means that the derivative product delivers optimal value to the corporation, which implies that it:
(1) is desirable to the market, and thus will generate revenue
(2) can be designed, produced and supported within the existing capabilities of the corporation
(3) aligns with the product strategy of the corporation
As a result, “best” derivative products will be unique to a particular organization.
2
Given knowledge of either new technologies or new market opportunities, the decisions would include but would not be limited to:
(i) what changes in a platform does the market-place value? (ii)which platform should be changed?
(iii)is it better to develop a new platform in order to respond correctly to the market?
The product development literature describes numerous tools to help facilitate these decisions. Alizon et al. [11, 12] describe some studies on redesign of a family of products “focusing on various aspects such as modularity, cost, and commonality/diversity.” Khadke and Gershenson [13] explore the technology change to plan the product platform designs, but no comprehensive framework has been documented that deals specifically with unplanned derivative product development. A major objective of this research is to develop a method to analyze alternative derivative products given the constraints of a preexisting product platform.
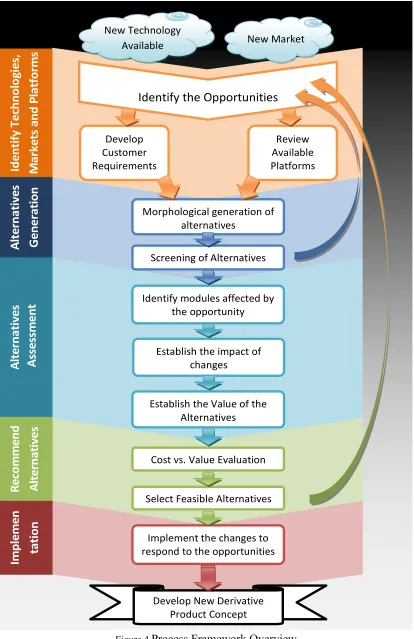
The first attempt to address this problem proposed a selection framework with four main elements: Platform Characterization, Market Characterization, Technology Evaluation, and Concept Generation & Initial Filtering [9, 10]. An overview of the framework can be seen in Figure 1.
3
Figure 1Framework Overview [10]
This attempt provided some insights into the nature of the problem, however elements of the process were cumbersome and improvements were needed to make the process more useful product development decision-makers. One area that was identified as an opportunity for improvement was the measurement of impact. It is believed that if a robust impact metric, which is linked to the modularity of the product, is used in the framework, the assessment process would be greatly simplified. Another shortcoming that was identified was the assessment of the value of these opportunities.
4
i. Metrics need to be identified or developed that characterize the value that will be delivered to the marketplace by a particular product derivative.
ii. Metrics need to be identified or developed that correlate to the costs and effort that will be required in order for the derivative product alternative to be developed.
iii. A prescriptive methodology that will aid product development practitioners with implementing these metrics to guide their decision-making needs to be developed.
It is the goal of this thesis to address these objectives. In Chapter 2 the problem is defined. Chapter 3 presents a literature review that examines the product platform literature and also explores different approaches to measure modularity and different approaches to assess the value of products and product platforms, which are both key elements of a successful framework.
In Chapter 4 a selection framework is proposed, which incorporates new metrics of the impact of a change to a given component within a platform and the assessment of the value of a specific scenario; in Chapter 5 the methodology is illustrated with an application case that clarifies the details of the assessment.
5
2
Problem Statement
As was discussed in the last section, companies struggle to respond to new technologies and new market opportunities. These decisions can be made more difficult when the added constraint at a preexisting platform is considered which may limit the redesign options available to the product development team. The task to generate a new product may require the selection of the appropriate platform to develop the new derivative product, adapt the existing platforms or even generate new platforms; clearly, this is not an easy task.
However, one thing is certain, the new technologies or market opportunities that are identified would affect (change) some aspects of the platform. Ultimately components, interfaces, and /or processes change due to the integration of the new technologies. The impact of these decisions should be analyzed and compared against the value that the new opportunity offers to the company in order to determinate the action to pursue.
In order to assess the impact of the changes to a given platform a metric should be developed that captures the different aspects of the architecture and the strength of the relationships between modules or components. Having this information would facilitate the evaluation of how easy it is to change one element of the platform.
The value of the alternative should be estimated considering the risk and possibilities for the platform. This means that different scenarios should be considered to obtain a realistic idea of the benefits that could be extracted with the technology integration in a given platform.
6
3
Literature Review
In today’s highly competitive landscape, manufacturing firms must frequently both update and broaden their product lines not only to grow, but to survive as a company [8]. Firms cannot afford to make every product an independently-developed entity. Such firms would incur high costs due to redundancies in most areas of the business including engineering development effort, manufacturing inventory, service and sales force training. Product platform development has evolved out of the necessity to avoid these redundancies. The use of a product platform as the base for a series of derivative products has become commonplace in many of today’s fast-paced companies. These companies have recognized that the development of derivative products from a platform can mean significant savings in both time and resources. Derivative product projects can save from 50% to 90% in comparison to creating non-platform products that fulfill the same market needs [3].
Platform planning has been discussed in terms of distinctiveness and commonality [2-4, 8, 14]:
“Planning the product platform involves managing a basic trade-off between distinctiveness and commonality. On the one hand, there are market benefits to offering several very distinctive versions of a product. On the other hand, there are design and manufacturing benefits to maximizing the extent to which these different products share common components.” [3]
7
Despite the advantages of derivative products, inevitably unanticipated technologies will be developed and unanticipated market segments will emerge. While these unanticipated changes may not have been accounted for in the initial development of a product platform, tools and methods are still needed that allow engineers and engineering managers to evaluate how to best accommodate these changes within the existing product platforms. Thus quantitative measures are needed.
The two broad areas that need to be quantified in order to evaluate the incorporation of changes into a platform are (1) the cost of the alternative, (2) the benefit of the alternative. The cost of the alternative will be related to the difficulty of implementing the alternative, which is linked to the modularity of the architecture. The benefit of the alternative is linked to value that will be delivered by the alternative. The following section summarizes the literature in these two areas.
3.1 Modularity Measures
Central to development of quantitative tools for product platform development is the concept of modularity. The modularity of an architecture is the degree to which the product functions are implemented by the physical elements, or “chunks” of the product [3]. In the ideal, a completely modular architecture would have a 1:1 map between a single function and a single “chunk” of the product [3]. Nevertheless, Gershenson et al. [15, 16] showed how wide the term can vary and how there is no consensus in the literature on which is the best way to measure the modularity of a product or a platform.
8
An approach to measure the modularity of a product would be to establish the number of standard components (elements or subsystems) by level. If the product has a large number of standard components compared to unique specific components, then it would be easy to interchange or substitute those with similar products within the same platform or family of products. Mikkola and Gassmann [20] propose a measurement of the modularity with an index that represents the component composition of the product architecture that can be extracted from the BOM (Bill of Materials) for the product:
1
0
;
≤
≤
=
=
b
N
u
N
n
b
NTF (1) Whereu: Number of New-to-Firm (NTF) components N: Total number of components
N-u: Number of standard components
b: representation of the modularity of the product going from a perfect modular architecture (b=0) to a perfect integral architecture (b=1).
The same concept can be used to evaluate the modularity of the products by level, considering the components as standards if they are used in several products or platforms within the company. In this way, we would get a general index b0 that represent the modularity of the product, and indices b1, b2, bn for the subsystems of the first level, b11, b12, b1m, for the second level of the first module, and in this way evaluate the entire product at the desired level of detail.
1 0 ; 1 0 ; ≤ ≤ = = ≤ ≤ = = nm nm nm nm NTF nm n n n n NTF n b N u N n b b N u N n b nm n (2) where,
un: Number of New-to-Firm (NTF) components in the subsystem n of the product. Nn: Total number of components of the subsystem n.
Nn-un: Number of standard components in the subsystem n. bn: representation of the modularity of the subsystem n.
9
Nnm: Total number of components of the subsystem m.
Nnm-unm: Number of standard components in the subsystem m within the subsystem n. bnm: representation of the modularity of the subsystem m within the subsystem n.
This approach does not take into consideration the relations between the modules in the system. It is more a measure of the standardization of the product than the modularity of the system. Similar metrics assess the commonality or diversity of a family of products, and many of those were reviewed by Alizon et al. [21, 22] and Fixson [23]. To actually measure the modularity there is a need to evaluate the connections between components, sub-modules, and modules.
A different approach was proposed by Wang and Antonsson [24, 25] that uses Information Theory, specifically Minimum Description Length, to describe the modularity of a system. This approach captures the layers and boundaries of the modules that the elements have to cross in order to interact with the rest of the system as well as the number of interactions, both relevant aspects for an estimation of the impact of changing an element in a platform. The method consists of evaluating the system in terms of connections; each connection or interaction between the module and other component, between modules (inter-module), or inside the modules (intra-module) of the system would be quantified by the length of a message that would describe each link.
In the end, all of the message lengths of the system are added and compared against the length of the messages of the system if no modules were defined as follow:
o d o d
L L L
M = − (3)
where,
Md is the modularity of the system
Lo is the length of the message for the system with no modules
Ld is the length of the message for the system with the configuration that is under analysis.
10
The method encodes graph structures that represent the system including three types of information: Units (components or sub-modules), Links (connections between different units), and Interfaces (means of interaction for a unit inside one module with another unit outside the module). With this information a message is created in the following way:
1. The whole graph is a unit.
2. Unit = Name tables + list of Links.
3. Name tables = Names of units and interfaces which are visible in the level. 4. Link = Name of two vertex units + attributes.
5. Name of vertex units could be <Node> or <SubMod M1> <M1’s SubMod>… <Mi’s SubMod> <Interface in SubMod Mi>.
The interfaces are just a unit that relates with another unit outside the module. Now, to quantify each of the links let us estimate the length of the message for the names of the links.
Let L(n)j be the name length of node j, L(m)j be the name length of sub-module j, L(o)jk be the name length of interface k of sub-module j. Then the message length for names of links (name tables) in the module is:
I(nk) = Sum of the lengths of all links in the module
∑ ∑
∑
∑
= = = = ⎟ ⎟ ⎠ ⎞ ⎜ ⎜ ⎝ ⎛ × + × + × = ) ( ( ) ) ( ) ( 1 1 ) ( ) ( 1 ) ( ) ( 1 ) ( ) ( ) ( m o j m n N j N k o jk o jk N j m j m j N j n j n jnk L N L N L N
I (4)
where:
• N(n): number of single nodes.
• N(n)j : number of links connected to node j.
• N(m): number of sub-modules.
• N(m)j : number of links connected sub-module j.
• N(o)j : number of interfaces of sub-module j.
• N(o)jk : number of links connected to interface k of sub-module j.
11
∑
= = ( ) 1 u i N j j j j N Np (5)
then, the total encoding length for a unit label is:
⎟ ⎟ ⎟ ⎟ ⎟ ⎠ ⎞ ⎜ ⎜ ⎜ ⎜ ⎜ ⎝ ⎛ − = −
∑
∑
∑
= = = ) ( ) ( ) ( 1 1 1 log ) log( u i u i u i N j j j N j j N j j j N N N p N (6)The message at a specific level would be:
∑ ∑
∑
∑
∑
∑
∑
∑
= = = = = ⎟ ⎟ ⎟ ⎟ ⎟ ⎠ ⎞ ⎜ ⎜ ⎜ ⎜ ⎜ ⎝ ⎛ ⎟ ⎟ ⎟ ⎟ ⎟ ⎠ ⎞ ⎜ ⎜ ⎜ ⎜ ⎜ ⎝ ⎛ − ⎟ ⎟ ⎟ ⎟ ⎟ ⎠ ⎞ ⎜ ⎜ ⎜ ⎜ ⎜ ⎝ ⎛ − = = all N j N k o jk o jk N k o jk all N j j j N j j n n n level at ules all nk n n m o j o j u i u i N N N N N N I I I ) ( ) ( ) ( ) ( ) ( 1 1 ) ( ) ( 1 ) ( 1 1 ) ( mod ) ( ) ( log log (7)An illustrative example of the application of this method is developed in section 4.2.
Modularity has also been associated with the way to handle the complexity of a structure or product. Numerous measures are used to describe product complexity. Hölttä and Otto [26] review various complexity measures described in the literature including structural complexity, architecture complexity, and module I/O complexity. It is pointed out that “all [of these complexity measures] treat any relation [to other components or modules] as having the same difficulty, which is not generally the case” [26]. The authors go on to describe a redesign effort complexity metric that aids in developing architectures that are flexible as viewed from the perspective of the redesign effort required.
12
[image:20.612.72.535.163.422.2]form and relate to physical connections, mass, energy, or information flows [28]. This tool has also been used for planning of team interactions in a product development process, an example is shown in Figure 2 of a DSM that combines the relationships between components and the team interactions[29].
Figure 2Combined component and team interaction DSM [29]
An interesting application of the DSM matrix has been used to identify not only the direct relationships between subsystems and components, but their indirect relationships as well [30-32]. In this way, the propagation of change can be traced through the system and with the definition of metrics for combined likelihood, and risk, the combined impact of a change can be determined.
13
(8)
(9)
Smaling and de Weck [28] develop the Technology Invasiveness (TI) Index, comparing the DSM of an original system and the DSM of a concept developed to infuse a technology into the system, to create a Delta DSM that is later analyzed for eight types of change, counted, weighted and combined into the TI index. One drawback of this approach is how to establish the weights of each type of change.
∑ ∑∑
= = =
∆ = 8
1 1 1 , ,
j N k N l i l k j j
i w DSM
TI (10)
Guo and Gershenson [35] developed another modularity metric that determines the internal (intra-module) and external (inter-module) relationships of the modules, adding the dependencies between components inside/outside the module and compared that to its size. The dependencies can be extracted from the DSM.
⎟ ⎟ ⎟ ⎟ ⎟ ⎠ ⎞ ⎜ ⎜ ⎜ ⎜ ⎜ ⎝ ⎛ − + − + − ⎟⎟ ⎠ ⎞ ⎜⎜ ⎝ ⎛ + − + − =
∑
∑ ∑
∑
∑
∑
∑
= = = + − = == = M
k k k k k
m n i N m j ij n j ij M
k k k
m n i m n j ij n m N n m R R n m R M Modularity k k k k k k k k 1 1 1 1
1( 1)2 ( 1)( 1)
1
(11)
[image:21.612.88.453.407.481.2]Martin and Ishii [36, 37] introduced the Coupling Index as another way to evaluate the relationships in the system. The coupling index analyzes the strength of each connection in a matrix similar to the DSM. Each cell captures the specifications that supply information from the components in the columns to the components in the rows and evaluates the sensitivity of the component to a change based on the following scale:
Table 1. CI Rating system for sensitivity [36] Rating Description
9 Small change in specification impacts the receiving component (High Sensitivity) 6 Medium High Sensitivity
3 Medium Low Sensitivity
1 Large change in specification impacts the receiving component (Low Sensitivity) 0 No specifications affecting component
14
3.2 Value Measures
The value of an alternative is based on the customer response to the product. In order to capture the customer perception of the product the Quality Function Deployment (QFD) is a widely used technique, however it is hard to extract quantitative measures of that perception and to translate them into design features that maximize the value.
The Kano Model is a concept for categorizing product features or attributes in terms of customer satisfaction levels. Product attributes can be designated as one of three types: “dissatisfiers,” “satisfiers,” and “delighters.” “Dissatisfiers” can be described as attributes that are necessary to the product. If the product is delivered without these, the customer will be dissatisfied with the product. “Satisfiers” result in customer satisfaction when present in the product, and dissatisfaction when not present. For these attributes, improvements along customer-identified performance metrics can increase customer satisfaction. The absence of “delighters” does not result in dissatisfaction because the customer is not really expecting them to be there, but if some delighters are included in the product, customers are usually pleased, and as a result, the product should be very successful. A competitive strategy for the product should account for all three types of attributes when defining feature sets. According to the model, over time, the delighters shift to satisfiers, and satisfiers shift to dissatisfiers [38, 39].
Meeting customer requirements is not enough to capture and retain market share. Products need to contain desirable qualities and customer expectation and satisfaction should be exceeded. Combining Kano model analysis and the technical correlation matrix involved in QFD can have significant positive effects on attractive quality creation and product innovation [38].
15
In addition to the value of the product to customers, products need to be evaluated in terms of financial value to the firm. Marketing and finance organizations use value metrics such as Return on Investment, Net Present Value, Real Options, and Expected Commercial Value, along with sensitivity analysis around these metrics, to measure the value of a new product [42].
Return on Investment (ROI) is one method for gauging the success of a product, but it requires a large quantity of information. In order to calculate ROI, one needs to know how many of a particular product will be sold, the expected price of the product, and its development and manufacturing costs. These pieces of information are usually not available (or not fully accurate) until late in the product’s development, or even after product launch. As a result, this metric is not appropriate for use during the early concept generation and selection phases [42].
According to Cooper [42], a portfolio of products may be managed by ranking the products that are being considered for development by their prospective Net Present Value (NPV). There are some problems with using this formula. One such issue is that the financial information is merely a projection of what is perceived to occur in the future, a downfall shared by ROI. This projection does not necessarily reflect what will actually come to pass. In addition to this shortcoming, NPV does not take into account strategic considerations, and it ignores probabilities of risk and success [42]. Even with the application of discount rates, NPV can only account for uncertainty on the downside, or “the possibility that actual cash flows may be much lower than forecast” [43].
Expected Commercial Value (ECV) is another metric used to place a value on a prospective project. ECV differs from NPV as it considers future earnings from the project, the probabilities of both commercial and technical success, and both commercialization costs and development costs. Once the ECV is calculated, a Monte Carlo simulation can be used to simulate risk profiles for the uncertain inputs [42].
16
ROA regards the execution of a project as a “sequence of major decisions” [45]. At certain points in the project life-cycle, management can choose to continue funding to meet the original launch date, increase funding to speed up development, postpone the continuation of the project until a later date, or even cancel the project entirely. These decisions are made based on reevaluation of the market and technical risks. The evaluation of ROA accounts for the costs and benefits of each of these possibilities [44-46]. Since the real options approach involves future decision-making, it cannot simply be calculated once at the outset of a project. It requires that managers implement “an adaptive approach that monitors the resolution of future uncertainties” throughout the project life-cycle [47].
ROA implies that the risks of the project, rather than being avoided, should be examined to find “options” that could maximize the rewards for the system. De Neufville [48] discusses this aspect of ROA and states that “the act of seeking out risks can be difficult for designers to accept… it may be culturally difficult to persuade designers to look at risky situations as opportunities to develop real options that will add value to the overall performance of the system”. By looking at those risks the company can manage better the uncertainties with a proactive attitude instead of a classical reactive analysis where the estimates are made for a given scenario.
This technique is particularly beneficial for development activities and flexibility in timing [48], this includes the assessment of R&D projects, and the product development processes that may result from these, helping to find the optimal moment to launch a certain product, introduce a variant in the market, or perform upgrades in the system or its modules.
As Kalligeros et al. [49, 50] discussed, the major uncertainties that are evaluated in product development are the response of the market, and the non-diversifiable parts of the products. The later would imply a higher risk because it constrains the response of the entire platform of products to the market, therefore the ROA should be used to evaluate the different options in the design looking for more flexible platforms that allows more derivative products.
17
will be made in the future to commercialize the resulting product. A real option exists because the firm has the choice to drop the project and not make the commercialization investment if the development goes poorly or the market situation changes. In that case the only loss incurred is the initial investment” [51].
[image:25.612.108.529.288.535.2]Faulkner [47] as well as Gonzalez-Zugasti et al. [51] introduced the decision trees as the way to model the different alternatives of the product development process, recognizing that this is a very time consuming technique but appropriate for simple and fairly complex cases. Faulkner also points out that the problem with discounted cash flow (DCF) methods “is the mindset that has developed around it” [47].
Figure 3Generalized platform-based product family development [51].
However van Putten and MacMillan et al. [43, 52] suggest that the DCF is appropriate for projects with low uncertainty and that the tools are not mutually exclusive, instead the DCF and ROA should complement to allow managers to make better decisions. It is pointed out that Real Options should not become a way to justify every project and that analysis only make sense if the project can be terminated early at low cost if things don’t go well, “fail fast, fail cheap, move on” [52]. They also highlight that there is a difference between the uncertainty about the
YES
Platform?
Pplatf-success
Variant A? YES
Psuccess A
time
Decision 1: Invest in platform?
1-Psuccess A
NO
1-Pfit A
1-Pplatf-success
NO
Variant A successfully commercialized. Outcomes realized.
Variant A not successful. Lower or no outcomes.
Variant A not developed
Platform does not satisfy needs of Variant A
Platform development not successful
Platform not developed Pfit A
Decision 2: Invest in variant A?
18
revenues and the uncertainty about the costs which tend to be higher than you expect and therefore should decrease the value of the project. With all these considerations they propose the following way to value an option:
TPV = NPV + AOV + ABV
(12)total project net present adjusted abandonment value value option value value
[image:26.612.61.557.266.404.2]Jiao et al. [53] propose the application of the real options to the product family design with the following equivalencies:
Table 2. Equivalencies in real options application [53]
Stock call option Real Option Product Family Design
Current Value (Gross) present value of expected cash flow Expected profit
Exercise Price Investment cost Design flexibility index
Process flexibility index Expiration time Time until opportunity disappears Time to Market
Expected rate of return on the asset
Risk-free interest rate Customer unsatisfactory risk Process deficiency risk Volatility of the
asset (Probability)
Project value uncertainty Uncertainty of customer needs
They also point out three major characteristics of real options methods: 1. Flexibility: The holder of the option has the right but not the obligation. 2. Uncertainty: Exercise the option only if the price increases.
3. Irreversibility: the right ceases when the option is exercised.
De Neufville and Wang [54] explored the real options “in” projects identifying two classes of options that have value due to flexibility: Those with the value of timing in which the time of implementation is crucial to maximize revenues or minimize losses; the other type is the one that has the value of Flexible Design, in which the design could change according to the realization of uncertain variables. In both cases the options exist because there is uncertainty in the project and only by having flexibility there is a real chance of getting advantage of the situation.
19
In order to calculate the value of an option there are several approaches, the most significant according to Amram and Kulatilaka [55] are:
• The solution of a Partial Differential Equation (PDE) in which the most used is the Black-Scholes equation,
• Dynamic Programming that can be implemented through a binomial model, and • Simulations through the Monte Carlo method.
3.3 Research Opportunities
Having reviewed the literature in these areas it seems clear that there are opportunities to contribute in order to facilitate the decisions involved in the integration of new technologies into existing platforms that allow the firm to develop new derivative products responding to unanticipated markets. Some of the possible contributions would be:
• Develop a metric that captures not only the quantity of interactions in a product but also the strength of those interactions and that can be applied at a component level if desired.
• Develop a metric that accounts for the contribution of each one of the elements to the impact metric as a result of changes.
• Estimate the value of an alternative of technology integration having defined a scenario of certain markets to pursue and possible platforms from which a derivative product can be developed.
20
4
Decision Framework
The end goal of this work is to provide firms with tools to make better decisions with regards to derivative product development projects that involve changes to a platform that was already developed. This involves minimizing the effort (and consequently the cost) to implement the changes while maximizing the value of the new opportunities. This activity generates alternative derivative product concept(s) for the firm to pursue.
Such a framework could be useable by firms as a means of:
1. Generating derivative product concepts by understanding and making use of newly available technology and, seeking newly identified market opportunities
2. Sorting, ranking, and screening derivative concepts based on appropriate metrics, assessing risk, value, and other appropriate measures, and developing a subset of concepts that are most attractive to the firm.
3. Selecting the best product concept to pursue using a final evaluation strategy to select from the high value derivatives.
4.1 Overview of the Methodology
Given the two scenarios mentioned before of having a new technology available or a new market segment identified for a derivative product of the platform, the result is the same: A new opportunity has been discovered and needs to be assessed. The proposed framework includes five phases where the opportunity and the platform are characterized in order to evaluate the changes and then generate and select the best concept for a new derivative product where the value of the opportunity exceeds the cost of its implementation. This is not very different from a generic problem solving methodology where first the problem is identified, the alternatives are generated, analyzed and finally a decision is made on the solution to implement. The key step is the analysis of the alternatives because the decision depends most heavily on the quality of this step.
A more detailed version of this process is shown in Figure 4 and is discussed below.
21
better understanding of the value of the opportunity through the customer requirements and the review of the available platforms that the firm has that may fit the needs.
Alternatives Generation involves the systematic exploration of the identified technologies, markets and platforms to produce a set of alternatives to pursue. Some of those alternatives may not be feasible therefore a preliminary screen should be conducted in order to continue with the analysis of only the most promising alternatives.
The stage of Alternatives Assessment is the core of the analysis and the focus of this thesis. It starts by identifying the modules that are affected by the changes in each platform and the appropriate level of detail for the analysis of the different alternatives. The impact of the change is calculated through the Impact Metric and that feeds the estimate of the value of each alternative.
The next phase is the recommendation of the alternatives to pursue. This phase is the result of the analysis where the cost and the value are compared, and a priority for implementation is established. This implementation plan should be reviewed by the firm and the decision would depend on the strategic plan of the company.
The last stage is the implementation of the changes to the platforms in order to respond to the alternatives that were identified and develop new derivative products.
22
New Technology
Available New Market
Identify the Opportunities
Develop
Customer
Requirements
Establish the Value of the
Alternatives
Review
Available
Platforms
Establish the impact of
changes
Morphological generation of
alternatives
Implement the changes to
respond to the opportunities
Screening of Alternatives
Cost vs. Value Evaluation
Develop New Derivative
Product Concept Select Feasible Alternatives
Id e n ti fy Te chnol o gi e s, Ma rk e ts an d Pl a tf o rm s Al te rn a ti ve s Genera tion Al te rn a ti ve s As se ss men t Re co mme n d Al ter n a ti ves Im p lem en ta ti on
Identify modules affected by
[image:30.612.100.514.71.710.2]the opportunity
23
4.2 Alternatives Assessment
After the opportunities have been identified and the platform(s) has (have) been reviewed, the alternatives are generated through a morphological analysis and screened to ruled out the alternatives that are not feasible. The resulting group of alternatives should be evaluated in order to decide which the best alternatives to pursue are.
This assessment is divided into three steps that will be further explained in the following sections: (1) the modules that are affected by the technology integration are identified; (2) an impact assessment estimates how difficult it is to make a change in the elements that were identified; and (3) the value of the alternative is estimated for the company given the different scenarios and possibilities. With this information a recommendation on which are the best alternatives to pursue for the company can be made.
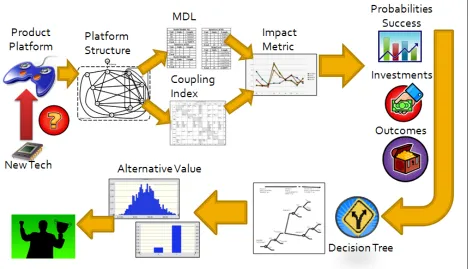
[image:31.612.73.543.383.652.2]In order to accomplish these three steps, the approach that is summarized in Figure 5 was implemented in this work and will be described below.
24
The initial step is that a technology or set of technologies for a given scenario are identified as candidates for insert into an existing platform. The platform is then analyzed and the corresponding impact is calculated by adapting existing tools, which will be described in greater detail in sections 4.2.1 and 4.2.2. Once the impact has been estimated, the assessment continues with the estimation of the value of the new platform to the firm. This is accomplished by relating the impact metric to the valuation process through the parameters that include the required investments, probabilities of success, and possible outcomes for the project. Additional parameters are estimated and populate a decision tree that is the input to a Monte Carlo simulation that calculates the possible range of value outcomes. This valuation process is described in greater detail in section 4.2.3.
The results of these assessments assist the decision maker in the selection of the most appropriate path for the firm to take, which reduces to pursuing the product platform alternatives that yield the greatest likelihood to results in positive financial outcomes for the firm. The details of each step in this process will be examined in the following sections.
4.2.1 Affected Modules Identification
The first step in the assessment is to identify which modules within the platform of the alternative would have to change in order to integrate the technologies identified or to pursue the new markets. This identification implies a review of the platform structure looking at the relationships between components, modules or sub-modules. The review would highlight the indirect elements that are affected and the appropriate level of detail of the analysis would be a natural result of this phase.
4.2.2 Impact Assessment
25
The commonality indices are not well suited for this evaluation because they do not account for relationships but for number of components as noted in equations 1 and 2. The method of Minimal Description Length developed by Wang [25] gives a general representation of the modularity of the architecture, however in the process it describes each element in terms of the number of relationships and it accounts for the modules defined in the structure, therefore it could be part of the impact measure.
[image:33.612.66.438.426.678.2]In order to illustrate how Wang’s [25] work was adapted in this work, it is useful to consider the simplified example below (adapted from an example in Wang [25]):
Figure 6Graph example adapted from [25]
The description of the system would be:
M11 (Module Name) O111O112 (List of Interfaces){
M21O211O212{ n3n4 (Links) n3n5
n4n5} M22O221O222{
n7n8 n7n9 n7n10 n8n10 n9n10} n6M21O211 n6M22O221 M21O212M22O222 n1n2
n1M11M21O111 n2M11O112
n1 n2
n3 n
6
n7 n8 n5
n4
n9 n10 M1 1 M2 1 M2 2 O2 12 O2 11 O2 22 O2 21 O1 11 O1 12 Level 0 Product Level 1 Inside Module M11 Level 2
Inside Module M21
Inside Module M22
Level
Module # Level
26
For the graph shown in Figure 6, the calculation of the MDL representation of the system would be an analysis per level describing each unit in the graph by the number of connections per level. Then the links are measured adding the representation of the units involved. In the end the length of all the links are summed up to get a representation of the system:
*At level 2 (2 layers inside the product) *Inside M21
Unit Links Length Link Length
n3 2 -log22/6
=Log23
n3n4 2Log23 n3n5 2Log23
n4 2 =Log23 n4n5 2Log23
n5 2 =Log23 Total 6Log23
Total 6
*Inside M22
Unit Links Length Link Length
n7 3 -log23/10
=Log10/3
n7n8 Log210/3 + Log25 n7n9 Log210/3 + Log25
n8 2 =Log25 n7n10 2Log210/3
n9 2 =Log25 n8n10 Log210/3 + Log25
n10 3 -log23/10
=Log10/3
n9n10 Log210/3 + Log25
Total 6Log210/3 +
4Log25
Total 10
*At level 1 *Inside M11
Unit Links Length Interface Links Length
n6 2 -log22/6
=Log23
O2
11 1 -log21/4=2
O2
12 1 =2
M2
1 2 =Log23 O221 1 =2
M2
2 2 =Log23 O222 1 =2
Total 6 Total 4
Link Length
n6M21O211 2Log23 + 2 n6M22O221 2Log23 + 2 M2
1O212M22O222 2Log23 + 4
Total 6Log23 + 8
*At level 0
Unit Links Length Interfaces Links Length
n1 2 -log22/6
=Log23
O1
11 1 -log21/2
=1
n2 2 =Log23 O112 1 -log21/2
=1 M1
1 2 =Log23
Total 6 Total 2
Link Length
n1n2 2Log23
n1 M11M21O111 3Log23 + 1 n2M11O112 2Log23 + 1
Total 7Log23 + 2
*Total
Ld = Length of links at level 0 + length of links at level 1 + length of links at level 2
Ld = (7Log23 + 2) + (6Log23 + 8) + [(6Log210/3 + 4Log25) + (6Log23)]
27
This number is a representation of the entire system. However the methodology would serve to characterize just a module or a component giving a representation of each one in terms of the number of connections related to that unit in each level. Returning to the example described above, the unit n1 has two relationships with the rest of the system, one with unit n2 and another with module M11, and a total of 6 relationships at level 0, then the representation of n1 would be -log2(2/6) = 1.585. For units that have relationships outside modules, like unit n3, the representation should account for that so it would be not just its description inside Module M21 but the sum of the interfaces that it represents (O111 and O211) so it would be -log2(2/6) -log2(1/2) -log2(1/4) = log2(3)+3 = 4.585.
As discussed in the literature review, this quantification does not take into account that the strength of the links are different between each other and a relationship between two units may be stronger (therefore hard to modify) than other.
Another tool may be helpful in quantifying the strength of relationships is the DSM. The DSM analyzes the relationships but out of the multiple approaches in the use of the DSM probably the ones that capture the differences in the strength of the relationships are the Coupling Indices. Introduced by Martin and Ishii [36, 37], the CI analyzes the strength of each connection creating a matrix that relate the components and how they supply and require information. Each cell evaluates the sensitivity of the component to a change based on the scale described in Table 1.
The CI represents how strongly related each component is with the rest of the system. It also differentiates if the components supply or require information to/from other components. Because it is a representation on a component basis it is compatibles with the MDL representation in the sense that it would highlight different aspects of the relationships in a structure, which is necessary for a more complete assessment of the impact of changing an element in a platform.
28
contribution of its components as long as they are in the same level, when there are module boundaries it is difficult to recognize the contribution of each component inside the modules to the general modularity of the product.
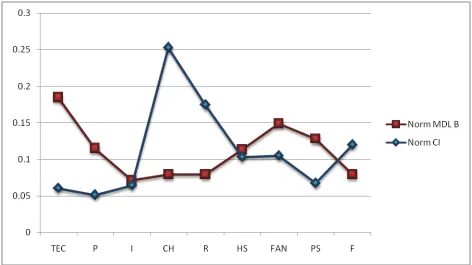
[image:36.612.89.561.260.525.2]These characterizations can be normalized by dividing the length of each component with the total length of the system in order to compare the results when they are applied in the same system. Applying this to a Water Cooler (further studied in section 5) it was clear that there are differences in the description that one can obtain with the MDL method and the CI, a comparison can be seen in Figure 7.
Figure 7CI and MDL comparison on a water cooler.
This comparison suggests that combining the concept of CI with the MDL could give a better representation of the impact of making a change to the platform, thus forming the basis for a new impact metric.
29
[image:37.612.72.543.123.384.2]big number as a result of a summation of 3, 6, and 9s in the sensitivity analysis) that when combined in each link made it meaningless.
Figure 8First attempt on the development of the impact metric.
After several iterations a more successful approach that reflects both dimensions of complexity (number and strength of connections) was:
∑
= + ×
− + −
= n
i
i u i u u
u
u CI R CI S L O
IM
0
) (
)
( (13)
where:
IMu is the impact of a change in unit u,
u is the unit (module or component) that is under analysis, CI-Ru is the Coupling Index Receiving for unit u,
CI-Su is the Coupling Index Supplying for unit u, n is the number of modules that contain unit u, i is the level of the architecture that is under analysis, Lui is the MDL of the unit u and level i, and
30
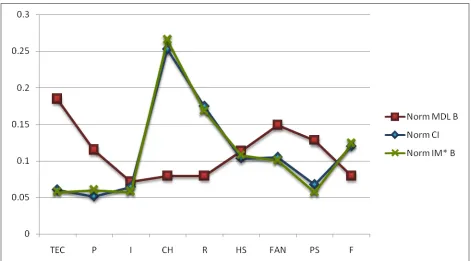
[image:38.612.71.542.143.408.2]This attempt was once again tried on the Water Cooler to verify the assumption and as can be seen in Figure 9 the new impact metric developed highlights the most important findings of both original metrics.
Figure 9Successful attempt on the development of the impact metric.
As stated previously, this attempt seems to capture the elements highlighted by the individual metrics which was the goal of the Impact Metric being a representation of the difficulty to implement a change in an element of the platform based on the number of relationships and their strength that needs to be considered.
Looking closely at Figure 9 it is clear that the element TEC was among the less relevant components of the platform according to the CI, while it was the most significant in the MDL approach. The new IM reconciles both tools and highlights this element as the fourth most relevant. Another interesting case is the element CH which was by far the most coupled element in the platform but not relevant under the MDL approach; IM preserves this element as the most significant of the platform but diminish the difference with the rest of the components.
31
to combine CI and MDL. The formulation may require a tuning process, the inclusion of scaling factors, and the difference in the units used in the CI (arbitrary) and the MDL (bits) may need to be considered, but in the meantime it serves the purpose to describe the impact of change in each one of the elements of a product.
Having this representation defined, the next step is the estimation of the value of a given scenario to facilitate the decision on what the best alternative for the firm is.
4.2.3 Value Assessment
In order to assess the value of a given alternative we need to consider a complete scenario of technologies to integrate and markets to pursue. Faulkner [47] as well as Gonzalez-Zugasti et al. [51] used decision trees as a way to model different alternatives for platform-based product family development, however these decision trees were meant to analyze the whole development process of a platform (see Figure 3); in our case, the development starts with platforms already defined, therefore the decision tree needs to be adapted and generalized for these types of cases (see Figure 10).
32
Figure 10 Decision Tree for technology integration
According to this model, the value of a given alternative would depend on the possible outcomes of the commercialization of the product in the different markets (O), the probability of successful integration (Pint-success), the probability of fit of the product in the different markets (Pfit)
and the required investments (I). An abandonment value could be considered as a way to account for benefits that could be obtained in the process of technology integration that would not depend on the successful development of variants of a given platform. The abandonment value could include, for example, the value of equipment that need to be purchased for the integration of technology but can be sold at the moment to cancel the project. That gives the opportunity to link the impact assessment with the value estimation having IM as a proxy for cost and im as a proxy for the probability of successful integration. The value is calculated as follows:
YES Integrate
Technology?
Pint-success
Market A? YES
Pfit A
time
Decision 1: Invest in technology integration? (I0)
1-Pfit A
NO
1-Pint-success
NO
Variant successfully commercialized in
Market A. Outcomes realized (OA1)
Variant not successful in Market A.
Lower or no outcomes (OA2)
Variant not commercialized for Market A
Technology integration not successful. Abandonment Value? (ABV)
No technology was integrated in the selected platform
Decision 2: Invest in commercialization for market A? (IA)
Decision Q+1: Invest in commercialization for market Q? (IQ)
Market Q? YES
Pfit Q
1-Pfit Q
NO
Variant successfully commercialized
in Market Q. Outcomes realized (OQ1)
Variant not successful in Market Q.
Lower or no outcomes (OQ2)
33
(
)
(
)
(
)
(
)
(
)
(
)
(
)
(
)
(
)
(
)
(
)
(
)
(
)
(
)
(
int)
(
)
01 2 1 int 0 int 2 1 2 1 int 1 . 1 0 , 1 1 . 1 . max . 1 . 1 0 , 1 1 . 1 . max 0 , 1 1 . 1 . max . I ir ABV P ir I ir O P O P P V I ir ABV P ir I ir O P O P ir I ir O P O P P V ta success Q j ti j tc j j fit j j fit success h k ta success ti Q tc Q Q fit Q Q fit ti A tc A A fit A A fit success h k j j Q Q A A − + − + ⎥ ⎥ ⎦ ⎤ ⎢ ⎢ ⎣ ⎡ ⎟ ⎟ ⎠ ⎞ ⎜ ⎜ ⎝ ⎛ ⎭ ⎬ ⎫ ⎩ ⎨ ⎧ + − + − + = − + − + ⎥ ⎥ ⎦ ⎤ ⎭ ⎬ ⎫ ⎩ ⎨ ⎧ + − + − + + ⎢ ⎢ ⎣ ⎡ + ⎭ ⎬ ⎫ ⎩ ⎨ ⎧ + − + − + = − = − − − − −
∑
K (14) where:Vk-h is the value of integrating technology k in platform h,
Pint-success is the probability of a successful integration of technology k in platform h, Pfit A is the probability of success of the variant in market A,
OA1 is the expected outcome or payoff of the successful product in market A, OA2 is the expected outcome or payoff of the non-successful product in market A, IA is the investment required to commercialize the product in market A,
Q is the number of identified markets of possible fits with technology k and platform h, Pfit Q is the probability of success of the variant in market Q,
OQ1 is the expected outcome or payoff of the successful product in market Q, OQ2 is the expected outcome or payoff of the non-successful product in market Q, IQ is the investment required to commercialize the product in market Q,
ABV is the abandonment value of the technology integration,
I0 is the investment required to develop the technology integration and generate a variant.
The operator max represents the ability to exercise the option to commercialize the variant in a given market only if it seems to surpass the investment required to do it, otherwise the value is 0 that represents the decision of not to commercialize the variant in that market.
In order to better understand the value estimation model, a detailed explanation of each of the parameters involved can be found in the following paragraphs.
34
previous section. The normalized impact metric (im) was used because it was already bounded between 0 and 1, therefore the probability of success in the technology integration is inverse to the effort that is required to change the platform.
∑
=
− = − ×
n
i
i i success im
P
1
int 1 α (15)
where:
imi is the normalized impact metric of each component/module at the level of the analysis, n is the number of components/modules defined at the level of analysis,
αi =1 if the component/module changes with the technology integration or, αi =0 if the component/module does not change with the technology integration.
The investment required to develop the technology integration (I0) would depend not only on how difficult it is to integrate the technology but also on the nature of the industry that is developing the product. A scaling factor beta has been used to capture the relationship between investment and IM. This scaling factor could be determined by looking at historical data of how much it cost to integrate a new technology and what its IM was. The premise is that this scaling factor is industry dependant but it requires further research to verify this relationship. Therefore the investment could be estimated as follows:
β α ⎟×
⎠ ⎞ ⎜
⎝
⎛ ×
=
∑
= ni
i i IM I
1
0 (16)
where:
IMi is the impact metric of each component/module at the level of the analysis, n is the number of components/modules defined at the level of analysis,
αi =1 if the component/module changes with the technology integration or, αi =0 if the component/module does not change with the technology integration,
β is the scaling factor according to the nature of the industry that is developing the product relating the investment in dollars with the IM of the elements [$/IM#].
35
The probability of success of the variant in a given market (Pfit) would be given by a Monte Carlo simulation with the characteristics of the market and the characteristics of the product that would be introduced. In order to mitigate the errors in the estimation a probability distribution could be fit for this parameter. Gonzalez-Zugasti et al. [51] suggested that this probability could be linked to the customer requirements and the performance of the variant in order to fulfill those requirements, estimating probability distributions for both (requirements and performance) and analyzing if those intersect for each of the selected parameters. For this work, it was assumed that the company would be able to determine the probability distributions for this parameter based on the market studies conducted for the project.
The investment required to commercialize the product in a given market (IA) would depend on the market that is being pursued and the type of product. However the investment could be estimated based on historical data and a probability distribution can capture the possible deviations from that estimate. For this work, it was assumed that the historical data was available for the company and that similar projects have been realized, allowing the firm to estimate the values for this parameter.
To conclude, the expected outcome or payoff of the product in a given market should be estimated in two scenarios, the successful and the non-successful introduction of the product in the market. The first could be the goal of market share for the variant under development while the second could be a pessimistic scenario of the introduction of the variant in the market; the marketing department of the firm would have a great input at this stage because through their market studies the forecast could be more accurate. The outcome can be modeled as a probability distribution to account for the variability in the response.
4.2.3.1Value Simulation
36
37
5
Application Case
[image:45.612.80.538.200.537.2]The alternative assessment section of the framework was applied to a thermoelectric water cooler platform initially studied by Mark Martin in his doctoral thesis [36] and subsequent journal article [37]. An exploded view of the system can be seen in Figure 11.
Figure 11 Water cooler [36]
38
[image:46.612.71.528.158.387.2]Platform A has no modules defined at the level that is under analysis (see Figure 12), on the other hand Platform B has two modules grouping the electric components: the TEC, the heat sink, the fan, and the power supply (see Figure 13) in order to facilitate the outsourcing of those components.
[image:46.612.75.541.418.653.2]Figure 12 Water cooler’s Platform A
Figure 13 Water cooler’s Platform B
TEC R
P
I
WB
CH
PS F
External
Water Cooler
FAN HS M1
M2 O11
O12
O13
O14 O21
O22 TEC R
P
I
WB
CH
PS F
External
Water Cooler
FAN HS
M1
39
The following assumptions were made in order to complete the scenario:
• The integration of the technology would affect not only the TEC but the design of the Reservoir (R), the Heat Sink (HS), and the Fan.
• The goal for market share out of this variant has been estimated at $120 million. • The commercialization of the water cooler is estimated at $15 million but it could go
from $10 to $23 million based on historical data.
• There is historical data of similar technology integration projects.
• The probability of market success is estimated at 0.4 but it could go from 0.2 to 0.7. • The abandonment value is considered around $10 million.
After the technology to integrate has been identified, along with the elements that would be affected, and the platforms have been reviewed with an understanding of the structure of the available platforms, the assessment of the alternatives can proceed to the impact assessment.
5.1 Impact Assessment
The next step is to characterize each element of the platforms (see Figure 12 and Figure 13, WB is Water Bottle, R is Reservoir, I is Insulation, CH is Chassis, P is Plumbing, HS is the Heat Sink, PS is Power Supply, and F is Fascia) and evaluate the graphs according to the MDL.
[image:47.612.185.428.537.661.2]First the MDL calculations are made for the Platform A of the water cooler (without modules defined), the results are shown in Table 3. The lengths are normalized dividing each one by the sum of all lengths.
Table 3. MDL estimation for water cooler Platform A.
Unit Links Length Norm MDL1
TEC 5 -Log25/50
=Log210
3.321928095 0.114813493
P 3 Log250/3 4.058893689 0.140284723
I 7 Log250/7 2.836501268 0.098036023
CH 6 Log225/3 3.058893689 0.105722417
R 6 Log225/3 3.058893689 0.105722417
HS 6 Log225/3 3.058893689 0.105722417
FAN 7 Log250/7 2.836501268 0.098036023
PS 4 Log225/2 3.64385619 0.12594007
F 6 Log225/3 3.058893689 0.105722417
Total 50 28.93325527 1
The graph of the platform B is also analyzed and the results of the MDL calculations can be seen in Table 4.
40
Inside Module M2
Unit Links Length
TEC 2 1.5849625
HS 2 1.5849625
FAN 2 1.5849625
Total 6 4.7548875
Interfaces of M2
Unit Links Length
O21 1 1
O22 1 1
Total 2 2
Inside Module M1
Unit Links Length
M2 2 1
PS 2 1
Total 4 2
Interfaces of M1
Unit Links Length
O11 2 2.5849625
O12 4 1.5849625
O13 4 1.5849625
O14 2 2.5849625
Total 12 8.33985
Main Level
Unit Links Length
M1 12 1.22239242
P 3 3.22239242
I 7 2
CH 6 2.22239242
R 6 2.22239242
F 6 2.22239242
Total 28 11.88957
General
Unit Length Norm MDL2
TEC =TEC+O11+O21 5.169925001 0.18474372
P 3.222392421 0.11514998
I 2 0.071468627
CH 2.222392421 0.079415667
R 2.222392421 0.079415667
HS =HS+O12 3.169925001 0.113275093
FAN =FAN+O13+O22 4.169925001 0.149009406
PS =PS+O14 3.584962501 0.128106173
F 2.222392421 0.079415667
Total 27.98430719 1
The MDL description changes significantly going from Platform A to Platform B, and that is precisely what it should reflect, the complexity of the architecture. A comparative graph can be seen in Figure 14.
41
[image:49.612.53.565.248.691.2]Figure 14 MDL
![Figure 1 Framework Overview [10]](https://thumb-us.123doks.com/thumbv2/123dok_us/58427.5422/11.612.74.530.69.474/figure-framework-overview.webp)
![Figure 2 Combined component and team interaction DSM [29]](https://thumb-us.123doks.com/thumbv2/123dok_us/58427.5422/20.612.72.535.163.422/figure-combined-component-team-interaction-dsm.webp)
![Table 1. CI Rating system for sensitivity [36]](https://thumb-us.123doks.com/thumbv2/123dok_us/58427.5422/21.612.88.453.407.481/table-ci-rating-sensitivity.webp)
![Figure 3 Generalized platform-based product family development [51].](https://thumb-us.123doks.com/thumbv2/123dok_us/58427.5422/25.612.108.529.288.535/figure-generalized-platform-based-product-family-development.webp)
![Table 2. Equivalencies in real options application [53]](https://thumb-us.123doks.com/thumbv2/123dok_us/58427.5422/26.612.61.557.266.404/table-equivalencies-real-options-application.webp)
![Figure 6 Graph example adapted from [25]](https://thumb-us.123doks.com/thumbv2/123dok_us/58427.5422/33.612.66.438.426.678/figure-graph-example-adapted-from.webp)