International Journal of
ELECTROCHEMICAL
SCIENCE
www.electrochemsci.org
Effect of Sigma Phase Precipitation on the Pitting Corrosion
Mechanism of Duplex Stainless Steels
Wang Yongqiang1, Sun Hao1, Li Na2*, Xiong Yanhao1, Jing Hemin1
1
School of Materials Science and Engineering, Anhui University of Technology, Maanshan, Anhui, 243002, China
2
School of Metallurgical Engineering, Anhui University of Technology, Maanshan, Anhui, 243002, China
*
Corresponding author, E-mail: linaustb@163.com
Received: 29 May 2018/ Accepted: 27 July 2018 / Published: 1 September 2018
A new phenomenon of the pitting corrosion of three duplex stainless steels (DSSs), SAF2205, SAF2507 and Z3CN20.09M, induced by sigma phases is found and discussed. The pitting potential (Ep) of all three DSS specimens with smaller variations in the level of Cr content is remarkably higher
than that of specimens with larger variations in Cr content, although they contain almost the same sigma precipitates. Even if there is much sigma phase in specimens with smaller variations in Cr content, they still present more resistance to pitting corrosion by high Ep values. The EIS results and
microstructures of the DSS specimens after polarisation tests are in accordance with the potentiodynamic anodic polarisation results. The pitting of DSS induced by sigma precipitation is mainly ascribed to the level of difference in Cr content between the sigma phase and Cr-depleted zone and not only to the Cr-depleted zone itself.
Keywords:duplex stainless steel; sigma phase; Cr content difference; potentiodynamic polarisation;
pitting corrosion
1. INTRODUCTION
propagation and stable growth[2]. Any of these stages may be considered to be critical; nevertheless, the initiation step, which is essential to pitting, is most important. This stage is mainly a local breakdown of the passive film and is associated with the subsequent metastable pitting and stable growth. Once the passive film breaks down and a pit initiates, there is a possibility that a stable pit will grow[1].
Many contested models of pitting corrosion exist, but one undisputed aspect is that manganese sulphide inclusions play a critical role[3-7]. It is well-known that pitting on stainless steels starts preferentially at sulphide inclusions, notably at MnS particles physically associated with oxides due to their dissolution or chemical changes in and around sulphide inclusions, which induce the passive film breakdown[6, 8, 9]. However, the MnS theory may be invalid for some super clean steels containing very low sulphur impurity. In these steels, there is not sufficient MnS inclusion for sustaining the mass exchange inside and outside the pits during anodic reaction. Therefore, pit initiation induced by MnS is not ensured in these steels. Pitting corrosion is attributed to other factors. It should be noted that, whereas localized dissolution following breakdown of an otherwise protective passive film is the most common and technologically important type of pitting corrosion, pits can form under other conditions as well. For instance, pitting can occur during active dissolution if certain regions of the sample are more susceptible and dissolve faster than the rest of the surface[1, 10]. In fact, any factor that causesdefects in passive film or chemical or physical heterogeneity at the surface, such as inclusions, second phase particles, solute-segregated grain boundaries, flaws, mechanical damage, or dislocations, is considered a possible reason for pitting corrosion. These factors can lead to a difference in property between different areas of the passive film and damage the protection of the passive film. Our previous work has shown that the micro-segregation of both chemical and secondary precipitated particles can degrade the pitting corrosion resistance of DSS[11-13]. In other studies, coincident conclusions have also been made[14-17]. Thus, another undisputed aspect is that secondary precipitates play an important role in the initiation of pitting corrosion of stainless steel.
Sigma, a hard and brittle Cr-rich phase, is one of the most common precipitates in duplex stainless steels (DSS) when exposed to temperatures ranging from 600-1000℃[18, 19]. It not only severely decreases the toughness of stainless steels but also negatively impacts localized corrosion resistance. Much work on the effect of sigma phase on the pitting corrosion of stainless steels has been done in the past decades[14, 16, 20, 21]. The occurrence of Cr-depleted zones around sigma phases has been undoubtedly considered as the mechanism for pit initiation known as “Cr-depleted theory”;however, some questions remain unclear. On the one hand, previous studies have indicated that the pitting corrosion resistance of DSS decreases with ageing time due to the increase of the sigma phase[22, 23]. However, with the increase of sigma phases, the difference in Cr concentration between Cr-depleted zones and sigma phases also enlarges owing to the strong dependence of the nucleation and growth of sigma on the uphill diffusion of Cr element, as the eutectoid decomposition of ferrite α
σ+γ2. Therefore, the more important factor for pit initiation should be clarified. On the other hand,
mechanism of the sigma effect on pitting corrosion to clarify these above problems. However, few attempts have been taken to focus on this in previous works.
In the present paper, three different DSS, SAF2205, SAF2507 and Z3CN20.09M, are adopted to elucidate the pitting mechanism induced by sigma precipitation. SAF2205 and SAF2507 are typical austenite(γ)-ferrite(α) duplex stainless steels widely used for energy, chemical petrochemical, and marine industries. The ratio of α and γ is approximately 1:1. Meanwhile, Z3CN20.09M stainless steel is different from SAF2205 and SAF2507 and is characterized by a dual-phase microstructure in which less α-ferrite phase is distributed in the γ-austenite matrix. There are also differences in chemical composition and microstructure among SAF2205, SAF2507 and Z3CN20.09M DSS. The investigation results of different DSScan more convincing.
2. MATERIALS AND EXPERIMENTAL
2.1 Materials
[image:3.596.46.564.416.491.2]Three types of duplex stainless steels, SAF2205, SAF2507 and Z3CN20.09M, were adopted, and their chemical compositions are listed in Table 1.
Table 1.Chemical compositions of three duplex stainless steels (wt.%).
Type Elements(wt%)
C Si Mn P S Cr Ni Mo N Fe
SAF2205 0.023 0.38 1.35 0.026 0.001 22.07 4.83 2.37 0.19 balance SAF2507 0.023 0.497 1.55 0.020 0.001 25.15 7.37 4.35 0.25 balance Z3CN20.09M 0.027 1.27 1.13 0.023 0.0009 20.19 8.92 0.21 0.031 balance
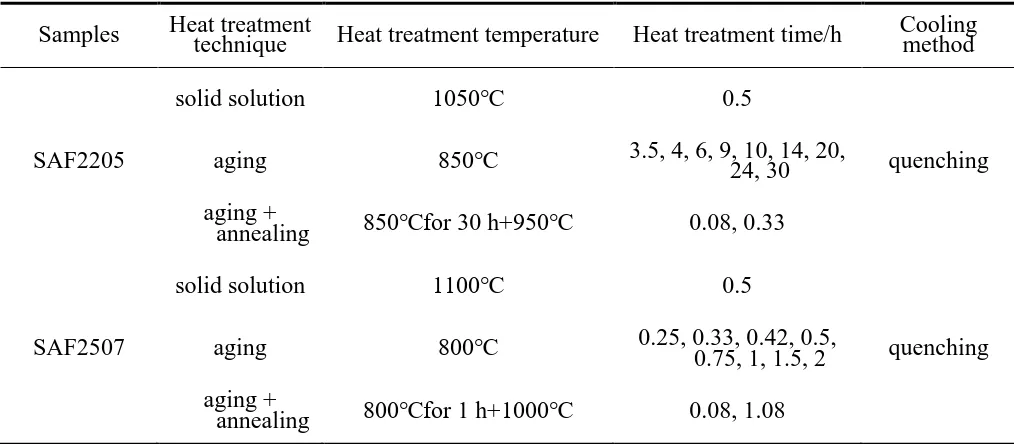
Table 2.Heat treatment technique of three duplex stainless steels.
Samples Heat treatment technique Heat treatment temperature Heat treatment time/h Cooling method
solid solution 1050℃ 0.5
quenching SAF2205 aging 850℃ 3.5, 4, 6, 9, 10, 14, 20, 24, 30
aging +
annealing 850℃for 30 h+950℃ 0.08, 0.33
solid solution 1100℃ 0.5
SAF2507 aging 800℃ 0.25, 0.33, 0.42, 0.5, 0.75, 1, 1.5, 2 quenching aging +
[image:3.596.44.551.532.754.2]Z3CN20.09M
solid solution
aging 1180℃ 750℃
0.5
4, 10, 12, 22, 24, 50,
100 quenching
aging +
annealing 750℃for 100 h+860℃ 750℃for 50 h+860℃ 0.25, 0.5, 1 0.5
SAF2205, SAF2507 and Z3CN20.09M DSS were respectively annealed at 1050℃, 1100℃, 1180℃ for 0.5 h for the solid solution first. Then, the three different DSS were aged at different temperatures for different times to obtain different amounts of sigma phase. Furthermore, some of the aged DSS samples were annealed at high temperature for a certain time for acquiring different Cr concentrations in the Cr-depleted zone. The detailed heat treatment parameters are shown in Table 2.
2.2 Microstructure examination
The three annealed and aged DSS were cut into small specimens with a size of 10 ×10 × 10 mm for revealing the microstructure and examining the pitting corrosion resistance. The specimens were abraded using silicon carbide abrasive paper to 2000# and then polished by diamond paste with a size of 1.5μm. Finally, the specimens were electrochemically etched for 10-20 s in a 20 wt% NaOH solution in distilled water with a direct voltage of 3 V in order to differentiate the ferrite, austenite and sigma phases. The microstructures of the specimens were observed by optical microscopy (OM) and scanning electron microscopy (SEM). The ferrite content and volume fraction of the sigma phases of the specimens were calculated on 20 optical measurements for each specimen by using a quantitative metallography analysis software (Image-Pro Plus 6.0).
2.3 Micro-composition examination
Aged and annealed specimens were abraded using silicon carbide abrasive paper to 2000# and then polished by diamond paste with a size of 1.5μm; finally, they were rinsed in distilled water, ultrasonically cleaned in anhydrous alcohol and dried in air for examination of the composition of sigma phases and depleted zones. The quantitative compositions of the sigma phases and Cr-depleted zones in the specimens were measured by the energy dispersive spectrometer (EDS) in the SEM using the backscattered electron (BSE) technique.
2.4 Electrochemical measurements
Pitting corrosion studies were carried out in a 0.5 molL-1NaCl solution at constant temperature (30±1°C) by potentiodynamic anodic polarisation and electrochemical impedance spectroscopy (EIS) techniques to evaluate the pitting potential (Ep) and the passive layer breakdown of the specimens,
respectively. Ep is defined as the potential at which the current increases sharply from the passive
current level[1].
Before testing, the working electrodes were immersed in the test solution for 15 min until steady-state open circuit potential (OCP) was reached. In addition, a potential sweep was applied in the anodic direction at a scan rate of 20 mVmin-1 from -400 mV (SCE) to an appropriate value. EIS measurements were carried out using the frequency range of 100 kHz to 0.01 Hz at the OCP. Amplitudes of all sinusoids were equal to 10 mV. The EIS results were interpreted by using an equivalent circuit. The characteristic parameter values of these elements in an equivalent circuit were then obtained directly by fitting the experimental curves using Zview Version 3.1® software.
3. RESULTS AND DISCUSSION
3.1 Microstructures and micro-composition of the three DSS specimens
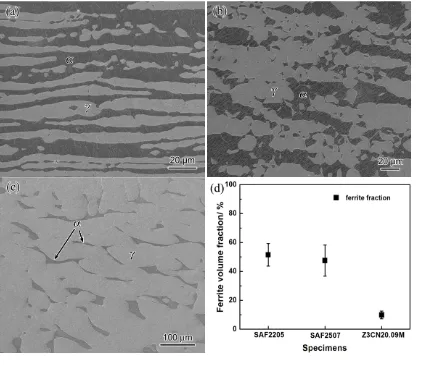
Figure 1. Microstructures of different specimens: (a) SAF2205, (b) SAF2507, and (c)
[image:5.596.93.523.342.707.2]Figure 2. Microstructures of different specimens: (a) SAF2205 aged at 850℃ for (a-1) 3.5 h, (a-2) 9 h, and (a-3) 30 h; (b) SAF2507 aged at 800℃ for (b-1) 0.33 h, (b-2) 0.42 h, and (b-3) 1 h; and (c) Z3CN20.09 M aged at 750℃ for (c-1) 4 h, (c-2) 24 h, and (c-3) 100 h.
Figure 3. SEM micrographs of different DSS specimens: (a) SAF2205, (b) SAF2507 and (c)
[image:6.596.139.459.365.666.2](c-2)aged at 750℃ for 4 h and 10 h, respectively; (c-3) aged at 750℃ for 50 h after annealing at 860 ℃ for 0.5 h, and (c-4) aged at 750℃ for 100 h after annealing at 860 ℃ for 1 h.
0 6 12 18 24 30 2
4 6 8
(b)
SAF2205 aged at 850 ℃
A
0.0 0.4 0.8 1.2 1.6 2.0 2.4
2 4
6 SAF2507 aged at 800 ℃
0 20 40 60 80 100 120
5 10
15 Z3CN20.09Maged at 750 ℃
G 0 5 10 15 20 25 30
4 8 12 16 D if fer enc e in C r co nt ent bet w ee n σ a nd C r-d epl eted z o ne /%
Aging time / h
SAF2205 aged at 850 ℃
Aging time / h
Vo lu m e fr ca tio n o f σ /% (a)
0.0 0.4 0.8 1.2 1.6 2.0 2.4
0 6 12 18 24
SAF2507 aged at 800 ℃
4 8 12 16 20 24
1.8 2.4 3.0
[image:7.596.164.433.360.757.2]3.6 Z3CN20.09Maged at 750 ℃
Figure 4. Volume fraction of sigma phases (a) and difference in Cr content between the sigma phase
and Cr-depleted zone (b) in three aged DSS specimens.
4 6 8 10 12 (a)
850℃/ 30h+ 950℃/ 0.33h 850 ℃/ 30h+
950 ℃/ 0.08h 850℃/ 9h
Diff er en ce in C r c o n ten t b etwe en σ a n d C r-de p lete d z o n e /% V ol ume f rcat ion of σ /%
Volume frcation of σ
Specimens 850 ℃/ 3.5h
1.0 1.5 2.0 2.5 3.0 3.5
Difference in Cr content between σand Cr-depleted zone
6 8 10 12 (b)
800 ℃/ 1h+ 1000 ℃/ 1.08h 800 ℃/ 1h+
1000 ℃/ 0.08h 800℃/0.42h
Diff er en ce in C r c o n ten t b etwe en σ a n d C r-de p lete d z o n e /% V ol ume f rcat ion of σ /%
Volume frcation of σ
Specimens
800℃/ 0.33h
3.0 3.5 4.0 4.5 5.0 5.5 6.0
1.5 2.0 2.5 3.0 3.5 4.0 (C)
750 ℃/ 50h+ 860 ℃/ 0.5h 750 ℃/ 100h+
860 ℃/ 1h 750 ℃/ 10h
Diff er en ce in C r c o n ten t b etwe en σ a n d C r-de p lete d z o n e /% V ol ume f rcat ion of σ /%
Volume frcation of σ
Specimens 750 ℃/ 4h
2 4 6 8 10 12 14
[image:8.596.163.426.128.312.2]Difference in Cr content betweenσand Cr-depleted zone
Figure 5. Different in Cr content between the sigma phase and Cr-depleted zone in three DSS
specimens with nearly the same amount of sigma phase: (a) SAF2205, (b) SAF2507 and (c) Z3CN20.09M specimens.
Fig. 1 shows the microstructures of solid solution SAF2205, SAF2507 and Z3CN20.09M DSS specimens, which consist of both austenite (grey) and ferrite (dark) phases. No other phase is observed in these specimens.
Moreover, the volume fractions of ferrite phase in three DSS specimens are approximately 51.5%, 47.5% and 9.9%, respectively (Fig. 1d). The ratios of austenite and ferrite phases are determined by Cr and Ni equivalents of stainless steel[24]. The microstructures of the aged specimens are shown in Fig. 2. Fig. 3 shows the SEM micrographs of different aged and annealed DSS specimens examined using the BSE signal model, and the Arabic numbers in the figure are the examination positions of the elemental contents by EDS. The sigma phase formed in the ferrite of DSS following the decomposition: α → σ + γ2; the formation is mainly controlled by Cr diffusion and belongs to
diffusion phase transformation[25, 26]. Therefore, the number of sigma phases in all three DSS aged at different temperatures increased with ageing time (Fig. 4a). Meanwhile, it can be concluded that Cr concentration in and around the sigma phase changes with the precipitation and growth of the sigma phase and that the difference in Cr content between the sigma phase and secondary austenite (Cr-depleted zone) increases with ageing time due to the continuous diffusion of Cr into the sigma phase (Fig. 4b).
of sigma phase was achieved in specimens with different variations in Cr content between the sigma phase and Cr-depleted zone using appropriate annealing and ageing techniques, as shown in Fig. 5.
3.2 Potentiodynamic anodic polarisation curves of aged DSS specimens
-0.4 -0.2 0.0 0.2 0.4 0.6 0.8 1.0 1.2 1.4 -9 -8 -7 -6 -5 -4 -3 (a) lo g i / A
·
cm -2ESCE/ V
850℃/3.5h 850℃/4h 850℃/6h 850℃/9h 850℃/10h 850℃/14h 850℃/20h 850℃/30h 1050℃/0.5h
-0.6 -0.4 -0.2 0.0 0.2 0.4 0.6 0.8 1.0 1.2 -10 -9 -8 -7 -6 -5 -4 -3 (b) lo g i / A · cm -2
ESCE / V
800℃/0.25h
800℃/0.33h
800℃/0.42h
800℃/0.5h
800℃/0.75h
800℃/1h
800℃/1.5h
1100℃/0.5h
-0.6 -0.4 -0.2 0.0 0.2 0.4 -9 -8 -7 -6 -5 -4 -3 (C) lo g i / A · cm -2
ESCE / V
750℃/4h 750℃/10h 750℃/22h 750℃/24h 750℃/50h 750℃/100h 1050℃/0.5h
[image:9.596.183.394.169.713.2]Fig. 6 shows the polarisation curves of three different DSS specimens immersed in 0.5 mol L−1NaCl solution. Based on the polarisation curves, the variation in pitting potential (Ep), corrosion
[image:10.596.47.553.164.339.2]potential (Ecorr) and corrosion currents (Icorr) of the specimens can be found, as shown in Table 3.
Table 3.Potentiodyamic polarisation parameters of three DSS specimens in 0.5 mol·L-1NaCl solution.
Specimens Heat treatment (T/h) Ep/V Ecorr/V log(icorr/A)
SAF2205
1050℃/0.5 1.122 -0.1549 2.044e-007
850℃/3.5 0.315 -0.2817 6.514e-007
850℃/9 0.205 -0.2916 6.106e-007
850℃/20 0.130 -0.2949 5.979e-007
850℃/30 0.096 -0.2811 5.906e-007
SAF2507
Z3CN20.09M
1100℃/0.5
800℃/0.25 1.036 0.962 -0.1771 -0.3170 5.882e-008 4.180e-007
800℃/0.33 0.600 -0.3098 6.964e-007
800℃/0.42 0.400 -0.3128 3.980e-007
800℃/0.75 0.255 -0.2832 6.034e-007
1050℃/0.5 0.122 -0.2945 3.972e-007
750℃/4 0.010 -0.3095 9.511e-007
750℃/10 -0.081 -0.3165 9.181e-007
750℃/24 -0.124 -0.2987 9.650e-007
750℃/50 -0.152 -0.3285 1.153e-006
It can be seen that Ep decreased with ageing time, which is consistent with the increase of
sigma in the specimens with ageing time. It suggests that the pitting resistance of the three aged DSS specimens becomes worse with the increase of ageing time. Clearly, the decrease in pitting corrosion resistance in the aged specimens is directly attributed to the formation of sigma phases. The pitting corrosion resistance of duplex stainless steel is significantly affected by metallurgical variables, such as microstructure, inclusions, precipitates, alloy composition and heat treatment[1, 11, 27] Certain precipitated phases can act as sites for the preferential initiation of pits, whereas others can cause micro-segregation, such as depletions, of chromium, nitrogen and molybdenum. Clearly, the depleted zones induce pits on the steel surface. As mentioned previously, the formation of sigma phase in the three DSS causes the Cr-depleted zone. The interface between the Cr-rich precipitates and secondary austenite becomes the preferential site for pit initiation; subsequently, pits grow in the secondary austenite (Cr-depleted zone)[20, 23]. Therefore, the pitting corrosion resistance of the three DSS specimens decreased with increasing sigma phase. However, with the increase of sigma phases, the difference in Cr concentration between Cr-depleted zones and sigma phases also enlarges owing to the nucleation and growth of sigma that is strongly dependent on the uphill diffusion of Cr element, as the eutectoid decomposition of ferrite is ασ+γ2. Therefore, more important factors for pit initiation
should be discussed and clarified.
Fig. 7 displays the polarisation curves of the three DSS specimens with different variations in Cr content between the sigma phase and Cr-depleted zone but with nearly the same amount of sigma phase. Based on the polarisation curves, the variation in pitting potential (Ep) for the different DSS
-0.4 -0.2 0.0 0.2 0.4 0.6 0.8 1.0 1.2 1.4 -10
-9 -8 -7 -6 -5 -4 -3
(a)
ESCE / V
lo
g
i
/
A
·
cm
-2
850℃/30h+950℃/0.33h(Cr%=1.8) 850℃/30h+950℃/0.08h(Cr%=2.0) 850℃/3.5h(Cr%=2.21)
850℃/9h(Cr%=2.87)
-0.6 -0.4 -0.2 0.0 0.2 0.4 0.6 0.8 1.0 1.2 1.4 -9
-8 -7 -6 -5 -4 -3 -2 (b)
lo
g
i
/
A
·
cm
-2
ESCE / V
800℃/0.33h(Cr%=4.56)
800℃/0.42h(Cr%=4.97)
800℃/1h+1000℃/0.08h(Cr%=3.87)
800℃/1h+1000℃/1.08h(Cr%=3.31)
-0.4 -0.3 -0.2 -0.1 0.0 0.1 0.2
-9 -8 -7 -6 -5 -4 -3
(C)
lo
g
i
/
A
·
cm
-2
ESCE / V
750℃/50h+860℃/0.5h(Cr%=11.2)
750℃/100h+860℃/1h(Cr%=12.9)
750℃/4h(Cr%=3.66)
750℃/10h(Cr%=8.44)
[image:11.596.180.415.95.708.2]0.0 0.3 0.6 0.9 1.2 1.5
σ= 11.75% σ= 5.54%
σ= 11.34%
(a)
850 ℃/ 30h+ 950 ℃/ 0.33h 850 ℃/ 30h+
950 ℃/ 0.08h 850 ℃/ 9h
Diff er en ce in C r c o n ten t b etwe en σ a n d C r-de p lete d z o n e /% Ep / V Ep Specimens
850 ℃/ 3.5h
σ= 5.65%
1.0 1.5 2.0 2.5 3.0 3.5 4.0 4.5 Difference in Cr content between σand Cr-depleted zone
0.0 0.3 0.6 0.9 1.2
σ= 6.33%
σ= 10.32%
σ= 10.08%
σ= 6.51%
(b)
800 ℃/ 1h+ 1000 ℃/ 1.08h 800 ℃/ 1h+
1000 ℃/ 0.08h 800 ℃/0.42h
Diff er en ce in C r c o n ten t b etwe en σ a n d C r-de p lete d z o n e /% Ep / V Ep Specimens 800℃/ 0.33h
3.0 3.6 4.2 4.8 5.4 6.0 6.6
Difference in Cr content between σand Cr-depleted zone
-0.15 -0.12 -0.09 -0.06 -0.03 0.00 0.03 0.06 Ep / V
σ= 1.78%
σ= 2.2%
σ=2.5%
σ= 1.7%
(C)
750 ℃/ 50h+ 860 ℃/ 0.5h 750 ℃/ 100h+
860 ℃/ 1h 750 ℃/ 10h
Diff er en ce in C r c o n ten t b etwe en σ a n d C r-de p lete d z o n e /% Ep Specimens 750 ℃/ 4h
2 4 6 8 10 12 14 16 18
[image:12.596.158.438.88.679.2]Difference in Cr content between σand Cr-depleted zone
Figure 8. Variation in pitting potential as the difference in Cr content between sigma and Cr-depleted
This trend of Ep was also found in the SAF2507 and Z3CN20.09M specimens. During upward
scanning in a polarisation experiment, a stable pit starts growing at Ep. It is generally considered that
materials exhibiting higher values of Ep are more resistant to pitting corrosion[1]. Therefore, the pitting
resistance of specimens with smaller variations in Cr content between the sigma phase and Cr-depleted zone is better than that of specimens with higher variations in Cr content, although the specimens contain more sigma phases; for example, the SAF2205 specimens were aged and annealed at 850 ℃/30 h + 950℃/0.08 h, respectively, and the SAF2507 specimens were aged and annealed at 800℃/1 h + 1000℃/0.08 h, respectively. It indicates that the degree of Cr depletion is more sensitive to the pitting corrosion of DSS than the number of Cr-depleted zones. In other words, pitting induced by sigma precipitation is mainly ascribed to the level of difference in Cr content between the sigma phase and Cr-depleted zone and not only to the Cr-depleted zones. In addition, more sigma phases do not always lower the pitting resistance of DSS. Higher resistance to pitting corrosion can be obtained in DSS containing more sigma phases. Therefore, there is no certain relationship between resistance to pitting corrosion and number of sigma phases.
3.3 EIS results of aged DSS specimens
0.0 2.0x10³
4.0x10³ 6.0x10³ 8.0x10³ 1.0x10⁴
0.0
-2.0x10³
-4.0x10³
-6.0x10³
-8.0x10³
750℃/4h
750℃/50h+860℃/0.5h
750℃/10h
750℃/100h+860℃/1h
Z'/ohmcm2
(a)
Z"/
o
hm
cm
2
Fitted line
100 101 102 103 104 105 0.0
0.5 1.0 1.5 2.0 2.5 3.0 3.5 4.0 4.5 (b)
750℃/4h
750℃/50h+860℃/0.5h 750℃/10h
750℃/100h+860℃/1h
lo
g
|Z
| /
o
hm
cm
2
Freq/ Hz
0 -20 -40 -60 -80
Phase
/
deg
Figure 9.The effect of Cr content difference on the (a) Nyquist and (b) Bode plots of Z3CN20.09M specimens measured at open circuit potential with a sinusoidal potential amplitude of 10 mV, running from 100 kHz to 10 mHz in the 0.5 mol L−1NaCl solution at room temperature. (c) Equivalent circuit representative of the electrode interface for the Z3CN20.09M specimens in the 0.5 mol L−1NaCl solution.
Fig. 9 displays the EIS results of different aged and annealed Z3CN20.09M specimens, indicating the effect of Cr content difference on the Nyquist and Bode plots of Z3CN20.09M specimens in 0.5 mol L−1NaCl solution at OCP. One can see that the Nyquist plots are all semi-circular arcs with centres depressed below the x-axis. This type of diagram is usually interpreted as a mechanism of charge transfer on an inhomogeneous surface[28]. Distinct differences in the semicircle arcs for the different specimens in the Nyquist plots can be observed in the figure. With increasing Cr content difference, the diameter of the depressed semicircle decreases. In general, an increase in the semicircle arc radius indicates an increase in the charge-transfer resistance (Rct) value, which is
inversely proportional to the corrosion rate of the system. The semicircle arc radius values of the specimens with smaller variations in Cr content, for example, those aged at 750℃ for 4 h, are significantly larger than those of the specimens with larger variations in Cr content (those aged at 750℃ for 100 h after annealing at 860℃ for 1 h). It means that the charges in the specimens transfer with difficulty through the passive film of the specimens with smaller variations in Cr content.
An equivalent electrical circuit was designed as a best-fit to the experimental results and is displayed in Fig. 8(c). The circuit is composed of an arrangement of [Rs(CPE‖Rct)] elements, where Rs
is the solution resistance and CPE is the constant phase element in parallel connection with Rct, which
is the charge-transfer resistance at the interface. The impedance expression of CPE[29], ZCPE, is given
by
ZCPE = T-1(jω)-n(1)
where ω is the angular frequency, j is the imaginary unit, T is the proportionality factor, nis the phase shift, j= (-1)1/2, and ω= 2πf, where f is the frequency (Hz). The CPE exponent, n, is a measure of capacitance dispersion with values between1 (ideal capacitance) and 0.7 (highly dispersed capacitance, such as at porous electrodes). For n= 0, ZCPE represents resistance with R = T−1; for n= 1, it represents
[image:14.596.195.416.76.226.2]From the table, higher Rct values are observed in the specimens containing small variations in
Cr content, followed by the specimens containing large variations in Cr content. Rct decreased and
reached the lowest value in the specimen aged at 750℃ for 100 h after annealing at 860℃ for 1 h, with a maximum of 12.9% in Cr content difference.
Table 4.Equivalent-circuit element values for EIS data corresponding to Z3CN20.09M specimens
aged and annealed in the 0.5 mol L−1NaCl solution.
specimens Rs(Ω
cm2) CPE-T/F cm
2
CPE-n Rct(Ω
cm2)
750℃/4 h 4.258 2.1062E-5 0.90605 17349
750℃/50 h+860℃/0.5 h 2.217 2.2236E-5 0.87582 4022
750℃/10 h 2.758 2.3181E-5 0.84339 3671
750℃/100 h+860℃/1 h 2.176 2.3726E-5 0.90553 2014
The lower Rct value represents an increased transport of ions through the double-charge layer,
which indicates relatively poor resistance to corrosion. Therefore, the specimens with a maximum Cr content difference of 12.9% had the worst resistance to corrosion. Moreover, the specimen also had the highest CPE-T value among all specimens, suggesting that its passive film presented the worst stability[31]. The same tendency of EIS results were also obtained for the SAF2205 and SAF2507 DSS specimens.
[image:15.596.83.512.196.267.2]3.4 SEM micrographs of DSS specimens after polarisation tests.
Figure 10. SEM microstructures of (a) SAF2205, (b) SAF2507 and (c) Z3CN20.09M DSS aged and
annealed specimens after polarisation testing in the 0.5 mol L−1NaCl solution at room temperature. (a-1) aged at 850℃ for 9 h, (a-2) aged at 850℃ for 30 h after annealing at 950℃ for 0.08 h; (b-1) aged at 800℃ for 0.42 h, (b-2) aged at 800℃ for 1 h after annealing at 1000℃ for 1.08 h; (c-1) aged at 750℃ for 4 h, (c-2) aged at 750℃ for 50 h after annealing at 860℃ for 0.5 h.
[image:16.596.96.505.96.534.2]austenite and ferrite, although these specimens contained more sigma phases (seen in Fig. 10(a-2)). The same results as those for SAF2205 specimens were obtained for the SAF2507 and Z3CN20.09M specimens, as shown in Fig. 10(b) and (c). The high probability of pitting corrosion of specimens with larger variations in Cr content occurring at and/or in the boundaries of austenite and ferrite indicates that the difference in the level of Cr content is more important than the amount of sigma phases (or Cr-depleted zones). This accords with the electrochemical measurement results and supports the above tests.
3.5 Pitting corrosion mechanism of DSS induced by sigma precipitation.
[image:17.596.86.510.248.617.2]Fig. 11 shows the schematic illustration comparing the process of pitting corrosion induced by sigma precipitation in DSS specimens with larger and smaller variations in the level of Cr content. There are three stages of pitting: passive film breakdown, metastable pitting and pit growth. The passive state is required for pitting to occur. The passive film must be formed on the surface of the alloy before pitting occurs; meanwhile, re-passivation still exists during the process of pitting under a certain potential. When the rate of re-passivation is higher than that of passive film thinning or dissolution failure, pitting is inhibited and maintains a metastable state, or it is repaired. However, if the rate of pitting is higher than that of re-passivation, the alloy lose the protection of the passive film thoroughly. Therefore, the properties of the passive film strongly affect the pitting process. In addition, the passive film is determined by the alloy composition of the material when other factors are the same. The variation in Cr content of stainless steel brings composition segregation on the surface of the alloy and induces the defects of passive film. When the aggressive Cl−ions preferentially attack the defects of passive film, as shown in Fig. 11 (a-1) and (b-1), the local electric field strength increases, which may eventually lead to a complete breakdown of the passive film and the formation of a pit[35], as shown in Fig. 11(a-2) and (b-2). The larger the variation in the level of Cr content is, the more inhomogeneity in the passive film; therefore, the protectiveness of the passive film becomes weak. Therefore, lowEp and Rct values for the specimens with larger variations in the level of Cr content are
obtained (Fig. 8 and 9). In addition, once the pits initiate, they can grow stably without re-passivation owing to the pitting rate being higher than the re-passivation rate, as shown in Fig. 11(b-3). Certainly, the Cr-depleted zones or boundaries of the sigma phase and secondary austenite are the most favourable sites for pit initiation because these locations have the most weakness in the passive film (seen in Fig. 10 (a-1), (b-1) and (c-2)). However, in specimens with small variations in the level of Cr content, re-passivation occurred due to the lower composition micro-segregation of Cr element, which makes a certain degree of protection of passive film relative, as shown in Fig. 11(a-3). Metastable pitting remains until higher potential is applied. Therefore, the charge transfers onto the surface of steels with small variation in the level of Cr content with difficulty, and higher Rct and Ep are achieved,
as shown in Fig. 8 and 9. Although more sigma phases produce more Cr-depleted zones, they do not all become the source of pitting, and the probability of pitting at preferential sites of Cr-depleted zone or boundaries of the sigma phase and secondary austenite in these specimens is smaller than that with larger variation in the level of Cr content, as shown in Fig. 10. Consequently, pitting corrosion of DSS induced by sigma precipitation directly contributed to the difference in Cr content between the sigma phase and Cr-depleted zone but not only to the Cr-depleted zone itself.
4. CONCLUSIONS
1. Nearly identical variations in Cr content were obtained in three different DSS specimens, SAF2205, SAF2507 and Z3CN20.09M,which have nearly the same amount of sigma phases, using appropriate ageing and annealing technology.
content is remarkably higher than that of specimens with larger variations in Cr content, although they contain almost the same sigma precipitates. Even if there is more sigma phase in specimens with smaller variations in Cr content, they still present more resistance to pitting corrosion by high Ep
values.
3. With increasing variation in Cr content, the diameter of the depressed semicircle of Nyquist plots decreased. Lower Rct values are observed in DSS specimens containing large variations
in Cr content, representing an increased transport of ions through the double-charge layer, which indicates relatively poor resistance to corrosion.
4. In the specimens with larger variations in Cr content, more pits arose at and/or in the boundaries of austenite and ferrite in which the sigma phase precipitated. In other specimens with smaller variations in Cr content, however, fewer pits appeared at and/or in the boundaries of austenite and ferrite, although these specimens contain more sigma phases.
5. Pitting corrosion of DSS induced by sigma precipitation is mainly ascribed to the difference in Cr content between the sigma phase and Cr-depleted zone and not only to the Cr-depleted zone itself.
ACKNOWLEDGEMENTS
The authors are very grateful for the support from the National Natural Science Foundation of China under No. 51501001 and Anhui Provincial Natural Science Foundation under No. 1508085QE102.
References
1. G.S. Frankel, J. Electrochem. Soc., 145 (1998) 2186.
2. P.C. Pistorius, G. T. Burstein, Phil. Trans. R. Soc. Lond. A, 341 (1992) 531.
3. M.P. Ryan, D.E. Williams, R.J. Chater, B.M. Hutton, D.S. McPhail, Nature, 415 (2002) 770. 4. G.S. Eklund, J. Electrochem. Soc., 121 (1974) 467.
5. G. Wranglen, Corros. Sci., 14 (1974) 331.
6. D.E. Williams, M.R. Kilburn, J. Cliff, G.I.N. Waterhouse, Corros. Sci., 52 (2010) 3702. 7. D.E. Williams, Y.Y. Zhu, J. Electrochem. Soc., 147 (2000) 1763.
8. J. Stewart, D.E. Williams, Corros. Sci., 33 (1992) 457. 9. M.A. Baker, J.E. Castle, Corros. Sci., 34 (1993) 667.
10.Z. Szklarska-Smialowska, Pitting corrosion of metals,NACE, (1986) Houston, America,. 11.Y.Q. Wang, N. Li, B. Yang, Corros. Eng. Sci. Techn., 50 (2015) 330.
12.Y.Q. Wang, B.Yang, J. Han, H.C. Wu, X.T. Wang, Mater. Trans., 54 (2013) 839.
13.Y.Q. Wang, D. D. Li, L. Sun, N. Li, M. K. Liu, W. Shen, H.M. Jing, Corros. Eng. Sci. Techn., 52 (2017) 447.
14.N. Lopez, M. Cid, M. Puiggali, Corros. Sci., 41 (1999) 1615.
15.K.N. Adhe, V. Kain, K. Madangopal, H.S. Gadiyar, J.Mater.Eng. Perform., 5 (1996) 500. 16.H.M. Ezuber, A. El-Houd, F. El-Shawesh, Desalination., 207 (2007) 268.
17.L.H. Zhang, Y.M. Jiang, B. Deng, W. Zhang, J.L. Xu, J. Li, Mater. Charact., 60 (2009) 1522. 18.J.O. Nilsson, Mater. Sci. Techn., 8 (1992) 685.
19.K.H. Lo, C.H. Shek, J.K.L. Lai, Mater. Sci. Eng. R., 65 (2009) 39. 20.Y.S. Ahn, J.M. Kim, B.H. Jeong, Mater. Sci. Tech., 18 (2002) 383.
21.H. Tan, Y.M. Jiang, B. Deng, T. Sun, J.L. Xu, J. Li, Mater. Charact., 60 (2009) 1049.
23.J.O. Nilsson, A. Wilson, Mater. Sci. Tech., 9 (1993) 545.
24.R.N. Gunn, Duplex stainless steels: Microstructure, properties and applications,Abington, (1997)Cambridge, England.
25.R. Magnabosco, Mater. Res., 12 (2009) 321.
26.Y.Q. Wang, J. Han, B. Yang, H.C. Wu, X.T. Wang, Acta. Materialia Sin., 49 (2013) 415.
27.L.H. Zhang, W. Zhang, Y.M. Jiang, B. Deng, D.M. Sun, J. Li, Electrochim. Acta., 54 (2009) 5387. 28.P. Bommersbach, C. Alemany-Dumont, J.P. Millet, B. Normand, Electrochim. Acta., 51 (2005)
1076.
29.J.R. Macdonald, Impedance Spectroscopy—Emphasizing SolidMaterials and Systems, Wiley,
(1987)New York, America.
30.M. Kissi, M. Bouklah, B. Hammouti, M. Benkaddour, Appl.Surf. Sci., 252 (2006) 4190. 31.W.S. Li, N. Cui, J.L. Luo, Electrochim. Acta., 49 (2004) 1663.
32.C.O.A. Olsson, D. Landolt, Electrochim. Acta., 48 (2003) 1093. 33.I. Olefjord, B. Elfstrom, Corrosion., 38 (1982) 46.
34.J. Horvatha, H. H. Uhlig, J. Electrochem. Soc., 115 (1968) 791. 35.T.P.Hoar, D.C.Mears, G.P.Rothwell, Corros. Sci., 5 (1965) 279.