arXiv:astro-ph/0601082 v2 9 Jan 2006
Astronomy & Astrophysicsmanuscript no. 4051CON2 June 27, 2006
(DOI: will be inserted by hand later)
Desorption rates and sticking coefficients for CO and N
2
interstellar ices
S. E. Bisschop
1, H. J. Fraser
2, K. I. ¨
Oberg
1,3, E. F. van Dishoeck
1, and S.Schlemmer
41 Raymond and Beverly Sackler Laboratory for Astrophysics at Leiden Observatory, Postbus 9513, 2300 RA Leiden, Netherlands
2 Department of Physics, University of Strathclyde, 107 Rottenrow East, Glasgow G4 ONG, Scotland
3 Division of Geological and Planetary Sciences, California Institute of Technology, Mail Stop 150-21, Pasadena, CA 91125, USA
4 I. Physikalisches Institut, Universit¨at zu K¨oln, Zulpicher Strasse 77, 50937 K¨oln, Germany
Received ¡date¿/Accepted ¡date¿
Abstract.We present Temperature Programmed Desorption (TPD) experiments of CO and N2ices in pure, layered and mixed morphologies at various ice “thicknesses” and abundance ratios as well as simultaneously taken Reflection Absorption Infrared Spectra (RAIRS) of CO. A kinetic model has been developed to constrain the binding energies of CO and N2in both pure and mixed environments and to derive the kinetics for desorption, mixing and segregation. For mixed ices N2 desorption occurs in a single step whereas for layered ices it proceeds in two steps, one corresponding to N2 desorption from a pure N2 ice environment and one corresponding to desorption from a mixed ice environment. The latter is dominant for astrophysically relevant ice “thicknesses”. The ratio of the binding energies,RBE, for pure N2 and CO is found to be 0.936±0.03, and to be close to 1 for mixed ice fractions. The model is applied to astrophysically relevant conditions for cold pre-stellar cores and for protostars which start to heat their surroundings. The importance of treating CO desorption with zeroth rather than first order kinetics is shown. The experiments also provide lower limits of 0.87±0.05 for the sticking probabilities of CO-CO, N2-CO and N2-N2 ices at 14 K. The combined results from the desorption experiments, the kinetic model, and the sticking probability data lead to the conclusion that these solid-state processes of CO and N2 are very similar under astrophysically relevant conditions. This conclusion affects the explanations for the observed anti-correlations of gaseous CO and N2H+ in pre-stellar and protostellar cores.
Key words.astrochemistry, molecular processes, methods: laboratory, ISM: molecules, ISM: clouds
1. Introduction
CO and N2 are two of the most abundant species in
molecu-lar clouds and therefore control the abundances of many other molecules. CO is the second most abundant molecule after H2, both in the gas phase and in the solid state. Gaseous CO
abundances up to 2.7×10⁻⁴ with respect to H2 are found in
warm regions (Lacy et al., 1994), indicating that CO contains most of the carbon not locked up in refractory material. In cold clouds, CO ice absorption features are seen superposed on the spectra of background sources or embedded protostars (e.g., Chiar et al., 1994; Pontoppidan et al., 2003). The solid CO abundance varies strongly from source to source, but can be as high as 10−4 with respect to H
2 in the coldest cores
(Pontoppidan et al., 2005). Such high abundances are consis-tent with indirect determinations of the amount of CO frozen out in the densest parts of pre-stellar cores based on submil-limeter line and continuum data, which suggest that more than
Send offprint requests to: S.Bisschop
Correspondence to: bisschop@strw.leidenuniv.nl
90% of the CO is removed from the gas (e.g., Caselli et al., 1999; Tafalla et al., 2004; Jørgensen et al., 2005).
The amount of N2present in the gas and solid state is more
uncertain, since N2 cannot be detected directly as it lacks a
permanent dipole moment. The abundance of gas phase N2
is usually inferred from the presence of the daughter species N2H+. Early work by Womack et al. (1992) inferred gas phase
N2abundances of 2–6×10⁻⁶with respect to H2in star-forming
regions, indicating that N2 contains at most 10% of the
nitro-gen abundance. Up to an order of magnitude higher abundances were found van Dishoeck et al. (1992), suggesting that at least in some sources the transformation to molecular form is com-plete. More recent determinations of the N2abundance have
fo-cused on dark cores for which the physical structure is well de-termined from complementary data. For example, Bergin et al. (1995) and Bergin et al. (2002) find typical gas-phase N2
abun-dances of 1−2×10⁻⁵. Indirect indications for N2 freeze-out
onto grains can be obtained from analysis of the millimeter N2H+ data, which suggest a decline in the gas-phase
(Bergin et al., 2002; Belloche & Andr´e, 2004). Constraints on the amount of solid N2that might be present come from
anal-ysis of the solid CO band profile (Elsila et al., 1997). The most stringent limits indicate that the N2:CO ratio must be less than
1:1, derived for sources for which both 12CO and 13CO ices have been detected (Boogert et al., 2002; Pontoppidan et al., 2003). This limit only holds for mixed ices of CO and N2, not
when N2ice has formed a separate layer.
The chemistries of CO, N2 and their daughter products
are intimately linked, even though the two molecules be-long to different elemental families. This is due to the fact that CO is one of the main destroyers of N2H+ in the gas
phase. When CO is frozen out onto the grains, N2H+ is
en-hanced, as confirmed observationally by the anti-correlation
of the abundances of N2H+ with CO and HCO+ in
pre-and protostellar regions (Bergin et al., 2001; Tafalla et al., 2002; Di Francesco et al., 2004; Pagani et al., 2005; Jørgensen, 2004). This anti-correlation is often quantitatively explained by a factor of 0.65 difference in the binding energies for CO and N2, allowing N2to stay in the gas phase while CO is frozen out.
These models do not contain an active grain-surface chemistry, but only include out and desorption. The relative freeze-out behavior of CO and N2 also affects the abundance of H+3
and its level of deuterium fractionation (Roberts et al., 2002). Indeed, observations of H2D+in cold cores and in
protoplane-tary disks often invoke large (relative) depletions of CO and N2
(Ceccarelli & Dominik, 2005).
The above discussion clearly indicates the need for a good understanding of the processes by which CO and N2freeze-out
and desorb from the grains under astrophysically relevant con-ditions. To describe desorption, accurate values for the binding energies and the kinetics of the process are needed. For freeze-out, the sticking probability is the main uncertainty entering the equations. In an earlier paper ( ¨Oberg et al., 2005, hereafter paper I), we presented a limited set of experiments using our new ultra-high vacuum (UHV) set-up to show that the ratio of the binding energiesRBEfor CO and N2in mixed and
lay-ered ices is at least 0.923±0.003 and in many circumstances
close to unity. This result can be understood chemically by the fact that the two molecules are iso-electronic. Indeed, the sub-limation enthalpies calculated from the IUPAC accredited data for pure ices were found to be 756±5 K and 826±5 K for
pure N2and CO ices respectively, giving a ratio of 0.915 (Lide,
2002). This experimental ratio is much larger than the value
RBE =0.65 adopted in chemical models to explain the
obser-vational data (Bergin & Langer, 1997; Ceccarelli & Dominik, 2005). In an alternative approach, Flower et al. (2005) used the results from paper I and instead varied the sticking probabili-ties of CO and N2, which were assumed to be 1 below 15 K in
all previous models. They could only reproduce the observed anti-correlation of N2H+ and HCO+ if the sticking
probabil-ity for N2 was lowered to 0.1 compared with 1 for all other
molecules.
In this paper, we present new experiments on CO–N2ices,
both in pure, layered and mixed ice morphologies with varying ice “thicknesses” and relative abundances. In addition to TPD, RAIRS is used to probe the mixing, segregation and desorption processes in the ices. The aim of these experiments is to
under-0 500 1000 1500 2000 2500 3000 3500 4000 0.0
0.2 0.4 0.6 0.8 1.0
0 5 10 15 20 25 30 35 40
2102 2100 2098 2096 2094 2092 2090 2088 2086 w avenumber / cm
-1 0.05 abs units
CO exposure 1 to 40 L
I
n
t
e
g
r
a
t
e
d
a
r
e
a
u
n
d
e
r
C
O
o
p
e
a
k
[image:2.612.308.534.57.228.2]Deposition time / s Equivalent dose / L
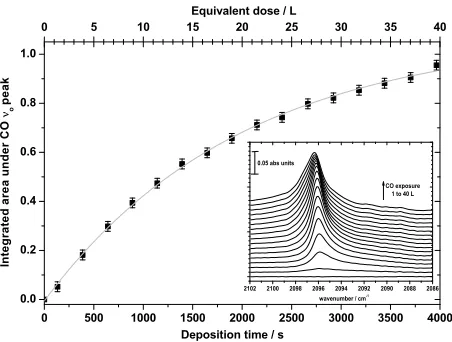
Fig. 1.Integrated intensity of the13CO RAIR spectra with de-position time. Individual RAIR spectra are shown in the inset for ice exposures of 1 to 40 L in steps of 3 L (Langmuir).
stand the CO–N2ice system to an extent that the experimental
desorption kinetics can be modeled and reproduced, and to sub-sequently use these model parameters to predict the behavior of CO and N2under astrophysically relevant conditions. The key
parameters to be derived for the CO–N2ice are: i) the CO-CO,
CO-N2, and N2-N2binding energies, ii) the desorption
kinet-ics (i.e., the desorption rates), iii) the diffusion kinetics (i.e., the mixing and segregation rates), and iv) lower limits to the sticking probabilities.
This paper is organized as follows: Sect. 2 focuses on the experimental procedure and choice of ice layers and mixtures, Sect. 3 presents the experimental results on desorption, Sect. 4 a kinetic model of the experimental data, and Sect. 5 experi-ments on the sticking probabilities. Sect. 6 discusses how the kinetic model can be applied to astrophysically relevant situ-ations and predicts the desorption behavior of CO and N2 for
astrophysically relevant heating rates. In Sect. 7 all important conclusions are summarized.
2. Experimental procedure
The experimental apparatus used for this work, CRYOPAD (Cryogenic Photoproduct Analysis Device) (van Broekhuizen, 2005), is very similar to the SURFRESIDE Leiden sur-face astrochemistry instrument described in detail elsewhere (Fraser & van Dishoeck, 2004). Briefly, all experiments were performed in an ultra-high vacuum (UHV) chamber, capable of reaching base pressures of better than 1 ×10⁻¹⁰ Torr. At
the center of the chamber is a gold-coated copper substrate, mounted in close thermal contact with a closed cycle He cryo-stat, which cools the whole substrate to 14 K. The cryostat and substrate assembly is mounted on a rotation stage which can be rotated through 360 deg. The sample temperature is controlled to better than±0.1 K using the cryostat cold finger, a
Bisschop et al.: Desorption rates and sticking coefficients for CO and N2ices 3
(0.07% Au in Fe versus chromel) thermocouples, one mounted on the substrate face, the second by the heater element. Ices are grownin situonto the substrate, by exposing the cold surface to a steady flow of gas, introduced into the chamber via an all metal flow control valve, with a modified outlet directed at the substrate center, along the surface normal. TPD is induced by heating the substrate (and ice sample) at a steady rate of 0.0017 K s−1, using a linear heating ramp controlled by a positive
feed-back loop from the Lakeshore instrument. The ice film is mon-itored using FT-RAIRS (Fourier Transform RAIRS), which is an analysis technique providing information on the orientation and constituents of the ice film. The RAIR spectra cannot be di-rectly compared to observational data, however, since they dif-fer from transmission spectra. During flow setting, deposition and desorption, gases liberated from the surface are monitored using a quadrupole mass spectrometer (Pfeiffer Prisma).
To enable CO and N2to be discriminated from each other
(and the background signal) with mass spectrometry, isotopes of both molecules were used, i.e.13CO (Icon Isotopes 99.998% m/e=29), and15N2(Cambridge Isotopes Inc. 98% m/e=30).
This isotopic substitution is simply an experimental asset and does not affect the results presented in Sect. 3:12CO and14N
2
will behave identically. In the pure and layered ice morpholo-gies, the gases were used as supplied; to form the mixed ices a 1:1 gas mixture of13CO:15N
2was pre-prepared and mounted
on the UHV chamber gas-dosing system. The dosing rate for ice-film growth was set prior to cooling the sample, by sequen-tially backfilling the chamber with the gas(es) of interest, to a pressure of around 1×10⁻⁸Torr, equivalent to an ion reading
on the mass spectrometer of 7.5×10⁻¹⁰ A for both15N2 and
13
CO. The flow was then stopped, and the background pres-sure within the chamber allowed to recover to≈1×10⁻¹⁰Torr,
before the sample was cooled to 14 K. A background RAIRS spectrum was recorded prior to ice growth. The ice films were then grown by reopening the pre-set flow valve for exposure times equivalent to the gas dose required per sample gas (see Table 1), according to the morphology of the ice to be grown, assuming 1 L (Langmuir) is≈1×10⁻⁶Torr s−1, which roughly
corresponds to∼1 monolayer per unit area (cm2) of material
on the substrate. In the remainder of this paper, the ices are discussed in terms of the gas exposure (in L) to which the sub-strate was subjected during ice-growth; for quick conversion to astronomically relevant surface concentrations, it can be as-sumed that a direct relationship exists between the “exposure” value quoted, and surface coverage or “thickness” of the result-ing ice, which will be approximatelynmonolayers of material, assuming an exposure of n L and a surface concentration of 1015molecules cm−2.
During film growth, the CO-gas uptake on the cold sur-face was monitored directly with RAIRS (see Fig. 1) and in-directly by detecting residual CO and N2 gas with the mass
spectrometer. Since N2has no permanent dipole, it is infrared
inactive and can only be monitored with the mass spectrome-ter. CO ice growth was initially seen to be non-linear (Fig. 1), most probably due to the preferential formation of isolated ’is-lands’ of CO on the substrate (as is for example also seen by Nekrylova et al., 1993) rather than an even, flat “thin-film” of CO-ice, where the substrate surface is fully saturated. Around
40 L, CO ice growth becomes linear, indicating that the struc-ture of the ice that is forming no longer changes during deposi-tion and the ice is present as a “thin-film”. This is a key reason for using an ice thickness of 40 L CO for experiments in which the relative abundance of N2is varied. The ice was then heated
in a TPD experiment (for a detailed discussion of TPD exper-iments see e.g. Menzel (1982)), and 1 cm−1 resolution RAIR
spectra were recorded as the temperature reached≈15, 20, 22,
24, 25, 26, 27, 28, 29, 30, 35 and 40 K.
The ice samples studied are summarized in Table 1. Throughout this paper, the notation X/Y indicates a layered ice morphology with X on top of Y, whereas X:Y denotes a fully mixed ice system. The 1/1 and 1:1 notation denotes identical amounts of both species, whereas the x/40 L notation refers to experiments in which the “thickness” of the overlying N2
layers is varied, but that of the CO layer is kept constant at 40 L. The “thicknesses” have been chosen to be of astrophysi-cal relevance: if all condensible carbon were frozen out as CO it would form an ice layer equivalent to ∼40 monolayers on
an interstellar grain (Pontoppidan et al., 2003). This is a for-tuitous coincidence with the point at which, experimentally, thin-film CO-ice growth dominates in our apparatus. A lay-ered ice morphology is indicated by analysis of the interstel-lar solid CO profiles, which reveal a component of pure CO ice which contains 60–90% of the total solid CO abundance and which is clearly separated from the H2O ice (Tielens et al.,
1991; Chiar et al., 1994; Pontoppidan et al., 2003). Chemical models show that nitrogen is transformed into N2at later times
and at higher extinctions when compared with the conver-sion of carbon from atomic form into CO (d’Hendecourt et al., 1985; Hasegawa et al., 1992). Thus, either CO starts freezing out before N2 is formed so that N2 forms a “pure” overlayer,
or both molecules are present in the gas phase and freeze out together. This makes N2/CO and N2:CO the most
astrophys-ically relevant ice morphologies to study; CO/N2 ices were
however also included in this study, to complete our under-standing of the behavior of the ice systems. In terms of rela-tive abundances, observational evidence (Sect. 1) suggests that the N2 abundance is always less than or equal to that of CO.
Models including gas-grain chemistry predict N2 ice
abun-dances that are typically a factor 5–20 lower than those of CO ice (Hasegawa & Herbst, 1993; Shalabiea & Greenberg, 1994; Bergin et al., 1995; Aikawa et al., 2005). Together, these argu-ments led to the choice of ice morphologies and exposures summarized in Table 1.
3. Experimental results
3.1. Pure CO and N2 ices
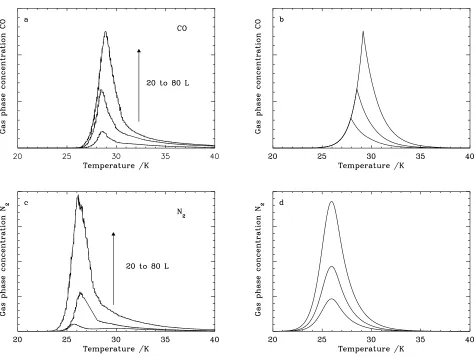
In Fig. 2a and c, the TPD spectra for three different ice expo-sures, i.e. 20, 40, and 80 L, for pure CO and N2ices are shown.
Fig. 2.TPD spectra for pure ices with exposures of 20, 40, 80 L. (a) CO experiments, (b) CO model, (c) N2experiments, and (d)
N2model
peaking at 28 K for an exposure of 40 L. This indicates the presence of multilayer films, since the number of molecules that desorb depends only upon the number of molecules in the surface, which is identical at ice exposures of 40 and 80 L. Thus the desorption rate is constant until there are no molecules left on the surface and desorption stops. This type of kinetics is called zeroth order kinetics. The order of the kinetics is defined as the power of the number of molecules in the surface with which the rate of desorption scales (for details see Sect. 4.1). Since the differences in the CO TPD spectra are smaller for all ice morphologies, this is the only time they are discussed (Fig. 2 a). The TPD signal for the 20 L experiment has a lower in-tensity than expected from scaling the 40 L data. This is due to island growth at low exposures (see Figure 1 and Sect. 2).
The onset of N2desorption shifts from 25 K for 20 and 40
L exposures, to 24 K for 80 L (see Fig. 2c). The peak position of N2remains the same for the 40 and 80 L experiments. This
indicates that in contrast to CO, the desorption rate of N2
in-creases with increasing ice thickness. This kind of kinetics is called first order kinetics. Note that, in general, desorption ki-netics do not have to have an exact integer value. For example Bolina et al. (2005) find that multilayer desorption of CH3OH
on highly oriented pyrolytic graphite (HOPG) has a desorption
order of 0.35. In most cases, however, the desorption kinetics will approach either zeroth, first or even second order.
RAIRS data for pure13CO 20, 40 and 80 L exposures are
shown in the first row of Fig. 3. The peak position is around 2096 cm−1 with a full width half maximum of 2 cm−1. When
the temperature increases above∼20 K, a reduction in intensity
B is sc h o p et al .: D es o rp tio n ra te s an d st ic k in g co e ffi ci en ts fo r C O an d N 2 ic es 5
20 L 40 L 80 L
pure CO
1:1 M ixture 1/1 CO/N 2 1/1 N 2 /CO Deposition 15 K 20 K 22 K 24 K 25 K 26 K 27 K 28 K 29 K 30 K 35 K 40 K Deposition 15 K 20 K 22 K 24 K 25 K 26 K 27 K 28 K 29 K 30 K 35 K Deposition 15 K 20 K 22 K 24 K 25 K 26 K 27 K 28 K 29 K 30 K 35 K 40 K Deposition 15 K 20 K 22 K 24 K 25 K 26 K 27 K 28 K 29 K 30 K 35 K 40 K
2105 2100 2095 2090 2085
T e m p e r a t u r e / K
2100 2095 2090 2085 2100 2095 2090 2085 2100 2095 2090 2085
Exposure
40 K 40 K
W avenumbers / cm -1 0 0.01000 0.02000 0.03000 0.04000 0.05000 0.06000 0.07000 0.08000 0.1000 0.1200 0.1400
2100 2095 2090 2085
X X X X X 120 L pure CO
1:1 M ixture 1/1 CO/N 2 1/1 N 2 /CO Deposition 15 K 20 K 22 K 24 K 25 K 26 K 27 K 28 K 29 K 30 K 35 K 40 K Deposition 15 K 20 K 22 K 24 K 25 K 26 K 27 K 28 K 29 K 30 K 35 K Deposition 15 K 20 K 22 K 24 K 25 K 26 K 27 K 28 K 29 K 30 K 35 K 40 K Deposition 15 K 20 K 22 K 24 K 25 K 26 K 27 K 28 K 29 K 30 K 35 K 40 K 160 L 120 L pure CO
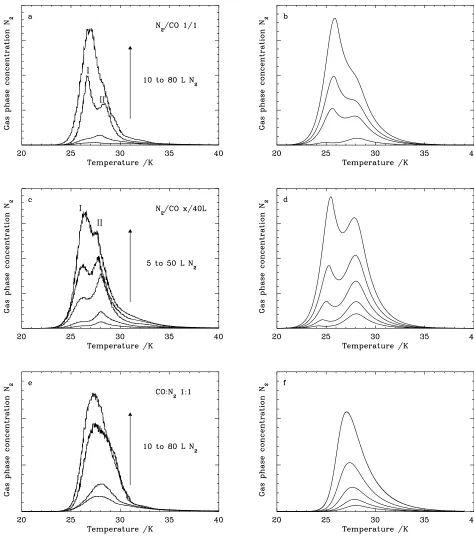
Fig. 4.N2TPD spectra: (a) (10-20-40-80 L)N2/(10-20-40-80 L)CO, 1/1 layer, (c) (5-10-20-30-50 L)N2/(40 L)CO, differential
layer, e) (10-20-40-80 L)N2:(10-20-40-80 L)CO, mixed ice 1:1. The equivalent model spectra are shown in b, d, and f,
respec-tively. The two experimental TPD peaks are labeled I and II, corresponding to desorption of N2from pure and mixed ice phases
respectively.
3.2. Layered ices
The N2TPD spectra for the 1/1 N2/CO experiments and x/40
L N2/CO are shown in Fig. 4a and c respectively. Additionally,
the 1/1 experiments of CO/N2are shown in Fig. 5. In all cases
at least one peak is observed in the TPD spectra, but from the
majority of the data it is evident that the TPD spectra are ac-tually composed from two peaks, one at around 26 K (labeled peak I) and one at around 28 K (labeled peak II). In all the spectra, peak I coincides with the position of the TPD des-orption peak in pure N2, so it is attributed to N2 desorbing
Bisschop et al.: Desorption rates and sticking coefficients for CO and N2ices 7
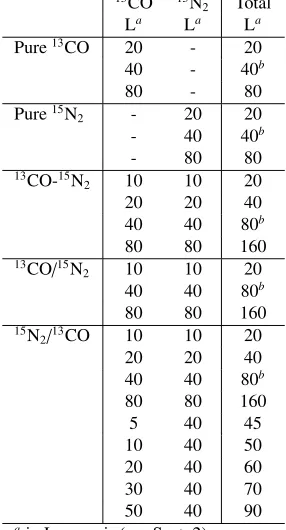
Table 1.Overview of ice morphologies and ice exposure used in the experiments
13CO 15N
2 Total La La La
Pure13CO 20 - 20 40 - 40b
80 - 80
Pure15N
2 - 20 20
- 40 40b
- 80 80
13CO-15N
2 10 10 20
20 20 40
40 40 80b
80 80 160
13CO/15N
2 10 10 20
40 40 80b
80 80 160
15N
2/13CO 10 10 20
20 20 40
40 40 80b
80 80 160
5 40 45
10 40 50
20 40 60
30 40 70
50 40 90
ain Langmuir (see Sect. 2) bdata previously reported in paper I
the pure CO TPD desorption peak and is therefore assigned to co-desorption of N2 with CO, hypothesizing this occurs from
a mixed phase of CO-N2 ice. The formation of this mixture
would require bulk diffusion of N2 and/or CO between the
two separate layers. This mobility is found to commence at significantly higher temperatures than those expected for the hopping process on surfaces (Tielens & Allamandola, 1987). The energy-barrier to hopping is typically assumed to be 0.3×
the binding energy, corresponding to around∼285 K for CO
and N2 and implying that CO and N2 are mobile around 10
K. Our much higher temperature for mobility is probably due to a much larger barrier to bulk diffusion than for surface dif-fusion . For comparison, experiments by Collings et al. (2003) suggest CO molecules become mobile at around 12-15 K on both CO and H2O-ice surfaces, suggesting the barrier to
sur-face diffusion is only slightly higher than the theoretical ap-proximation used in astrochemical models. Furthermore it is clear that the mixing process occurs during ice annealing, and not immediately on deposition, first because there is significant N2 desorption from a pure ice phase and second because the
desorption profiles of the layered and mixed ice systems differ significantly (see Sect. 3.3).
Important information about the CO-N2 ice system can be
derived from the relative intensities of peak I and II. In the 1/1 and x/40 L N2/CO experiments, a turnover is observed between
[image:7.612.94.237.87.352.2]the peak intensities (see Fig. 4a and c), with peak II being more intense than peak I for low “thickness”, and visa versa at high “thickness”. This turn-over occurs between the 40/40 L and 60/60 L exposures for the 1/1 experiments, and between the
Fig. 5.N2TPD spectra of (10-40-80 L)CO/(10-40-80 L)N2, 1/1
layer. The two experimental TPD peaks are labeled I and II, corresponding to desorption of N2 from pure and mixed ice
phases respectively.
30/40 L and 50/40 L in the x/40 L experiments, i.e. both sets of experiments consistently have the turn-over point around 40/40 L.
The CO RAIR spectra of the layered ices (second and third rows of Fig. 3) have a13CO feature that is almost identical to
that for pure13CO, although the red-wing is less pronounced.
As for pure CO, the intensity of the blue-wing decreases around 20 K, where the ice restructures, and a new peak grows around 26 K, where CO starts to desorb. Since the changes in the lay-ered ice spectra at 20 K are commensurate with similar changes in the pure CO ice spectra, this is unlikely to be an indicator of the mixing process. Additionally, a blue wing appears around 24-25 K, concurrently to the onset of N2desorption in the TPD
spectra (see Fig. 4). This feature is probably due to mixing of both molecules, as will be discussed in Sect. 4.3. The appear-ance of a blue wing around 24 K rather than 20 K reaffirms that the mixing process relies on bulk rather than surface diffusion. Finally, the TPD spectra of 1/1 CO/N2 ice layers at
expo-sures of 20, 80 and 160 L are shown in Fig. 5. These experi-ments were used primarily to test whether the ices were indeed grown as separate layers on top of each other. The turn-over point where peak I becomes more intense than peak II occurs at slightly higher exposures compared with N2/CO ice layers,
i.e. between 40/40 L and 80/80 L. It is therefore clear that N2
desorption is retarded by the CO overlayer, desorbing only after it has mixed with, and (a fraction of which has) subsequently segregated from, the CO-ice. As the spectra do not resemble those of the pure N2ice, these experiments provide positive
ev-idence that the layer growth is sequential and coincident on the substrate. However, this ice structure is not thought to be astro-physically relevant, so is not discussed further in this article.
3.3. Mixed ices
The N2TPD spectra for mixed ices (Fig 4e) differ from those of
As the “thickness” of the mixed ice increases, the TPD peak maximum shifts from 28 to 26 K. This behavior indicates that at low exposures, N2desorbs predominantly from a mixed-ice
environment, whereas as the exposure increases, a more sig-nificant fraction of the N2 is able to desorb form a pure N2
layer. Furthermore, the TPD peaks are broadened with respect to those observed for pure and layered ice morphologies (see Sect. 3.1 and 3.2). This broadening is likely to be due to the merging of peaks I and II, and the potential for a wider range of binding environments to exist in the intimately mixed ice mor-phology. Desorption occurring from a pure N2ice environment
suggests that segregation must also occur within mixed CO-N2ice systems, including the mixed phases that are formed in
the layered ice systems. However the fact that some desorption from the mixed phase is always observed indicates that the seg-regation happens at a lower rate than the mixing process, poten-tially because the energy barrier to segregation is greater than that for mixing. This would suggest that over certain temper-ature ranges the mixed ice phase is thermodynamically more stable than the segregated layers.
The RAIR spectra of the mixed ices (final row Fig. 3) differ from those of the pure and layered ices, being broader (4 cm−1)
and shifted to 2094 cm−1, reflecting, as with the TPD data, that
the structure of the mixed ices is unique. Again, the CO band changes shape at around 20 K, possibly due to a similar re-structuring as observed for the pure and layered ices, discussed in Sect. 3.1 and 3.2, but no further changes are observed as the temperature increases until the ice starts desorbing. This im-plies that all or most of the CO remains in a mixed ice phase until it starts to desorb; even if the concentration of this phase changes slightly as the N2segregates and desorbs, it is not
evi-dent in the RAIR spectra.
4. Empirical model of CO-N2desorption
A model was built to gain a clearer qualitative and quantita-tive understanding of the thermal annealing processes includ-ing diffusion, mixing and desorption of the ices. The aims of this model are twofold; to reproduce the experimental data and then apply the same kinetic parameters to astrophysically rele-vant ice morphologies, temperatures and heating rates.
4.1. Constructing the model
The kinetic processes for desorption, mixing and segregation in this system have a reaction barrier (i.e. they are thermodynam-ically limited) and can therefore be described by the following equation:
rdes=
dN
dt =νi[Ns]
ie−E/T
(1)
whererdes is the desorption rate (molecules cm−2 s−1), N is
the number of molecules evaporating from the substrate (as-suming throughout the remainder of these calculations that the substrate has unit surface area (cm2)),tis time in s,ν
ithe
pre-exponential factor (molecules1−icm2(i−1)s−1),iis the reaction
order, [Ns] is the number of molecules partaking in a
partic-ular reaction per unit surface area (molecules cm−2), Eis the
reaction barrier in K, which for the desorption processes can be read as the binding energy, andT is temperature in K. The physical meaning of the pre-exponential factorνidepends upon
the reaction orderi. For a first order reaction it refers to the lat-tice vibrational frequency which is typically in the range 1011 -1013s−1; for zeroth order desorption it consists of the product of
the lattice vibrational frequency with the surface density of or-der 1015cm−2. Depending on the type of reaction, the reaction
orderican vary, taking positive, negative and any non-integer real value. BothEandνidepend in principle upon “thickness”.
However, this dependence is not thought to be large since no major changes are observed between the FTIR spectra at diff er-ent coverages indicating that the intermolecular environmer-ents are very similar.
In order to calculate the temperature-dependent rate mea-sured in the TPD experiments, the following conversion needs to be made:
dN dt =
dN dT
dT
dt (2)
where dN/dT is the temperature-dependent rate (molecules cm−2 K−1), anddT/dtthe TPD heating rate (K s−1). At each
time step, a fraction of the molecules that have evaporated into the gas phase will be removed by the pump; subtracting this rate from the desorption into the gas phase will reproduce the experimental conditions. The pump-rate is given by:
rpump=
dN
dt =−νpumpN(g) (3)
in whichνpumpis the pump constant in s−1andN(g) the
num-ber of molecules entering the gas phase having desorbed from a unit surface area. To ensure the equations balance, N(g) is given in molecules cm−2, implying that the molecules actually
occupy a unit volume. Combining equations (1), (2), and (3), the experimental results can be simulated in a simple way. The reactions are summarized in Table 2.
4.2. Constraining the model
First, the reactionshandigiven in Table 2 plus the pump con-stantsνpumpfor CO and N2were constrained, by fitting a
first-order exponential to the pump-down curves of both CO and N2 at 14 K, accounting for the pumping effects of the
turbo-pump and the cryostat in the experiment. Note that theνpump
values shown in Table 2 are experimentally determined and consequently fixed for further iterations of the kinetic model.
Next, the parameters associated with reactionsaandb, des-orption from pure ice environments, were constrained. Since the binding energies for pure CO ice desorption found by Collings et al. (2003) and paper I are identical within exper-imental error, the CO binding energy was initially set to the same value reported in paper I;νwas fixed at the value reported by Collings et al. (2003). For N2, the desorption kinetics appear
to be first order (see Sect. 3.1) and therefore the pre-exponential factorνwas initially estimated to be somewhere between 1011
-1013 s−1, then varied in order to obtain the best fit to the
Bisschop et al.: Desorption rates and sticking coefficients for CO and N2ices 9
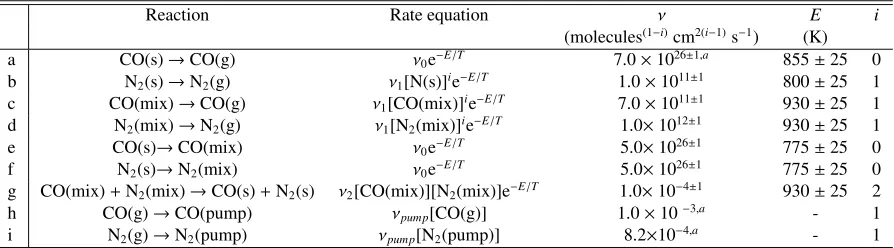
Table 2.Rate equations for desorption, mixing, and segregation of CO and N2in the CO-N2ice systems.
Reaction Rate equation ν E i
(molecules(1−i)cm2(i−1)s−1) (K) a CO(s)→CO(g) ν0e−E/T 7.0×1026±1,a 855±25 0 b N2(s)→N2(g) ν1[N(s)]ie−E/T 1.0×10¹¹±1 800±25 1 c CO(mix)→CO(g) ν1[CO(mix)]ie−E/T 7.0×10¹¹±1 930±25 1 d N2(mix)→N2(g) ν1[N2(mix)]ie−E/T 1.0×10¹²±1 930±25 1 e CO(s)→CO(mix) ν0e−E/T 5.0×1026±1 775±25 0 f N2(s)→N2(mix) ν0e−E/T 5.0×1026±1 775±25 0 g CO(mix)+N2(mix)→CO(s)+N2(s) ν2[CO(mix)][N2(mix)]e−E/T 1.0×10⁻⁴±1 930±25 2
h CO(g)→CO(pump) νpump[CO(g)] 1.0×10⁻³,a - 1
i N2(g)→N2(pump) νpump[N2(pump)] 8.2×10⁻⁴,a - 1
aParameters are fixed according to experimental constraints see Sect. 4.2.
value reported in Paper I, but also allowed to vary in iterations of the model. The final values of these parameters are given in Table 2 and the corresponding TPD models are presented next to the experimental data in Fig. 2b and d.
Desorption from the mixed ice fraction was assumed to be first order. This is thought to be a good assumption since the rate of desorption depends on the number of molecules on the surface and this will change after each molecule desorbs. Initially, the binding energy for desorption from the mixed ice layer was taken to be the same as that of pure CO desorption, because peak II appears to occur at the same temperature as the desorption of pure CO. However, when running the model this value had to be increased to reproduce the experimental effect. From the TPD spectra described in Sect. 3 no direct mea-surement of the mixing rates was possible. Mixing can, how-ever, be inferred from the presence of peak II in the layered ice experiments. Assuming a simple, single step process, reac-tions eand f in Table 2 describe the mixing, assuming both molecules contribute equally to the process. Good physical ar-guments can be made for modeling this process as zeroth, first or second order kinetics, and all three processes were inves-tigated (see Appendix A for a more detailed discussion). The outcome is that experimental data are best reproduced if the mixing process is zeroth order. Since mixing occurs only at the interface between the CO and N2ice layers this description
makes physical sense. A CO or N2 molecule at the interface
has a certain chance of overcoming the “mixing barrier” and diffusing into the opposite layer, but the molecules remaining at the interface will still see the same number of molecules, re-gardless of whether there are 20 or 80 L of ice above or below it.
The final reaction to constrain is the segregation reaction
g. The relative number of molecules desorbing from pure N2
environments in mixed ice morphologies increases with expo-sure, as was discussed in Sect. 3.3. Segregation is modeled as one reaction, in a second order process depending on the initial number of molecules in the mixed ice phase for both species. In reproducing all the mixed ice experiments these values were, of course, equal. In the layered ices, however, it is unlikely that the relative abundances of CO and N2in the mixed ice phases
are equal. Consequently, equationgsuggests that segregation is fastest from a equimolar ice, decreasing as the relative abun-dances of either species deviate from 1:1. Finally, from the TPD
spectra of the layered ices it was clear that the mixing was more efficient than the segregation process, so, as discussed in Sect. 3.2, theEof reactiongwas always assumed to be greater than
Eof reactionseandf.
4.3. Results
In Table 2, all the model equations and best fit parameters “by eye” are given after running a large number of models. The error-bars arise from (i) the range of values over which simulta-neous fits ofνandEgave degenerate solutions to the model, (ii) the uncertainty in the number of molecules present on the sur-face, and (iii) the experimental uncertainties in the temperature. It is important to realize that the degeneracy in the simultane-ous fits ofνandEmeans that the combination of these values is more accurate than the individual values. Thus, in astrochemi-cal models both parameters need to be used in combination to accurately reproduce the behavior of CO and N2.
A comparison between Fig. 2a and c with Fig. 2b and d clearly shows that the model described here very reasonably reproduces the data of the pure CO and N2 ice system. The
leading edges for the CO TPD spectra of the experiment do not quite overlap as perfectly as the model does, probably be-cause CO desorption is close to, but not quite, zeroth order. As was discussed by Collings et al. (2003) the error resulting from this deviation from zeroth order is significantly smaller than all other errors made in astrochemical models. The best-fitted parameters for E are 855 K and 800 K for CO and N2
respectively.
The desorption peaks I and II observed in the TPD spec-tra for the layered ices are also well reproduced by the model. The appearance of peak II depends on equations c and d which describe desorption of CO and N2 from the mixed ice phase.
From Table 2 it is seen thatνandEare within the model error-bars identical in each reaction, confirming that N2and CO
co-desorb from this mixed ice phase. SinceEfrom the mixed ice is greater than E from the pure ice, it seems CO and N2 are
both more strongly bound in the mixed ice. The results give a
RBEof 0.936±0.03 for the pure N2and CO ices and 1.0 for the
mixed ices, within experimental error of paper I. Note that even for layered ices of thicknesses less than 40 L, most N2desorbs
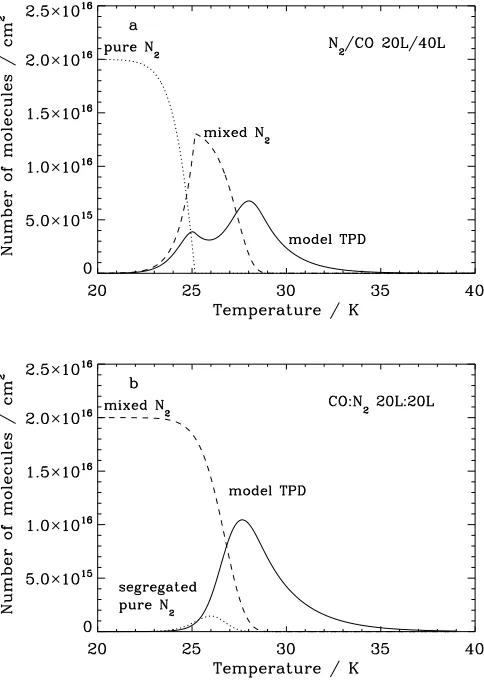
Fig. 6.Model results for the ice and gas phase concentrations as functions of temperature. The number of molecules in pure N2ice (dotted line), in mixed ice (dashed line), and in the gas
phase (solid line) are shown for 20/40 L N2/CO (a) and the
20:20 L CO:N2(b).
Mixing kinetics were confirmed to be zeroth order. The best-fitEvalue equals 775 K, which is rather close toEfound for desorption of pure N2 and indicates that significant
mix-ing only occurs close to desorption of N2, corresponding to the
change in RAIR spectra found around 24 K in Sect. 3.2. This behavior is also illustrated in Fig. 6a for the 20/40 L N2/CO
experiment, where the growth of the mixed ice phase is com-mensurate with the loss of the pure ice phase and the desorp-tion of the pure N2layer. For higher ice thicknesses of N2, the
competition between mixing and desorption is in favor of des-orption from the pure ice layer, leading to the turn-over in peak intensity from peak I and II.
Segregation starts close to the desorption temperature of CO, which is illustrated by Fig. 6b for the 20:20 L CO:N2
ex-periment. This occurs at a higher temperature than the onset of mixing, due to a barrier difference;Eequals 930 K for segrega-tion and 775 K for mixing. This difference makes segregation a relatively unimportant process for layered ices. As for mixed ices, however, the segregation rate increases with ice thick-ness, leading to a larger segregated fraction for higher initial ice thickness, which shifts the TPD peak to lower temperatures.
5. Sticking probability
The data presented so far are key to our understanding of CO and N2desorption rates in interstellar environments. However,
because the binding energies of CO and N2in the solid phase
are essentially so similar, this parameter cannot be the main factor which accounts for the anti-correlation of N2H+with CO
and HCO+in pre-stellar cores. The freeze-out rate, or a diff
er-ence in the sticking probability of each molecule to the grain, may also be relevant.
Without a molecular beam facility, it is very difficult to quantify sticking probabilities directly. Nevertheless, during these experiments, the gas load reaching the mass spectrom-eter was monitored during the flow setting for a time period equivalent to the dosing period (when the substrate was warm) and the entire dosing period (when the substrate was cold). By combining the measurements over a range of deposition times and experiments, it is possible to extract a value for the uptake coefficient. From the uptake coefficient only a lower limit to the sticking probability can be derived since the mass spectrometer signal at low temperatures also includes an unknown fraction of molecules that miss the substrate (for a more detailed explana-tion of the derivaexplana-tion of the uptake coefficient see Fuchs et al., 2006). The uptake coefficient at surface temperatures of 14 K is given by
S(θ)=
R
Nwxdt−
R
Nxcdt
R
Nw
xdt
(4)
whereθis the “thickness” in L, andR Nis the integrated area under the mass spectrometer signal for species xduring the dosing period, warm (w) or cold (c), respectively, which is di-rectly proportional to the fraction of molecules that do not stick, i.e. either they never reach the substrate, scatter from the sur-face without sticking, or are trapped and desorb on a very short timescale (<1 sec).
However, since the sticking probability is dependent of ice “thickness” and ice morphology, the growth of islands or non-linear thin films during deposition, such as is observed in these experiments (see Fig. 1), results in the sticking proba-bility changing as a function of ice “thickness”, tending expo-nentially (in this case) towards a constant (lower value) at flat, multilayer ice thicknesses (Kolanski, 2001). To determine this “constant”S-value for CO sticking to CO, N2 sticking to N2,
and N2sticking to CO, theS-values were plotted as a function
of exposure (in L), and fitted to an exponential decay curve, for every experiment where the final ice morphology was identi-cal. The asymptotic values ofS are given in Table 3. The errors on the uptake coefficients, i.e., the lower limits of the sticking probabilities, arise from a combination of the reproducibility of the experiments plus the error bar on the fitted exponential decay curve.
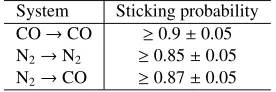
It is clear that at 14 K these values are identical within experimental error, averaging 0.87 ±0.05. The values given
Bisschop et al.: Desorption rates and sticking coefficients for CO and N2ices 11
Table 3.Lower limits to the sticking probabilities at 14 K.
System Sticking probability CO→CO ≥0.9±0.05 N2→N2 ≥0.85±0.05 N2→CO ≥0.87±0.05
sticking probability may arise because the gases are dosed ef-fusively into the chamber at 300 K, even though the substrate itself is at 14 K.
Based on comparison with other systems it is expected that for a single molecule incident upon any of these surfaces, the sticking probability will tend towards 1, particularly as its in-cident energy is reduced from 300 to 100 or even 10 K, and the surface temperature of the ice is reduced to 10 K. The data clearly show that the relative differences between theS-values of CO-CO, N2-N2 and N2-CO are negligible relative to other
uncertainties in astrochemical models, and are certainly not as large as one order of magnitude, as adopted by Flower et al. (2005).
6. Astrophysical implications
The model described in Sect. 4 can be refined to simulate the behavior of CO-N2ices in astrophysical environments, simply
by replacing the heating rate used in the experiment with an appropriate heating rate for the astrophysical conditions and removing the pumping reactions.
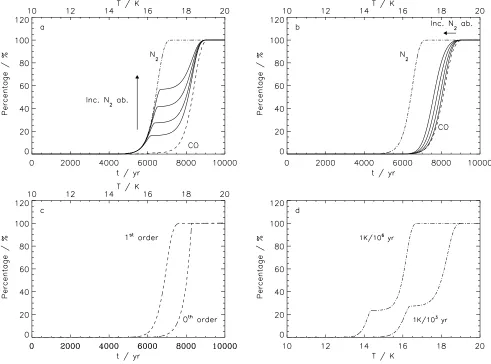
Fig. 7a shows output of the astrophysical model for 1/1 lay-ered N2/CO ices (solid lines), at heating rates of 1 K/1000 yr.
This heating rate was chosen because it matches the timescale over which a newly-formed protostar increases the temperature in its surrounding envelope from <10 K to 20 K (Lee et al., 2004). In addition, the desorption profiles of pure N2and CO
in layered ice are shown on the same plot. Under these condi-tions, pure N2desorbs between 15 and 17 K,∼2 K or 2000 yr
earlier than CO, which desorbs between 17 and 19 K. However, if N2were to freeze-out on top of an existing CO-ice layer, the
desorption of N2 takes place in two steps. Only for
unrealisti-cally thick ices of more than 80–120 monolayers does 50% of N2 desorb as pure N2. For lower ice thicknesses, N2
desorp-tion from the mixed environment dominates, and the majority of the frozen-out N2 desorbs with CO. Fig. 7b shows a very
similar plot, but for 1:1 mixed ices, where the desorption oc-curs in a single step. As the total ice thickness increases, i.e. more CO and N2are equally frozen out, the desorption profile
shifts towards the pure N2 case, but generally the profile
re-sembles that of pure CO much more closely than that of pure N2. It is important to note that the thermodynamics, i.e.RBE
of the CO and N2 ice systems have not been altered in any of
these models; the differences arise entirely from the kinetics of the desorption processes. This illustrates that it is important to know the initial morphology of the ice as well the abundance of N2with respect to CO to make accurate predictions for the
interstellar desorption behavior of N2compared to CO.
Many astrochemical models use first order desorption ki-netics for pure CO instead of zeroth order kiki-netics (e.g.,
Ceccarelli & Dominik, 2005). To get an impression of the mag-nitude of the error made by using incorrect desorption kinetics, a simulation for pure CO desorption from an ice of 40 L was made for both cases using identical binding energies (see Fig. 7c). Clearly, desorption for first order kinetics occurs∼1 K or
1000 yr earlier, corresponding to an error of 12.5% on the des-orption timescale. Although this seems a small overall error, it is 50% of the time difference between desorption of pure N2
and CO, so this incorrect treatment could have a comparatively large effect on the relative desorption behavior of layered ices of N2and CO. It is also important to notice that CO desorption
in pure CO ice is completed∼0.5 K earlier than desorption of
CO from a mixed or layered ice environment. This is due to the lower surface concentration of CO in a mixed ice environment as was found in the experiments.
In Fig. 7d, the difference between heating rates of 1 K/103 yr and 1 K/106 yr is shown for an ice with 20/40 L N2/CO.
The relevance of the faster rate was defined previously; the slower rate would be appropriate for a cold pre-stellar core at near constant temperature. It is clear that the qualitative pic-ture remains the same; N2desorbs in two steps, but desorption
is complete by 16.5 K for 1 K/106 yr versus at 18.5 K for 1
K/1000 yr, a difference of 2 K for a difference in heating rate of 103. One further issue is that at the lower heating rates a
slightly greater fraction of the N2desorbs from a mixed ice
en-vironment, which implies that the mixing rate becomes faster relative to the desorption rate. An infinitely slow heating rate of 1 K/1010yr shows the same trend.
The overall conclusion from our experiments is that there are some subtle differences in the N2and CO desorption
behav-ior, but that they are unlikely to fully explain the observed anti-correlations between N2H+and CO in pre-stellar dense cores.
Also, any difference in sticking probabilities for CO and N2is
very small, so that other scenarios must be explored to explain the observations.
So far, H2O ice has been neglected in our studies. The
CO-H2O system has been extensively studied by Collings et al.
(2003), who found a binding energy of CO to H2O of 1180
K. Kimmel et al. (2001) derive a binding energies of ≥950
K for N2 on H2O. The combination of these two results in a
RBEon H2O of≥0.81. Furthermore, Manca et al. (2004) and
Manca & Martin (2003) report a ratio for the condensation en-thalpies on H2O of 0.83. Concluding,RBEon H2O for CO and
N2 is very close to that found for the binary CO-N2 system.
The desorption behavior will thus also be quite similar for CO and N2in mixed or layered ices with H2O as is observed in the
TPD experiments by Collings et al. (2004), where both species desorb in multiple steps. The addition of H2O to the CO-N2ice
system therefore could not significantly alter the conclusions of this paper. A significant difference in binding energies between CO and N2could only occur if most of the CO were residing
in a H2O-dominated environment with N2 in a pure, separate
layer on top. This would be in contradiction with the observa-tions which show that a large fraction of the CO is in a pure CO ice layer (Pontoppidan et al., 2003).
Fig. 7.Astrophysical simulations for heating rates of 1 K/103yr with ice thicknesses ranging from 10 to 80 L for both species. (a) (10-20-40-80 L)N2/(10-20-40-80 L)CO, 1/1 layer, (b) (10-20-40-80 L)N2:(10-20-40-80 L)CO, 1:1 mixed ice; (c) zeroth and
first-order desorption for 40 L pure CO, and (d) a simulation for N2/CO 20/40 L for heating rates of 1 K/103yr and 1 K/106yr.
N2desorption from the mixed or layered ices is shown in full, pure N2in dash-dot, and CO in dashed lines.
can affect the relative N2H+ and HCO+ abundances in cores
where the chemistry has not yet reached equilibrium. Even in models including freeze-out, there are regimes of densities and temperatures where the N2H+abundance initially rises as
CO and N2 freeze out. Dissociative recombination with
elec-trons then becomes the dominant N2H+destruction mechanism
(Jørgensen et al., 2004), leading mostly to NH rather than N2
(Geppert et al., 2004). Eventually, this results in N2H+
deple-tion at high densities and later times.
7. Concluding remarks
New experimental data have been presented for the desorp-tion and sticking of CO-N2 ice systems. Furthermore a kinetic
model has been constructed that allows for accurate simula-tions of the TPD experiments as well as predicsimula-tions for the be-havior of CO and N2 ices under astrophysical conditions. The
key results are:
– The ratio for the binding energies for N2 and CO in pure
ices is 0.936±0.03. For mixed ices, the ratio for the
bind-ing energies is 1.0 (see Sect. 4.3).
– Desorption of N2from layered ices occurs in two steps, due
to mixing of N2with CO. This indicates that for
astrophys-ically relevant ice abundances, desorption from the mixed layer dominates, with less than 50% of N2able to desorb
prior to CO.
– In mixed ices, segregation causes the peak temperature for N2desorption to shift to lower temperatures for higher ice
thicknesses, even though most of the ice desorbs from a mixed ice environment. Since the onset of segregation is concurrent with desorption, a single broad desorption step is observed for N2. For astrophysically relevant ice
thick-nesses, N2 desorption occurs close to the CO desorption
temperature.
– The desorption kinetics for CO ice are zeroth order instead of the commonly adopted first order process, resulting in an error in the desorption timescale of 12.5%, with a shift to lower temperatures for the first order process. Since this corresponds to 50% of the difference between N2 and CO
Bisschop et al.: Desorption rates and sticking coefficients for CO and N2ices 13
– The lower limits on the sticking probabilities for N2and CO
are found to be the same within experimental error, 0.87±
0.05 at 14 K (see Sect. 5). In reality the sticking probabili-ties will be even closer to 1.0 for lower temperatures.
The main conclusion from this work is that the solid-state processes of CO and N2are very similar under astrophysically
relevant conditions.
Acknowledgements. We are thankful for useful discussions with G. Fuchs, K. Acharyya, and J. Jørgensen. Funding was provided by NOVA, the Netherlands Research School for Astronomy and a NWO Spinoza grant. KO is grateful to the summer undergraduate research fellowship (SURF) program at Caltech for sponsoring her visit to Leiden.
References
Aikawa, Y., Herbst, E., Roberts, H., & Caselli, P. 2005, ApJ, 620, 330
Belloche, A. & Andr´e, P. 2004, A&A, 419, L35
Bergin, E. A., Alves, J., Huard, T., & Lada, C. J. 2002, ApJ, 570, L101
Bergin, E. A., Ciardi, D. R., Lada, C. J., Alves, J., & Lada, E. A. 2001, ApJ, 557, 209
Bergin, E. A. & Langer, W. D. 1997, ApJ, 486, 316
Bergin, E. A., Langer, W. D., & Goldsmith, P. F. 1995, ApJ, 441, 222
Bolina, A. S., Wolff, A. J., & Brown, W. A. 2005,
J. Chem. Phys., 122, 4713
Boogert, A. C. A., Blake, G. A., & Tielens, A. G. G. M. 2002, ApJ, 577, 271
Caselli, P., Walmsley, C. M., Tafalla, M., Dore, L., & Myers, P. C. 1999, ApJ, 523, L165
Ceccarelli, C. & Dominik, C. 2005, A&A, 440, 583
Chiar, J. E., Adamson, A. J., Kerr, T. H., & Whittet, D. C. B. 1994, ApJ, 426, 240
Collings, M. P., Anderson, M. A., Chen, R., et al. 2004, MNRAS, 354, 1133
Collings, M. P., Dever, J. W., Fraser, H. J., & McCoustra, M. R. S. 2003, Ap&SS, 285, 633
d’Hendecourt, L. B., Allamandola, L. J., & Greenberg, J. M. 1985, A&A, 152, 130
Di Francesco, J., Andr´e, P., & Myers, P. C. 2004, ApJ, 617, 425 Elsila, J., Allamandola, L. J., & Sandford, S. A. 1997, ApJ,
479, 818
Flower, D. R., Pineau Des Forˆets, G., & Walmsley, C. M. 2005, A&A, 436, 933
Fraser, H. J. & van Dishoeck, E. F. 2004, Advances in Space Research, 33, 14
Fuchs, G. W., Acharyya, K., Bisschop, S. E., et al. 2006, sub-mitted to Faraday Discussions
Geppert, W. D., Thomas, R., Semaniak, J., et al. 2004, ApJ, 609, 459
Hasegawa, T. I. & Herbst, E. 1993, MNRAS, 263, 589 Hasegawa, T. I., Herbst, E., & Leung, C. M. 1992, ApJS, 82,
167
Jørgensen, J. K. 2004, A&A, 424, 589
Jørgensen, J. K., Hogerheijde, M. R., van Dishoeck, E. F., Blake, G. A., & Sch¨oier, F. L. 2004, A&A, 413, 993 Jørgensen, J. K., Sch¨oier, F. L., & van Dishoeck, E. F. 2005,
A&A, 435, 177
Kimmel, G. A., Stevenson, K. P., Dohn´alek, Z., Smith, R. S., & Kay, B. D. 2001, J. Chem. Phys., 114, 5284
Kolanski, K. W. 2001, Surface Science (Wiley), 163–+
Lacy, J. H., Knacke, R., Geballe, T. R., & Tokunaga, A. T. 1994, ApJ, 428, L69
Lee, J.-E., Bergin, E. A., & Evans, N. J. 2005, ApJ, 617, 360 e-prints
Lide, D. R. 2002, CRC Handbook of chemistry and physics : a ready-reference book of chemical and physical data, 83rd edn. (CRC Press)
Manca, C., Martin, C., & Roubin, P. 2004, Chemical Physics, 300, 53
Manca, C. & Martin, C.and Roubin, P. 2003, J. of Phys.Chem. B, 107, 8929
Menzel, D. 1982, Chemistry and Physics of Solid Surfaces IV, ed. R. Vanselow & R. Howe (Springer-Verlag), 389–406 Nekrylova, J. V., French, C., Artsyukhovick, A. N., Ukraintsev,
V. A., & Harrison, I. 1993, Surface Science Letters, 295, L987
¨
Oberg, K. I., van Broekhuizen, F., Fraser, H. J., et al. 2005, ApJ, 621, L33
Pagani, L., Pardo, J.-R., Apponi, A. J., Bacmann, A., & Cabrit, S. 2005, A&A, 429, 181
Pontoppidan, K. M., Dullemond, C. P., van Dishoeck, E. F., et al. 2005, ApJ, 622, 463
Pontoppidan, K. M., Fraser, H. J., Dartois, E., et al. 2003, A&A, 408, 981
Rawlings, J. M. C., Hartquist, T. W., Williams, D. A., & Falle, S. A. E. G. 2002, A&A, 391, 681
Roberts, H., Fuller, G. A., Millar, T. J., Hatchell, J., & Buckle, J. V. 2002, A&A, 381, 1026
Shalabiea, O. M. & Greenberg, J. M. 1994, A&A, 290, 266 Tafalla, M., Myers, P. C., Caselli, P., & Walmsley, C. M. 2004,
A&A, 416, 191
Tafalla, M., Myers, P. C., Caselli, P., Walmsley, C. M., & Comito, C. 2002, ApJ, 569, 815
Tielens, A. G. G. M. & Allamandola, L. J. 1987, in ASSL Vol. 134: Interstellar Processes, ed. D. J. Hollenbach & J. Thronson, 397–469
Tielens, A. G. G. M., Tokunaga, A. T., Geballe, T. R., & Baas, F. 1991, ApJ, 381, 181
van Broekhuizen, F. 2005, PhD thesis, Leiden University van Dishoeck, E. F., Phillips, T. G., Keene, J., & Blake, G. A.
1992, A&A, 261, L13
Womack, M., Ziurys, L. M., & Wyckoff, S. 1992, ApJ, 393, 188
Appendix A: Comparison between zeroth, first and second order mixing
order mixing kinetics with the TPD data. All three mechanisms are physically relevant. Zeroth order can be viewed as a process in which a molecule at the interface between CO and N2has a
certain chance of moving into the overlying layer; the chance for this to occur is completely independent of whether there are 20 or 80 L on top of this molecule and thus the mixing process is “thickness” independent. First order mixing would be possi-ble in case mixing of one species with another is independent of the total number of molecules of the other species, i.e. there is no saturation possible. Second-order reactions are possible if the rate of mixing would depend upon both the total number of CO and N2molecules, since the presence of both molecules
is required for mixing. Models for all scenarios were tested in order to determine which most accurately describes the exper-iments.
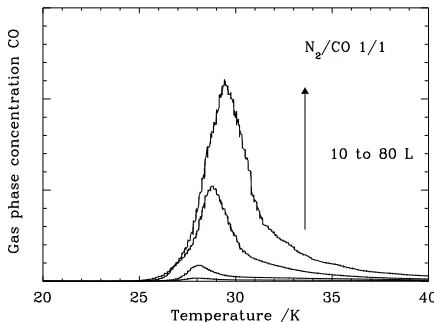
The three different scenarios are shown for 1/1 N2/CO
ex-periments in Fig. A.1 with the best fitting parameters in Table A.1. Zeroth order mixing gives rise to a turn-over in the spec-trum for the peak intensities with peak II initially being more intense than peak I. This behavior is also observed for the ex-perimental data (see Fig. 4a). The turn-over is due to most N2 molecules mixing unhindered. When the pure ice layer is
depleted due to desorption and mixing, mixing stops and the remainder of the molecules desorb from the mixed ice envi-ronment. Thus mixing occurs up to higher temperatures with increasing initial ice “thickness”. Desorption and mixing are therefore competing processes. This behavior is not correctly reproduced by the models for first and second-order mixing (see Fig. A.1c and e). As the initial number of molecules in the layers increases, the number of molecules in the mixed fraction of the ice also increases for first order mixing kinetics (see re-action B in Table A.1). However, this increase is proportional to the number of molecules in the pure layer, resulting in a con-stant ratio between peak I and II. Second order mixing behaves differently from both zeroth and first-order mixing in that the turn-over is now reversed. This is due to the rate of mixing be-ing proportional to the number of molecules for both species. Thus at low ice “thicknesses” the rate is low and both molecules remain mostly pure, whereas for high ice “thicknesses” the rate of mixing is very high and all molecules end up in a mixed en-vironment. A comparison between Fig. A.1a, b, and c with Fig. 4 shows clearly that the scenario for zeroth order mixing repro-duces the experimental data best.
The zeroth order mixing mechanism is exemplified by com-parison between the CO TPD data output from the model with the experimental data for N2/CO 1/1 (Fig. A.2). Second
[image:14.612.325.542.56.217.2]or-der mixing (Fig. A.1f) produces a CO desorption spectrum that looks zeroth order. For first order mixing, a two-peak structure is observed for lower “thickness” ices and desorption is domi-nated by first order kinetics for higher ice “thicknesses”, which is not observed in the experimental data. Zeroth order mixing kinetics are, however, able to predict the increasing overlap for the leading edges plus the slight broadening of the TPD profile with respect to the pure CO TPD spectra in Fig. 2a with in-creasing ice thickness observed in the experimental data fairly well.
Fig. A.2.CO TPD spectra for 1/1 (10-20-40-80 L)N2/
Bisschop et al.: Desorption rates and sticking coefficients for CO and N2ices 15
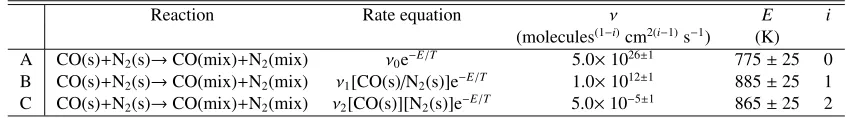
Table A.1.Rate equations for the zeroth, first and second order mixing processes.
Reaction Rate equation ν E i
Fig. A.1.Comparison between model output for the 1/1 ices using alternative rates for mixing where (a)+(b) have zeroth order mixing kinetics, (c)+(d) first order, and (e)+(f) second order. N2 TPD simulations are shown in (a), (c), and (e); CO TPD
simulations are shown in (b), (d), and (f). The N2model results should be compared with experimental data in Fig. 4a, the CO