Soden, Rebecca and Seagraves, Liz (2006) GOALS survey: P6 pupils and further and higher education. [Report]
http://strathprints.strath.ac.uk/26624/
Strathprints is designed to allow users to access the research output of the University of Strathclyde. Copyright © and Moral Rights for the papers on this site are retained by the individual authors and/or other copyright owners. You may not engage in further
distribution of the material for any profitmaking activities or any commercial gain. You may freely distribute both the url (http://strathprints.strath.ac.uk) and the content of this paper for research or study, educational, or not-for-profit purposes without prior
permission or charge. You may freely distribute the url (http://strathprints.strath.ac.uk) of the Strathprints website.
The Quality in Education Centre
GOALS survey:
P6 pupils and further and higher education
Survey Report
August 2006
Dr Rebecca Soden
Liz Seagraves
The Quality in Education Centre University of Strathclyde
Faculty of Education Jordanhill Campus 76 Southbrae Drive Glasgow G13 1PP
Contents
Page no.
Acknowledgements
i
Summary
ii
1. Introduction
1
2. Methodology
1
2.1 Pupil
survey
1
2.2 Parent
survey
4
2.3 Parent
interviews
4
3. Pupil survey
6
3.1
Main P6 pupil survey
6
3.2
Sub-sample based on parental survey
16
3.3 Summary
18
4.
Evidence from interviews relating to parents’
educational aspirations for their children
20
4.1 Introduction
20
4.2 Broad
themes
extracted
from
interviews
20
4.3 Summary
30
5. Summary of findings and conclusions
31
Appendices
1.
Instruments
34
Pupil Questionnaire
Parent Questionnaire
Parent interview schedule
Acknowledgements
This research was commissioned by the GOALS Management Group, who gratefully acknowledge the following funders:
- West of Scotland Wider Access Forum on behalf of the Scottish Funding Council for Further and Higher Education
- The eleven local authorities who participate in GOALS - The Sutton Trust
- The Ernest Cook Trust.
The research team would like to thank the members of the GOALS Project team for providing the information required to carry out this study.
Our particular thanks are due to the schools and teachers who agreed to take part and who facilitated the completion of the questionnaires with both pupils and parents; to the pupils themselves; and to the parents who completed a questionnaire and who gave up valuable time to be interviewed.
Summary
Introduction
The Quality in Education Centre (QIE) at the University of Strathclyde was commissioned by the GOALS Project team to provide baseline data from pupils who had not, as yet,
participated in the GOALS programme for the purpose of contributing to a larger evaluation of the impact of the GOALS Project, and to make recommendations on the future development of the project. This report summarises and discusses data from surveys of a sample of P6 pupils and interview data from a smaller sample of their parents.
Aims of the GOALS Project
The GOALS Project aims to increase the number of pupils going on to higher education courses from selected schools in the West of Scotland, that traditionally have had low levels of participation rates in higher education. This long-term project is a major aspect of the work of the West of Scotland Wider Access Forum.
Methods used in the study
The study used a quantitative approach for the pupil and parent sample and, in addition, a qualitative approach for part of the parent sample. Thus:
• A representative sample of P6 pupils was identified from schools that had not yet participated in a GOALS element. These were located in 9 of the 11 GOALS authorities (two had no non-participating schools); 30 schools were invited to participate. Primary schools associated with secondaries that had lower higher education progression rates were targeted.
• A questionnaire was developed to survey the P6 pupil sample; questions sought to establish young people’s awareness of higher and further education provision, aspirations on leaving school, attitudes to university study and the effect of various influences on their participation in university education. Two questions were included which sought to measure pupils’ self-concepts in relation to school, success in school and self-esteem (Self-Description Questionnaire-I [SDQ-I]: see p1 for more
information on these questions).
• Some pupils completed this questionnaire on-line and some completed a paper based version of the same questionnaire. Responses were received from 399 pupils,
representing 26 schools from the 9 authorities.
• The parents of the P6 pupils were asked to complete a short questionnaire to find out about their own participation in post-school education, their employment status and whether their children were entitled to free school meals (as a measure of socio-economic status). These data were gathered with a view to investigating connections between these factors and pupils’ views. It was possible to match responses from 147 parents to pupil questionnaires.
• Parents were invited to take part in a short interview and 85 agreed; the researchers identified a representative sample of 40 parents from the volunteers.
• A semi-structured interview schedule was designed for parent interviews and the 40 parents were interviewed individually by telephone.
• The data from questionnaires and parent focus groups were analysed. • The findings from pupil surveys and parent interviews were compared.
(measured by free school meals entitlement) and geographical location. Since over 90% of the interview consent forms had been completed by a female parent or carer, there are only four male interviewees in the sample.
Sixty-seven per cent of the parents in the sample of 147 parents from which the 40
interviewees were drawn had taken part in training or study since leaving school, and 55% of these parents had gained their qualification in further or higher education. Given the parents’ qualifications, and their willingness to invest time in being interviewed, it is possible that the sample is unavoidably biased towards parents who are particularly aware of the need to attend to their children’s post-sixteen education and training.
Findings from the pupil survey
Knowledge and awareness of further and higher education
The responses indicate that pupils were more aware of university provision than the opportunities offered by further education. In response to 5 questions on each, 49%
answered 4 or 5 questions correctly in relation to universities, while only 25% answered 4 or 5 questions correctly in relation to further education colleges. A higher proportion of the pupils selected ‘not sure’ when answering the questions about further education.
Responses also indicated that more than half were unclear about the kind of job preparation that occurs in both further and higher education.
Aspirations
Overall, 43% indicated that they would like to go to university, 22% indicated that they wanted to get a job on leaving school (at 16, 17 or 18), 13% opted for further education, 13% made other suggestions and 7% did not know. The lower mention of further education aligns with the apparent lower levels of awareness of opportunities provided by further education. Fifty percent of the girls, compared with 37% of the boys, said they wanted to go to university.
Attitudes to participation in university study
The majority of pupils were in agreement with perceived benefits, both long and short term, of a university education. The percentages agreeing were:
• gaining an interesting job 82% • gaining a well-paid job 80% • making new friends and enjoying 85%
themselves
• studying subjects they liked 79% • being successful 74%.
While the majority disagreed with the barriers, a substantial minority did agree that some aspects presented potential barriers. The percentagesagreeing with the barriers were:
• university costs too much 33% • the work is too difficult 25% • they want to earn money sooner 23% • they don’t want to spend years studying 23% • they think they won’t fit in 14%.
for not participating. With respect to not wanting to spend many years studying, 77% of the girls disagreed with this, while only 55% of the boys disagreed.
Influence on participation
The pupils responded to a set of statements about family influences, other potential influences such as TV and internet, and other perceptions they have.
• Eighty-nine percent of the pupils were confident that their parents would like them to go to university, although only 11% said they had a brother or sister who already went to university.
• Forty-seven percent said they had seen good things about being at university on the TV and 39% said they had seen things about being a student on the internet.
• Seventy percent thought that if they got good exam results at secondary school, they could go to university, which aligns with the 74% who thought they would be
successful.
• Only 14% thought students were short of money, although 44% indicated that they did not know.
• 70% said they would like to visit a university to see what it is like and 37% said they knew how to find out about going to university.
Influences of attitude to school and self-esteem as measured by SDQ-1
Generally, the pupils rated themselves highly on the attitude to school and self-esteem scales which shows a positive attitude to school and to how successful they are, and a positive attitude to self. The questionnaire responses were analysed to see if there were differences between pupils whose scores put them in the different quartiles of the sample.
• Those in the bottom quartiles were less likely to answer correctly the questions about higher education.
• Around half of those in the top quartiles aspired to university; however, a third of those in the bottom quartile also indicated that they would like to go to university.
• Those who rated themselves more negatively on the self-concept scales were also more negative about getting a well paid job as a result of a university education, getting to study subjects they liked, making new friends and being successful if they went to university.
• More pupils in the top than in the lower quartiles agreed that if they got good exam results they could go to university.
Sub-sample of pupils whose parents provided information about themselves
Parents were asked to complete a short questionnaire which identified if they had participated in study or training since leaving school, their employment status and if their child was entitled to free school meals. It was possible to match 147 parent and pupils questionnaires. Too few were classed as unemployed or had children entitled to free school meals to undertake any analysis based on this information. However, 99 (67%) had taken part in training or study since leaving school and the responses of pupils whose parents had participated in study were compared with those who had not.
The comparison did not lead to any statistically significant differences. These points were noted:
• pupils whose parents have experience of study may have slightly more knowledge of further and higher education and more may aspire to go to university
• those whose parents have not participated in further or higher education may be more likely to see the delay in starting to earn money as a barrier.
Findings from the parent interviews
The following themes emerged from the interviews with parents: Theme Sub-theme Sample parent talk
High hopes - support for Further and Higher Education but uncertain about future attainment and interests
Going with the grain
Children will ‘fit in’ at University or college
I don’t know how well N will do at High School – he will have changed in 4 or 5 years.
The hardest part is for D to get a place at university. If she passes Standard Grades she’ll do Highers and then straight on to university, but if it’s too hard for her in 4th year she’ll go elsewhere.
She has not set her heart on anything – I would prefer university but my influence on her will diminish.
We have high hopes but we’ll not push her into anything. They’ve wee minds of their own.
… as long as she gets an education in something she wants to do.
She’s not shy.
He’s a good mixer – no problems there. He’s a bit of a homebird, but he should be OK. (Almost all) parents
strongly oppose entry to work at age sixteen
Parents’ regret that
they did not have Further and Higher Education – strongly want entry for their children
Coatbridge college will be better than just leaving school – there’s nothing here for him and I don’t want him to go the way of other kids here; the job schemes for kids are not very good.
I was definitely held back because of not getting an education. I wouldn’t like her to struggle like I did because of not getting a chance of college.
Children will go to Further Education colleges if they want training for a specific job
He’s really interested in car engines, and he should get more experience at college.
Courses are more geared to needs of employers. It’s not practical enough at uni.
Higher income, wider choice of work, pleasant social environment are the main benefits of Further and Higher Education qualifications
Companies are looking for HNCs – you can’t get an interview without qualifications.
It gives her more choices.
The better qualified you are, the better the chance of a job you like.
Financing Further and Higher education, especially away from home, involves serious sacrifices - but this will not prevent child’s participation
There’s short term pain but long term gains.
College will be cheaper, it’s just 15 minutes away, he can go back and forward; uni is a bit harder financially.
I’ll try to save up to help K to go to university but it’s hard. We’ll try to help, even if it’s a struggle – loans could be a weight round their neck.
Advantages/ disadvantages of accessing university through Further Education are about
equally balanced Further
education as an alternative
The courses are available locally.
She would get used to a different teaching situation, having to be like an adult.
It takes longer to end up with a degree.
… if she went to FE and then uni, it would be a bridging, show her the expectations of advanced study …
Whether or not parents have participated in further or higher education themselves, they are keen for their children to do so; they have a clear picture of the benefits of participation and an accurate notion of the quite severe disadvantages of failing to achieve qualifications. Further education colleges are quite strongly perceived as providers of specific ‘trades’ education and as being particularly suitable for young people who have decided what they want to be. They are also perceived by some parents to provide a safety net for young people who do not achieve university entrance qualifications. According to parents, such young people would use further education colleges to gain an initial qualification for work in a chosen occupational area or as a stepping stone to university.
Conclusion
There was quite a high level of convergence between parent and pupil views, though there were aspects of which the pupils were less aware:
• 89% of the pupils believed their parents would like them to go to university and almost all the parents interviewed believed their children wanted to participate in further and higher education and indicated they would support those aspirations
• Although pupils were more aware of university than further education provision, the majority of parents were aware of both sectors
• 70% of the pupils connected good exam results at secondary school with entry to university and parents were aware of the importance of this; some were unsure if their children were ‘clever enough’
• Parents’ and pupils’ views of the benefits of a university education converged strongly: a university education brought an interesting and well-paid job and would lead to success
• Pupils were less clear about the financial implications of university study, with only 14% thinking students were short of money, but some 44% indicated they didn’t know. Parents were aware of the sacrifices that supporting a child at university required – ones that they appeared willing to make.
Given the educational aspirations expressed in this sample and the modest percentage of young people who actually achieve higher education entrance qualifications, strong measures for supporting young people’s academic study might well be a main plank in widening access. The following forms of support might be helpful in opening access to both further and higher education:
• support from P6 onwards in remaining focused on academic work and being encouraged to believe they are capable of higher education
• the minority of pupils whose self-concept was in the lowest quartile might require special measures to boost their academic achievements, since failure to achieve might be depressing self-concept
• clear explanations that vocational ambitions can be achieved through either further or higher education.
Other forms of support indicated by the data from parents and pupils include:
• experiences such as those provided by the GOALS Project that provide information forboth parents and children about what is involved in being a student
1. Introduction
The Quality in Education Centre (QIE) at the University of Strathclyde was commissioned by the GOALS Project team to provide baseline data from pupils who had not, as yet,
participated in the GOALS programme for the purpose of contributing to a larger evaluation of the impact of the GOALS Project, and to make recommendations on the future development of the project. This report summarises and discusses data from surveys of a sample of P6 pupils and interview data from a smaller sample of their parents.
Aims of the
GOALS ProjectThe GOALS Project aims to increase the number of pupils going on to higher education courses from selected schools in the West of Scotland, that traditionally have had low levels of participation rates in higher education. This long-term project is a major aspect of the work of the West of Scotland Wider Access Forum.
2. Methodology
The study used a quantitative approach for the pupil and parent samples and, in addition, a qualitative approach for part of the parent sample.
2.1 Pupil
survey
Pupil questionnaire
Questions were designed to investigate young people’s awareness of higher and further education provision, aspirations on leaving school, attitudes to university study and the effect of various influences.
To investigate the pupils’ attitudes to school and their self-esteem, two scales were used from the Self-Description Questionnaire (SDQ). The SDQ is an instrument developed to measure self-concept in a number of academic and non-academic areas. The instrument has been shown to be well-validated and reliable through the work of Marsh and others (Marsh 1990)1 and is used in studies investigating pupils’ self-esteem, attitudes towards school and school work and self-concept in relation to maths and reading. The SDQ has been developed at two levels – SDQ-I, designed for use with younger children, and SDQ-II, suitable for young
adolescents and older respondents. For the GOALS study, questions from the SDQ-1 were used.
The different scales of the SDQ represent the multi-dimensional nature of self-concept and Marsh (p105) indicates that studies have shown that the dimensions most likely to be influenced in any given intervention are those specifically relevant to the goals of the programme. Factor analysis has supported the stability of the scales and shown that they can be safely used as separate scales.
The two scales used were the ‘general school’ and ‘general self’ scales. The purpose of using these scales was to see if those pupils with different levels of self-concept revealed different awareness, aspirations and attitudes.
1
A copy of the questionnaire is given in Appendix 1.
Schools were invited to allow the children to complete the questionnaire online. Where this was not convenient, either due to technological or organisational issues, a paper-based version of the questionnaire was completed.
Sample selection
The GOALS team provided databases including all the potential GOALS primary schools and their associated secondary schools, with figures for the P6 roll in 2004-05. A list of schools that did not take part in P6 activities during 2005-2006 was also provided. The majority of the schools that had not taken part had not, as yet, been targeted to participate in GOALS. The GOALS’ criterion for P6 participation during 2005-2006 was that the associated secondary school had less than 25% of leavers continuing to higher education, either at university or in further education. A small number of schools that had been invited to participate did not do so because of a number of factors; for example, they said too much else was happening or they were in the process of school mergers.
The sample for the survey was drawn from the non-participating group of schools, including the small number that had been targeted for GOALS but had not participated. Primary schools associated with secondary schools with lower participation rates were targeted. Of the 19 secondary schools, only 4 had more than 25% progression rates to further and higher education on average over the previous two years.
There were 225 GOALS primary schools in total in 11 authorities, with 6588 P6 pupils in 2004-05. During 2005-06 100 schools in 9 authorities did not participate in the P6
programme. The 2004-05 pupil numbers were used as a guide to estimate pupil numbers for 2005-06. This gave a figure of around 2900 non-participating pupils.
There was variation in the number of GOALS schools in different authorities and therefore also in the number of non-participating schools and pupils. For example, Glasgow had 43% of all GOALS primary schools and 45% of the pupil GOALS population, while Argyll and Bute had 2.2% of primary schools and 0.7% of the pupil population. In relation to the 100 non-participating schools in 2005-06, Glasgow had 20% of the schools and an estimated 32% of the pupils, while Argyll and Bute had only 5% of the schools and an estimated 2% of the pupils.
The survey sample was selected to include a proportion of schools and pupils from each authority which represented approximately the same proportions as existed in the non-participating schools.
The target was an achieved sample of 350 pupils which, based on a population of around 2900, would give 95% confidence intervals for the analysis of the data (ie if sample
responses indicated that 60% agreed with something, it is likely that in the wider sample this would vary from 57.5% to 62.5%). The aim was to include 25 schools and all 9 authorities. To achieve this, 30 schools and a total of 550 pupils were invited to participate. This was to allow for schools not being able to take part, parental consent not being given and pupils being absent on the day of the survey.
Achieved sample
completed paper versions of the survey. This return is therefore more than enough to be able to generalise from the sample to the wider group of non-participating pupils.
However, representation across the authorities varied slightly from the targets, with Glasgow being over-represented and some of the others being under-represented.
[image:12.595.152.449.193.347.2]The responses received, compared with the original targets, are given in Table 1. Table 1: Target and actual responses from authorities
Authority Participation invited
Returns received
Argyll and Bute 10 (2%) 5 (1%)
Dumfries and Galloway 45 (8%) 11 (3%)
East Ayrshire 35 (6%) 26 (6%)
East Dunbartonshire 30 (5%) 27 (7%)
Glasgow 200 (36%) 182 (46%)
Inverclyde 30 (5%) 24 (6%)
North Lanarkshire 55 (10%) 37 (9%)
South Lanarkshire 65 (12%) 33 (8%)
West Dunbartonshire 80 (15%) 54 (14%)
Total 550 (99%) 399 (100%)
For some of the analysis the authorities have been grouped as follows: • Rural: Argyll and Bute; Dumfries and Galloway; East Ayrshire • Urban: Inverclyde; East Dunbartonshire; West Dunbartonshire • Lanarkshire: North and South Lanarkshire
• Glasgow.
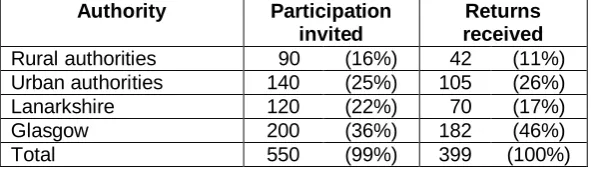
The numbers targeted and received on this basis are given in Table 2.
Table 2: Target and actual responses from grouped authorities Authority Participation
invited
Returns received
Rural authorities 90 (16%) 42 (11%)
Urban authorities 140 (25%) 105 (26%)
Lanarkshire 120 (22%) 70 (17%)
Glasgow 200 (36%) 182 (46%)
Total 550 (99%) 399 (100%)
The data were investigated to ensure that the over-representation of Glasgow responses did not skew the results. This was done by applying the chi-square test as appropriate to the data.2 On the majority of items no statistically significant differences emerged, either on the basis of individual authorities or grouped authorities. Where there were differences, these have been reported in the text, with details given in Appendix 2. There is no constant pattern of difference in the responses from the children in different contexts and therefore the findings can be taken to represent the wider P6 pupil population which is the focus of the study. Responses were received from 188 boys (47%) and 211 girls (53%). Responses were analysed by gender and where differences were noted these are reported.
2
[image:12.595.153.449.487.572.2]2.2 Parent
survey
Letters were sent to parents asking their consent for their children to take part in the pupil survey. At the same time a short questionnaire was sent to parents asking questions which provided information on 3 main issues: parents’ participation in post-school education; parents’ employment status; and pupils’ receipt of free school meals as a measure of socio-economic status. This information was used to interrogate pupil data to see if any of these factors influenced pupil responses. The questionnaires were returned to the school in a sealed envelope marked ‘private and confidential’ for onward transmission to QIE. The questionnaire is shown in Appendix 1.
Parent sample
One-hundred and eighty questionnaires were returned by parents. However, it was possible to match only 147 of these to pupil questionnaires. In one case a batch of 8 parent
questionnaires was received from a school but no pupils completed questionnaires; 2 others did not give their child’s name and so the matching was not possible. It is unclear why the remainder could not be matched to pupils other than that the pupils were not present when the questionnaires were completed. Parent responses came from 11 of the 26 schools in 8 of the 9 authorities.
2.3 Parent
interviews
Purpose
The overall purpose of the open-ended questions in the interview schedule was to explore parents’ beliefs about the value of further and higher education for their children and how it might be accessed.
The content of the semi-structured interview schedule (Appendix 1)
The purpose of the interview was to understand parents’ aspirations for their children. Thus, the questions were designed to find out if parents had discussed their children’s educational aspirations with them, whether and why they shared these aspirations, and any perceived difficulties in realising them. The interview data also allow something to be said about the convergence or otherwise of parents’ and children’s aspirations.
Interview sample
Eighty-five parents agreed to be interviewed and 40 of these parents were selected. This 40-parent sample was representative of those who agreed to be interviewed in terms of the gender of the pupils, socio-economic status of the parents (measured by free school meals entitlement) and geographical location. Since over 90% of the interview consent forms had been completed by a female parent or carer, there are only 4 male interviewees in the sample.
Parents opted into these one-to-one telephone interviews by completing and returning a form, and informed consent was checked again when phone contact was made. They were asked to specify their preferred time for the phone call.
Sixty-seven per cent of the parents in the sample of 147 parents from which the 40
cent of these parents had gained their qualification in further or higher education. Given the parents’ qualifications, and their willingness to invest time in being interviewed, it is possible that the sample is unavoidably biased towards parents who are particularly aware of the need to attend to their children’s post-sixteen education and training.
Conduct of the interviews
Permission was sought before the interview began for the interviewer to make notes during the interview and to tape-record information that could not be captured in notes. Parents’ reasons for their responses to the main questions were explored. Some parents were willing to engage in longer exploration than others, and the interviewer tried to listen for and respect disinclination towards more lengthy exploration. For instance, when a parent responded to a request for a reason for a preference with‘it’s self-evident’ or similar signals, the interviewer moved on.
Analysis of the interview data
Themes and sub-themes were extracted from an initial analysis of the recordings and notes of the interviews. Initial themes identified were refined through an iterative process during several subsequent readings, broadly following a method that Maykut and Morehouse (1994 p127)3 describe as ‘constant comparison’ which provides “a clear path for engaging in analysis of substantial amounts of data”. On second and subsequent readings data were compared to the existing themes, which were then refined or, indeed, supplemented by new ones.
3
3.
GOALS
pupil
survey
3.1
Main P6 pupil survey
Introduction
This section of the report presents the findings from the pupil survey, which asked a range of questions to investigate the young people’s knowledge/awareness of further and higher education, their aspirations, their attitudes to university study and the effect of potential influences on their choices. It also presents an analysis of the responses given by the pupils to these questions based on their responses to the Self-Description Questionnaire which provides a measure of attitude to school and self-esteem (see section 2.1, p1).
The selection of the sample and the achieved sample are described in section 2.1, pp2-3.
Knowledge/awareness of higher and further education
The pupils were asked some general questions about further and higher education to
[image:15.595.92.507.381.526.2]investigate levels of awareness of the purpose of universities and FE colleges. In each set of statements there was an incorrect statement inserted as a way of checking their knowledge. The responses are given in Tables 3 and 4.
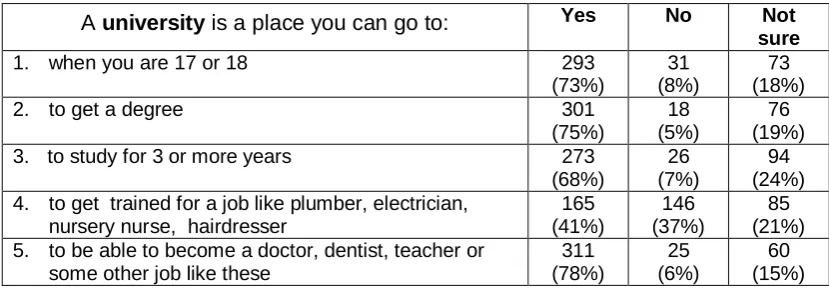
Table 3: Pupils’ awareness of university provision4
Auniversityis a place you can go to: Yes No Not
sure
1. when you are 17 or 18 293
(73%)
31 (8%)
73 (18%)
2. to get a degree 301
(75%)
18 (5%)
76 (19%)
3. to study for 3 or more years 273
(68%)
26 (7%)
94 (24%) 4. to get trained for a job like plumber, electrician,
nursery nurse, hairdresser
165 (41%)
146 (37%)
85 (21%) 5. to be able to become a doctor, dentist, teacher or
some other job like these
311 (78%)
25 (6%)
60 (15%)
The majority of pupils were aware that you can go to university at 17 or 18 to get a degree and to prepare for a professional job. However, between a fifth and a quarter of the pupils either answered these statements incorrectly or indicated that they didn’t know. While the majority chose the ‘correct’ answer in relation to the length of time normally studied at university almost a quarter indicated that they were not sure. Just over a third correctly indicated that university was not a place where training took place for vocational jobs.
4
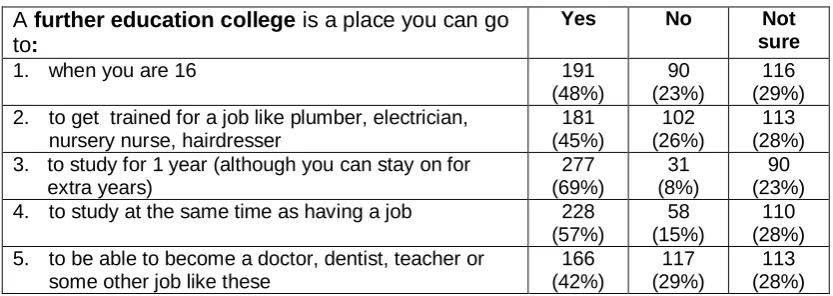
Table 4: Pupils’ awareness of FE provision Afurther education collegeis a place you can go
to:
Yes No Not sure
1. when you are 16 191
(48%)
90 (23%)
116 (29%) 2. to get trained for a job like plumber, electrician,
nursery nurse, hairdresser
181 (45%) 102 (26%) 113 (28%) 3. to study for 1 year (although you can stay on for
extra years) 277 (69%) 31 (8%) 90 (23%) 4. to study at the same time as having a job 228
(57%)
58 (15%)
110 (28%) 5. to be able to become a doctor, dentist, teacher or
some other job like these
166 (42%) 117 (29%) 113 (28%)
While the majority of pupils selected the ‘correct’ answers for all but the ‘trick question’, higher proportions answered incorrectly or indicated that they were not sure compared to the
question on universities.
The pupils’ responses to these questions were added up to give them a score out of 5. The results are given in Table 5.
Table 5: Pupils’ scores out of 5 in relation to awareness of further and higher education
University Further education college
5 correct responses 60 (15%) 26 (7%)
4 correct responses 134 (34%) 72 (18%)
3 correct responses 110 (28%) 108 (27%)
2 correct responses 69 (17%) 89 (22%)
1 correct response 20 (5%) 74 (19%)
0 correct responses 6 (2%) 30 (8%)
The figures presented in Tables 3 to 5 suggest that P6 pupils are less familiar with provision offered in FE colleges and overall are less confident about what kind of job preparation occurs in both further and higher education.
The responses were analysed to see if there were any statistically significant differences based on authority and gender. The full data are given in Appendix 2 (pp 47-49).
There were authority differences in relation to 2 of the statements:
• In response to the statement about a university being a place where you could learn to become a doctor etc, pupils in ‘rural’ locations were less likely to give the correct answer (64% compared with 80% in Glasgow) with higher proportions saying ‘no’ or ‘not sure’ (14% and 21% respectively, compared with 3% and 17% respectively in Glasgow).
• In response to the statement about a further education being a place where you could study at the same time as having a job, again the rural authorities were less likely to give the correct answer (31% compared with 69% in the ‘urban’ authorities). The proportions saying ‘no’ or ‘not sure’ were 24% and 45% respectively, compared with 10% and 21% respectively in the ‘urban’ authorities.
[image:16.595.132.466.363.463.2]differences: going to an FE college at 16 and studying while in a job. Again differences were accounted for by higher proportions of the girls saying they were ‘not sure’.
There were no differences by location or gender in relation to the number of correct answers recorded.
Pupils’ aspirations
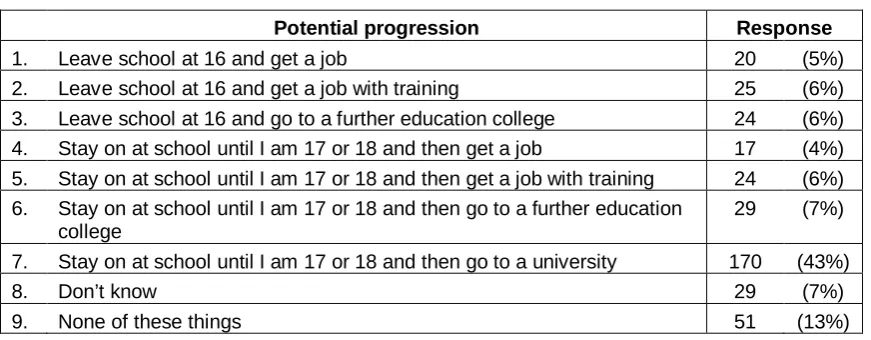
[image:17.595.84.520.281.451.2]The pupils were asked to indicate from a list of options what they might do on leaving school. They were also given the opportunity to say they wanted to do something different. While pupils at this age will probably change their minds several times before leaving school, it is interesting to investigate what opportunities they are aware of. The options were also collapsed into broader categories for ease of analysis, namely: get a job; go to further education; go to university; other. The responses are reported in Tables 6 and 7.
Table 6: P6 pupils’ current aspirations on leaving school
Potential progression Response
1. Leave school at 16 and get a job 20 (5%)
2. Leave school at 16 and get a job with training 25 (6%)
3. Leave school at 16 and go to a further education college 24 (6%)
4. Stay on at school until I am 17 or 18 and then get a job 17 (4%)
5. Stay on at school until I am 17 or 18 and then get a job with training 24 (6%) 6. Stay on at school until I am 17 or 18 and then go to a further education
college
29 (7%)
7. Stay on at school until I am 17 or 18 and then go to a university 170 (43%)
8. Don’t know 29 (7%)
9. None of these things 51 (13%)
Table 7: P6 pupils’ current aspirations on leaving school (summary) Potential progression Response
1. Get a job 86 (22%)
2. Go to further education 53 (13%)
3. Go to university 170 (43%)
4. Other 80 (20%)
The aspirations of the majority were to continue to higher education, with just under a quarter hoping to go directly into employment on leaving school, with about an eighth aspiring to further education. The lower mention of further education in this context aligns with the apparent lower levels of awareness of opportunities provided by further education.
No statistically significant differences were found in the data in relation to the local authority contexts; however there were differences in gender. A higher proportion of girls (50%) aspired to university entrance than boys (37%). More boys (25%) than girls (17%) suggested they wanted to do ‘other things’ or ‘didn’t know’ (see Appendix 2, p50).
Of those who said they wanted to do none of these things, 40 gave alternatives: • 18 (17 boys and 1 girl) wanted to be football players
[image:17.595.159.446.497.575.2]• 10 listed a range of jobs they were aspiring to: nursery teacher, hairdresser or teacher (2), vet, designer, policeman, surgeon, pilot and joining the army
• 9 listed versions of their planned progression: university then a job (2); leave at 16, go to FE, then to university, then a job (4); leave school at 16 and go to university; go to university while working; one was quite specific: ‘I am going to high school,
university and then law school to be a lawyer’. • One reported ‘I am going to America.’
It is perhaps unsurprising that, at this age, boys aspire to be footballers. We might question whether this is realisable or not, but it is important to recognise that young people do have aspirations other than ongoing formal education which can be harnessed. The various job aspirations expressed by the pupils require training and study and they may not yet be aware of the routes to these occupations. Some pupils highlighted a progression that was more precise than our tick list allowed for, but they added a further 9 to those aspiring to university.
Attitudes to participation in university study
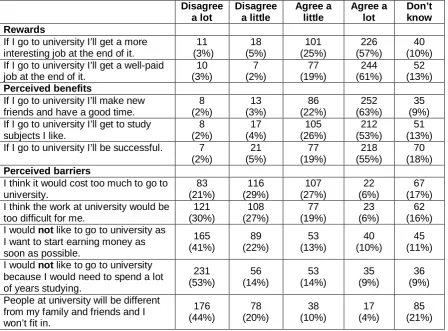
[image:18.595.74.523.402.733.2]The pupils were asked to indicate the extent to which they agreed with a range of statements about going to university. With such high numbers apparently aspiring to university, it might be expected that there would be agreement with the benefits and disagreement with potential barriers. The responses for the whole sample are given in Table 8. The statements have been re-organised from the order in the questionnaire to group together the statements on long-term rewards, other perceived benefits and perceived barriers.
Table 8: Pupils’ agreement with views on participating in university study Disagree a lot Disagree a little Agree a little Agree a lot Don’t know Rewards
If I go to university I’ll get a more interesting job at the end of it.
11 (3%) 18 (5%) 101 (25%) 226 (57%) 40 (10%) If I go to university I’ll get a well-paid
job at the end of it.
10 (3%) 7 (2%) 77 (19%) 244 (61%) 52 (13%) Perceived benefits
If I go to university I’ll make new friends and have a good time.
8 (2%) 13 (3%) 86 (22%) 252 (63%) 35 (9%) If I go to university I’ll get to study
subjects I like.
8 (2%) 17 (4%) 105 (26%) 212 (53%) 51 (13%) If I go to university I’ll be successful. 7
(2%) 21 (5%) 77 (19%) 218 (55%) 70 (18%) Perceived barriers
I think it would cost too much to go to university. 83 (21%) 116 (29%) 107 (27%) 22 (6%) 67 (17%) I think the work at university would be
too difficult for me.
121 (30%) 108 (27%) 77 (19%) 23 (6%) 62 (16%) I wouldnot like to go to university as
I want to start earning money as soon as possible.
165 (41%) 89 (22%) 53 (13%) 40 (10%) 45 (11%)
I wouldnot like to go to university because I would need to spend a lot of years studying.
231 (53%) 56 (14%) 53 (14%) 35 (9%) 36 (9%)
People at university will be different from my family and friends and I won’t fit in.
176 (44%) 78 (20%) 38 (10%) 17 (4%) 85 (21%)
Chart 1: Perceived rewards of university education
0 20 40 60 80 100 w ell paid job
interesting job
Agree Disagree Don't know
Chart 2: Other perceived benefits of university education
0 20 40 60 80 100 be successful
subject I like make new f riends
Agree Disagree Don't know
Chart 3: Perceived barriers to participation
0 20 40 60 80 100 I w on't f it in
a lot of years w ant to earn
money university too
dif ficult university costs
too much
Agree Disagree Don't know
money. ‘Not fitting in’ because people at university will be different (‘it’s not for the like of us’ syndrome) was least likely to be seen as a barrier, with only 14% agreeing.
It is also interesting to note the slightly higher proportions who expressed uncertainty in relation to ‘not fitting in’, being successful at university, the costs of going to university and the difficulty of the study.
There were no statistically significant differences in responses according to the local authority location of the pupils. There was one difference based on gender: 77% of the girls disagreed with the statement about not wanting to go to university because of the number of years of study involved, while only 55% of the boys disagreed (see Appendix 2, p51). This may reflect the higher proportion of girls than boys saying they wanted to go to university reported earlier (p8).
Influences on participation
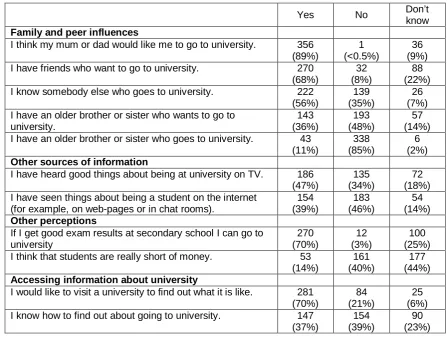
[image:20.595.79.527.344.682.2]A final question asked pupils to respond to a number of statements about issues which might be influential in a young person’s aspirations and, ultimately, in their decision to progress to university study. Their responses are reported in Table 9.
Table 9: Young people’s views on influences to progression to university study
Yes No Don’t
know
Family and peer influences
I think my mum or dad would like me to go to university. 356 (89%)
1 (<0.5%)
36 (9%)
I have friends who want to go to university. 270
(68%)
32 (8%)
88 (22%)
I know somebody else who goes to university. 222
(56%)
139 (35%)
26 (7%) I have an older brother or sister who wants to go to
university. 143 (36%) 193 (48%) 57 (14%) I have an older brother or sister who goes to university. 43
(11%)
338 (85%)
6 (2%)
Other sources of information
I have heard good things about being at university on TV. 186 (47%)
135 (34%)
72 (18%) I have seen things about being a student on the internet
(for example, on web-pages or in chat rooms).
154 (39%) 183 (46%) 54 (14%) Other perceptions
If I get good exam results at secondary school I can go to university 270 (70%) 12 (3%) 100 (25%) I think that students are really short of money. 53
(14%)
161 (40%)
177 (44%)
Accessing information about university
I would like to visit a university to find out what it is like. 281 (70%)
84 (21%)
25 (6%) I know how to find out about going to university. 147
(37%)
154 (39%)
90 (23%)
Chart 4: Family and peer influences
0 20 40 60 80 100 sibling at
university sibling w ants to
go know somebody
w ho goes friends w ant to
go mum or dad
w ould like
yes no don't know
Chart 5: Other sources of information
0 20 40 60 80 100 internet
TV (good things)
yes no don't know
Chart 6: Other perceptions
0 20 40 60 80 100 students short of
money good exam results needed
yes no don't know
Chart 7: Accessing information
0 20 40 60 80 100 know how to
find out like to visit
In relation to family, the young people were confident that their parents would be supportive of their going to university (almost 90%), with the remainder unsure. However, only a small number had brothers or sisters already at university and around a third indicated that they had brothers or sisters who wanted to go to university. (Those who responded ‘no’ may have brothers or sisters who do not go or do not aspire to go to university, or they may not have any brothers or sisters. That does not matter for this question as the purpose is to identify the extent to which they might be positive influences in the lives of the young people.) Influences from those already at university were more likely to be outside the immediate family. While two-thirds thought that their friends would like to go to university, just under a quarter admitted that they didn’t know.
Differences noted amongst pupils in the different types of authorities were:
• The pupils from the Lanarkshire authorities were more likely to say that they had friends who wanted to go to university (88%) compared to both the Glasgow and urban authorities (63% and 65% respectively). 71% of the rural pupils said ‘yes’ in response to this question. Only 9% of the Lanarkshire pupils ‘didn’t know’, compared with 26% and 27% of the Glasgow and urban authorities.
• 87% of the Lanarkshire pupils and 76% of the urban pupils thought that if they got good exam results they could go to university, compared with 64% of both the rural and Glasgow pupils. More of the latter two groups of pupils were likely to say that they were not sure.
• 74% of rural pupils and 62% of the Lanarkshire pupils said they had seen things about being a student on the internet, compared with 31% and 27% of the urban and
Glasgow pupils, who were more likely to say ‘no’. This may reflect access to the internet rather than what information is acquired via the internet.
• 86% of urban and 80% of Glasgow pupils said they would like to visit a university to see what it is like, while 24% of rural and 59% of Lanarkshire pupils said ‘yes’, with a greater proportion of them saying ‘no’ as opposed to ‘don’t know’.
There were no statistically significant differences based on gender in relation to influences on participation.
Influence of attitudes to school and self-esteem
To investigate the pupils’ attitudes to school and their self-esteem, two scales were used from the Self- Description Questionnaire (SDQ). As explained in the section on methodology (p1), the SDQ is an instrument developed to measure self-concept in a number of academic and non-academic areas.
Over the whole sample the mean scores and standard deviations were:
m sd
• General school 29.23 5.75 • General self 32.94 4.75
These represent strongly positive responses by the pupils. The responses were analysed for differences between boys and girls using t-test (detailed results in Appendix 2, p54). There were no differences in relation to self-esteem, but girls were more positive in their attitude to school, though the boys were still largely positive.
The mean scores on the general school and general self scales for boys and girls were:
Boys Girls
• General school 28.57 29.80 • General self 32.48 33.34
The results were analysed by quartile, ie the sample was divided into 4 equal groups. On the general school scale the range of scores was:
• top quartile scored 34 and above
• second quartile scored between 30 and 33 • third quartile scored between 26 and 29 • bottom quartile scored 25 and below
On the general self scale the range of scores was: • top quartile scored 37 and above
• second quartile scored between 34 and 36 • third quartile scored between 30 and 33 • bottom quartile scored 29 and below
[image:23.595.182.418.572.730.2]While it might be expected that pupils who rate themselves highly on one scale would rate themselves highly on the other, there was not an exact match between the two. However, just over two-thirds of the respondents were in the same or adjacent top and bottom quartiles (ie top half and bottom half of the sample). Table 10 shows how the responses varied, where the responses falling in the top half of the sample have been compared with the bottom half on both scales.
Table 10: Matching of respondents positions across ‘general school’ and ‘general self’ scales
Positive school and positive self
Positive school and less positive self 129
(35%)
62 (17%)
Less positive school and positive self
Less positive school and less positive self 59
(16%)
122 (33%)
The following aspects of the survey data were investigated for differences based on attitude to school and self-esteem:
• Knowledge of higher and further education based on the total scores achieved in questions 2 and 3
• Aspirations based on summary categories in question 4 • Issues from questions 5 (attitudes) and 6 (influences).
Statistically significant differences which emerged are noted here; details of the statistics are reported in Appendix 2 (pp54-59).
Knowledge of higher and further education
• The pupils in the bottom quartile on the attitude to school scale were less likely to answer the questions about higher education correctly compared to the remainder of the sample.
• The pupils in the bottom two quartiles on the self-esteem scale were less likely to answer the questions about higher education correctly compared to the top quartile. This suggests that those who think they are doing less well may have paid less attention to the study opportunities that will be available to them after school, although there were no differences in relation to knowledge of further education. However, we have already noted that, generally, young people were less likely to be aware of further education.
Aspirations of progression on leaving school
There was some evidence of difference in aspirations after school, but these werenot
statistically significant and so may have occurred through chance. These figures are based on the attitude to school scale:
• 51% of those in the top quartile and 50% of those in the second quartile aspired to university education
• 40% of those in the third quartile aspired to university • 32% of those in the fourth quartile aspired to university.
Therefore, as many as a third of those who recorded the least positive attitudes to school indicated that they would like to go to university after school.
Attitudes to university study (question 5)
There were significant differences between the quartiles of the sample on both scales in relation to 4 items – ‘If I go to university…
• I’ll get a well-paid job at the end of it • I’ll get to study the subjects I like
• I’ll make new friends and have a good time • I’ll be successful.
The differences on each statement on the two scales varied in degree, on account of the bottom quartile scoring significantly lower than the other 3 quartiles in some cases, or the difference being only between the top and bottom quartiles. However, the overall tendency was for those who rated both attitude to school and self-esteem more highly to be more positive about these statements, while those who rated themselves less positively in relation to school and self were also less positive about the statements.
Influences on participation in higher education (question 6)
On both scales this was largely due to higher proportions of the pupils in the two top quartiles saying ‘yes’ and more of those in the bottom two quartiles saying they ‘don’t know’.
Three differences emerged based on the attitude to school scale: two in relation to sources of information – television and internet. In response to both of these, the pupils in the top 2 quartiles were more likely to say ‘yes’ than the others. This may relate to interest, influence of parents on what is watched or accessed on the internet, or indeed access to the internet at all. However, the underlying cause of the differences would require further investigation. The third difference related to awareness of student finances. Across all quartiles over 40% indicated that they did not know, but pupils in the top 2 quartiles were more likely to say that they thought students were NOT short of money, compared to the bottom quartiles where slightly more said they thought they were.
A further difference emerged, this time based on the self-esteem scale only. This was in relation to knowing how to find out about going to university. Unsurprisingly, more in the top quartile said ‘yes’ compared to those in the bottom quartile.
3.2
Sub-sample based on parental survey
A short questionnaire was issued to parents at the same time as parental consent was being sought for the pupils to participate in the survey. The purpose of the parents’ questionnaire was to find out if there were aspects of family and parental background which might influence pupils’ aspirations and choices; for example, the parents’ own experience of post-school education, employment status and socio-economic status. The parents were supplied with envelopes marked ‘private and confidential’ in which to seal and return the questionnaires. These were returned to the school for onward transmission to Quality in Education.
There was space to answer in relation to one or both parents. In the analysis which follows, the categorisation is based on one or both parents. For example, in relation to participation in study since school, a ‘yes’ was recorded where one parent had done this The type of
qualification was based on the highest qualification held between the two parents; if one parent was employed and the other unemployed, the household was not recorded as unemployed.
There was also a question about ethnic background, but as 97% of the respondents were ‘white Scottish’, this was not used for further analysis.
One hundred and forty-seven parent questionnaires were matched to pupil questionnaires. Responses came from 11 of the 26 schools in 8 of the 9 authorities.
Ninety-eight (67%) of this sample of 147 parents had taken part in training or study since leaving school. The information supplied indicates that:
• 51 (35%) had qualifications which would have been gained in further education • 10 (7%) had university degrees
• 20 (14%) had a professional qualification
• 17 (12%) had experienced some other kind of training.
Eighteen households (12%) were recorded as ‘unemployed’ and 22 pupils (15%) were entitled to free school meals. As these numbers were small, no further analysis was undertaken of the pupil responses on this basis.
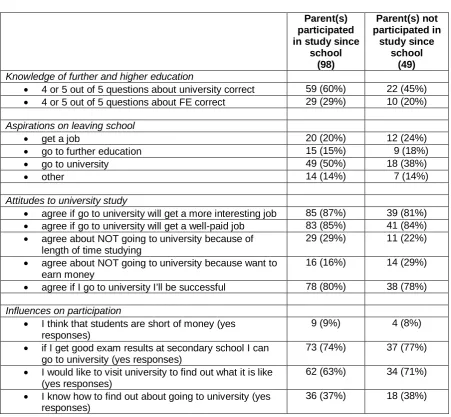
[image:26.595.75.527.224.641.2]It was considered relevant, however, to look at pupil responses in the light of their parents’ reported participation in education since leaving school. The points summarised in Table 11 are interesting, both for similarities and differences in responses. It should be noted that there were no statistically significant results in the data. Therefore, while there appear to be some differences between the two groups, these should be interpreted cautiously.
Table 11: Pupil responses analysed by parental participation in study since leaving school
Parent(s) participated in study since
school (98)
Parent(s) not participated in
study since school
(49)
Knowledge of further and higher education
• 4 or 5 out of 5 questions about university correct 59 (60%) 22 (45%)
• 4 or 5 out of 5 questions about FE correct 29 (29%) 10 (20%)
Aspirations on leaving school
• get a job 20 (20%) 12 (24%)
• go to further education 15 (15%) 9 (18%)
• go to university 49 (50%) 18 (38%)
• other 14 (14%) 7 (14%)
Attitudes to university study
• agree if go to university will get a more interesting job 85 (87%) 39 (81%)
• agree if go to university will get a well-paid job 83 (85%) 41 (84%)
• agree about NOT going to university because of length of time studying
29 (29%) 11 (22%)
• agree about NOT going to university because want to earn money
16 (16%) 14 (29%)
• agree if I go to university I’ll be successful 78 (80%) 38 (78%)
Influences on participation
• I think that students are short of money (yes responses)
9 (9%) 4 (8%)
• if I get good exam results at secondary school I can go to university (yes responses)
73 (74%) 37 (77%)
• I would like to visit university to find out what it is like (yes responses)
62 (63%) 34 (71%)
• I know how to find out about going to university (yes responses)
36 (37%) 18 (38%)
3.3 Summary
A representative sample of P6 pupils was identified from schools that had not yet participated in the GOALS project. These schools were located in 9 of the 11 GOALS authorities (two had no non-participating schools). Primary schools associated with secondaries with lower further and higher education progression rates were targeted. Responses were received from 399 pupils, representing 26 schools from the 9 authorities.
Pupils were asked questions about their knowledge of further and higher education, their aspirations on leaving school, attitudes to university study and potential influences on their participation in university education.
Knowledge and awareness of further and higher education
The responses indicate that pupils were more aware of university provision than the opportunities offered by further education. In response to 5 questions on each, 49%
answered 4 or 5 questions correctly in relation to universities, while only 25% answered 4 or 5 questions correctly in relation to further education colleges. A higher proportion of the pupils selected ‘not sure’ when answering the questions about further education.
Responses also indicated that more than half were unclear about the kind of job preparation that occurs in both further and higher education.
Aspirations
Overall, 43% indicated that they would like to go to university, 22% indicated that they wanted to get a job on leaving school (at 16, 17 or 18), 13% opted for further education, 13% made other suggestions and 7% did not know. The lower mention of further education aligns with the apparent lower levels of awareness of opportunities provided by further education. Fifty percent of the girls, compared with 37% of the boys, said they wanted to go to university.
Attitudes to participation in university study
The majority of pupils were in agreement with the perceived benefits, both long and short term, of a university education. The percentages agreeing were:
• gaining an interesting job 82% • gaining a well-paid job 80% • making new friends and enjoying 85%
themselves
• studying subjects they liked 79% • being successful 74%.
While the majority disagreed with the barriers, a substantial minority did agree that some aspects presented potential barriers. The percentagesagreeing with the barriers were:
• university costs too much 33% • the work is too difficult 25% • they want to earn money sooner 23% • they don’t want to spend years studying 23% • they think they won’t fit in 14%.
Influence on participation
The pupils responded to a set of statements about family influences, other potential influences such as TV and internet, and other perceptions they have.
• Eighty-nine percent of the pupils were confident that their parents would like them to go to university, although only 11% said they had a brother or sister who already went to university.
• Forty-seven percent said they had seen good things about being at university on the TV and 39% said they had seen things about being a student on the internet.
• Seventy percent thought that if they got good exam results at secondary school they could go to university, which aligns with the 74% who thought they would be
successful.
• Only 14% thought students were short of money, although 44% indicated that they did not know.
• 70% said they would like to visit a university to see what it is like and 37% said they knew how to find out about going to university.
Influences of attitude to school and self-esteem as measured by SDQ-1
Generally, the pupils rated themselves highly on these two scales which shows a positive attitude to school and how successful they are, and a positive attitude to self. The
questionnaire responses were analysed to see if there were differences between pupils whose scores put them in the different quartiles of the sample.
• Those in the bottom quartiles were less likely to answer correctly the questions about higher education.
• Around a half of those in the top quartiles aspired to university; however, a third of those in the bottom quartile also indicated that they would like to go to university. • Those who rated themselves more negatively on the self-concept scales were also
more negative about getting a well paid job as a result of a university education, getting to study subjects they liked, making new friends and being successful if they went to university.
• More pupils in the top quartiles agreed that if they got good exam results they could go to university than those in the lower quartiles.
Sub-sample based on parent survey
Parents were asked to complete a short questionnaire which identified if they had participated in study or training since leaving school, their employment status and if their child was entitled to free school meals. It was possible to match 147 parent and pupil questionnaires. Too few were classed as unemployed or had children entitled to free school meals to undertake any analysis based on this information. However, 99 (67%) had taken part in training or study since leaving school, and the responses of pupils whose parents had participated in study were compared with those who had not.
The comparison did not lead to any statistically significant differences. These points were noted:
• Pupils whose parents have experience of study may have slightly more knowledge of further and higher education and more may aspire to go to university.
• Both groups seem equally clear that a university education leads to interesting and well-paid jobs.
4.
Evidence from interviews relating to parents’ educational
aspirations for their children
4.1 Introduction
During telephone interviews, the sample of 40 parents of Primary 6 children (described in the methodology section) responded to open-ended questions about their children’s educational aspirations, whether and why they shared these aspirations, and any perceived difficulties in realising them. Almost all the parents responded fully to the questions on the schedule, often illustrating their responses with their own experience of university or FE college or with lessons they had drawn from missing out on such experience. Often the planned prompts on the interview schedule were not required, since most parents provided a clear picture of their preferred educational destinations for their children. The majority of parents had‘sat down and talked’with their children about educational pathways and intended to continue doing so. As noted in the methodology section, willingness to respond to the invitation to be interviewed might have biased the sample towards parents who encourage their children to take an interest in post-16 education.
Parents’ preferences about their children’s educational destinations often were not clear cut or firm. For instance, a parent said:
My first choice for H would be university, if he can get in, but even then, if he wanted to do something like being a motor mechanic that could be done in an FE college, that would be OK.
4.2
Broad themes extracted from the interviews
Given that parents’ and children’s eventual choice of post-16 education seemed to be dependent on a confluence of factors operating several years from now, it seemed
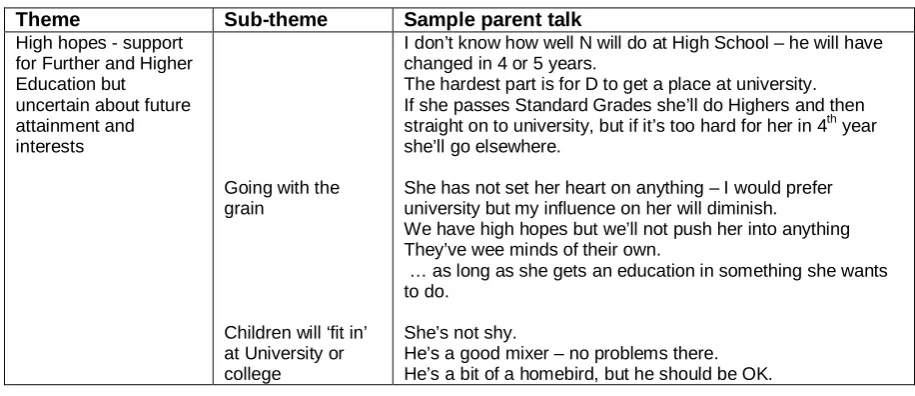
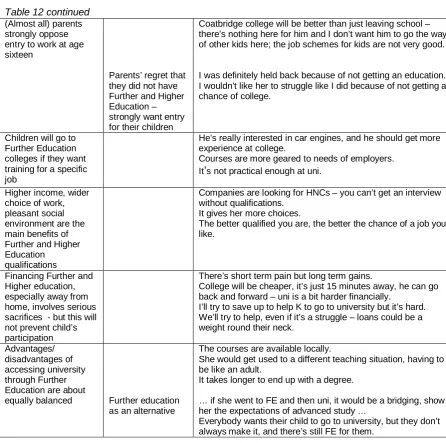
[image:29.595.70.528.519.717.2]inappropriate to try to quantify the qualitative data. Therefore, themes and sub-themes were extracted from the interview data. Table 12 shows these themes and sub-themes.
Table 12: Description of themes, sub-themes and samples of parent talk
Theme Sub-theme Sample parent talk
High hopes - support for Further and Higher Education but uncertain about future attainment and interests
Going with the grain
Children will ‘fit in’ at University or college
I don’t know how well N will do at High School – he will have changed in 4 or 5 years.
The hardest part is for D to get a place at university. If she passes Standard Grades she’ll do Highers and then straight on to university, but if it’s too hard for her in 4th year she’ll go elsewhere.
She has not set her heart on anything – I would prefer university but my influence on her will diminish.
We have high hopes but we’ll not push her into anything They’ve wee minds of their own.
… as long as she gets an education in something she wants to do.
She’s not shy.
Table 12 continued
(Almost all) parents strongly oppose entry to work at age sixteen
Parents’ regret that they did not have Further and Higher Education – strongly want entry for their children
Coatbridge college will be better than just leaving school – there’s nothing here for him and I don’t want him to go the way of other kids here; the job schemes for kids are not very good.
I was definitely held back because of not getting an education. I wouldn’t like her to struggle like I did because of not getting a chance of college.
Children will go to Further Education colleges if they want training for a specific job
He’s really interested in car engines, and he should get more experience at college.
Courses are more geared to needs of employers. It’s not practical enough at uni.
Higher income, wider choice of work, pleasant social environment are the main benefits of Further and Higher Education
qualifications
Companies are looking for HNCs – you can’t get an interview without qualifications.
It gives her more choices.
The better qualified you are, the better the chance of a job you like.
Financing Further and Higher education, especially away from home, involves serious sacrifices - but this will not prevent child’s participation
There’s short term pain but long term gains.
College will be cheaper, it’s just 15 minutes away, he can go back and forward – uni is a bit harder financially.
I’ll try to save up to help K to go to university but it’s hard. We’ll try to help, even if it’s a struggle – loans could be a weight round their neck.
Advantages/ disadvantages of accessing university through Further Education are about
equally balanced Further education as an alternative
The courses are available locally.
She would get used to a different teaching situation, having to be like an adult.
It takes longer to end up with a degree.
… if she went to FE and then uni, it would be a bridging, show her the expectations of advanced study …
Everybody wants their child to go to university, but they don’t always make it, and there’s still FE for them.
High hopes – support for further and higher education but uncertain about future attainment and interests
Almost all the parents interviewed believed that their children wanted to remain in some form of education after age sixteen and, on the whole, the parents shared their children’s
aspirations and intended to support them. Parents who mentioned university understood that entry depended on their children working productively until S5 or S6 to achieve entrance qualifications, and often mentioned this requirement to their children. Most of those who said that an FE college course was equally acceptable had some understanding that their children could start on the lower rungs of the vocational qualification structure without a strong
performance at Standard or Higher Grade.