1 INTRODUCTION
Fluid flow predictions for ships and marine structures are often significantly more complex than those for other vehicles. Sailing on a random free surface and undergoing large unsteady dynamic motions poses a significant number of extra requirements to the methods applied. In the past, researchers have developed numerous, dedicated computational methods having par-ticular applications in mind. Although these methods are extremely useful tools in their own right, the majority of them lack the level of accuracy which would allow the replacement of tra-ditional model testing, which is still the measure to compare with. The large variety of numeri-cal methods developed for dedicated applications poses another problem when targeting an in-tegrated approach to ship simulation and optimisation during design. Different requirements, numerical approaches and implementation issues often do not allow for easy exchange of data and hence for the interplay of numerical methods and the collaboration of partner design teams, the latter amplified by the fact that use of most of these tools are laborious and time consuming. Moreover, today’s requirements for life cycle considerations during product design are pro-gressively a necessity. This calls in turn for a more integrated product development and design approach covering all pertinent aspects of ship hydrodynamic behaviour. Therefore, in order to maintain its competitive edge, the European Shipbuilding industry must be supplied with accu-rate, fast and integrated analysis tools, applicable over the full duration of the ship design proc-ess and capable of covering all relevant aspects of hydrodynamic design analysis in a holistic manner. To meet this need a software platform, the VIRTUE Integration Platform (VIP), is be-ing developed as part of the VIRtual Tank Utility in Europe (VIRTUE), an EU 6th Framework Programme funded project.
This paper presents an overview of current practice before outlining the needs and require-ments for the VIP platform from a user’s perspective (i.e. model basins and design consultants). A proposed system architecture is presented to meet those requirements.
VIRTUE: integrating CFD ship design
Alex Duffy
$, Stefan Harries
%, Jochen Marzi
*, Christoph Petz
^and Zichao Wu
$ $CAD Centre, DMEM, University of Strathclyde, e-mail [email protected], [email protected]
%FRIENDSHIP SYSTEMS GmbH, Germany, Phone +49 (0)331 – 96 766 0, e-mail
*HSVA, Germany, Phone +49 (0)40 – 69 20 32 36, e-mail [email protected] ^ZIB, Germany, Phone +49 (0)30 – 8 41 85 – 286, e-mail [email protected]
2 CURRENT PRACTICE AND FUTURE OF HYDRODYNAMIC DESIGN
Today’s transportation demands often lead to ships which expand the limits of experience, ei-ther in terms of speed requirements, unconventional hull forms or very large designs with raei-ther unusual main particulars. This is due to a rapidly changing maritime market and it is here where computational fluid dynamics offers its full potential for hydrodynamic design.
While it is always desirable to obtain the best possible solution for a given problem this, unfor-tunately, is often prohibitively expensive with regard to time and budget. Model basins and de-sign consultancies therefore develop, utilize and rely on a range of codes for hydrodynamic analysis to complement model test campaigns. The codes comprise (purpose built) potential flow methods, e.g. for wave resistance predictions or seakeeping analyses, as well as more com-plex and resource intensive RANSE methods.
Up till now, manual processes prevail where just a few hull form modifications are studied and the evaluation and interpretation of results is mostly based on the intuition and experience of the specialists doing the work. For a resistance problem, for instance, this means that the wave pat-tern and the pressure distribution are assessed, that maximum wave elevation at the hull and in the near field are compared, and that local flow phenomena are inspected. All this is largely based on the skill of the consultant applying criteria that may be obvious and sensible to humans but which are sometimes qualitative and sometimes difficult to formalise. Running much more complex (and automated) optimisations for many hundreds and even thousands of designs, however, does not allow for any (substantial) human interaction and relies on the correct rank-ing of the competrank-ing variants.
Being computationally efficient and sufficiently accurate it has been shown that potential flow codes could already be integrated very successfully into formal optimisation processes, see for instance (Valdenazzi et al., 2003) and (Harries, 2006). Rising challenges, however, call for fu-ture solutions which cover several, possibly conflicting, objectives and, eventually, the complete (hydrodynamic) life-cycle of a ship including its performance in relevant seaways, during (criti-cal) manoeuvres and the like. A major drawback associated with the many different CFD meth-ods needed to simulate the different flow phenomena of interest is the large variety of different (data) requirements. Presently, a substantial effort in handling, converting and providing the right data is required, be it geometry, computational parameters, grids, flow fields, visualisa-tions or further assessments. Consequently, so as to perform such optimisavisualisa-tions economically, the many special purpose tools used in the process need to be highly integrated and provide:
o Ready availability of geometry for all analyses.
o Sophisticated geometric modelling techniques to realize form variations.
o Advanced visualisations to interpret, compare and confront comprehensive data sets. o Flexible access to a large range of different CFD methods meeting the required
accu-racy.
o Easy performance and control of multi-objective, and even multi-disciplinary,
optimisa-tions.
All of these requirements are suitably addressed within the VIRTUE project. While the chal-lenges of integration will be elaborated in the next chapter, important issues of geometric mod-elling as well as advanced visualisation will be discussed below. The many issues of CFD are of course also of prime importance and, hence, form a major part of the research effort in VIRTUE (Marzi, 2006).
3D surface models, either as legacy CAD models or in exchange formats such as IGES, 2D lines data and even traditional drawings. One therefore needs to deal with different data formats and, consequently, an excellent CAD environment is crucial for successful project work. When in-vestigating hull form variations the approach currently taken depends on the particular design task at hand. Available techniques comprise the full spectrum from individual point/data ma-nipulation and vertex control via partially parametric methods up to fully parametric modelling (Harries et al., 2004).
With just a few variants to study, and as long as the parent hull has already been modelled within the CAD tool available to the team, it is reasonable to produce alternative forms by point (or curve) manipulation interactively. This is very flexible but each variant takes considerable time to realize. Typically, just a handful of form variants can be produced during one working day even if the high fairness standards for production are relaxed.
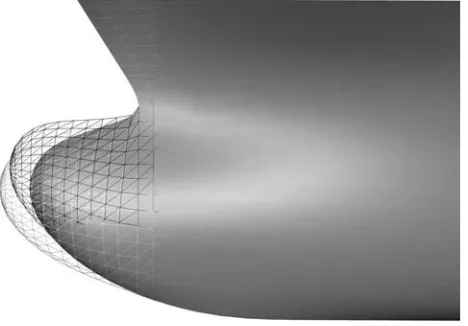
[image:3.595.173.407.469.632.2]A more targeted approach is to relate form changes directly to the hydrodynamic performance of interest. For instance, when computing a ship’s calm water wave resistance from potential theory with a non-linear free surface code the hull form is represented by a dense grid of panels. The panels can be suitably modified in a semi-automatic mode (Marzi, 2003) or even by a fully-automatic strategy (Heimann, 2005). HSVA for instance applies an in-house program called panipul in combination with its panel code ν-Shallo during the phase of initial form optimisa-tion before towing tank testing. The tool offers different sets of algebraic funcoptimisa-tions to modify ei-ther the entire hull or a clearly defined region, for example the bulb or the forward shoulder. Both global and local changes can be evoked. At the end of an optimisation the improved hull form can be transferred back into the main CAD system, here NAPA, for further processing. The method has been proven in a number of applications.
Figure 2.1 to figure 2.3 present an example of the Hamburg Test Case (also known as Ville de Mercure, a well-known 1600 TEU container carrier). The form modifications were confined to the bulb that was enlarged in two steps, namely a lengthening and an upward shift. The example is representative of determining the influence of important design parameters, here bulb length and height, and serves to show that substantial improvements can be readily achieved by intro-ducing relatively small modifications.
Figure 2.1: Hamburg Test Case – Local deformation of the bulb as realized with panipul. Original (opaque), Mode 42 (light grey wire frame), Mode 52 (dark grey wire frame)
mathe-matical surface representation of high quality for boundaries or demand a volume definition of the entire fluid domain, grid generation being a crucial issue.
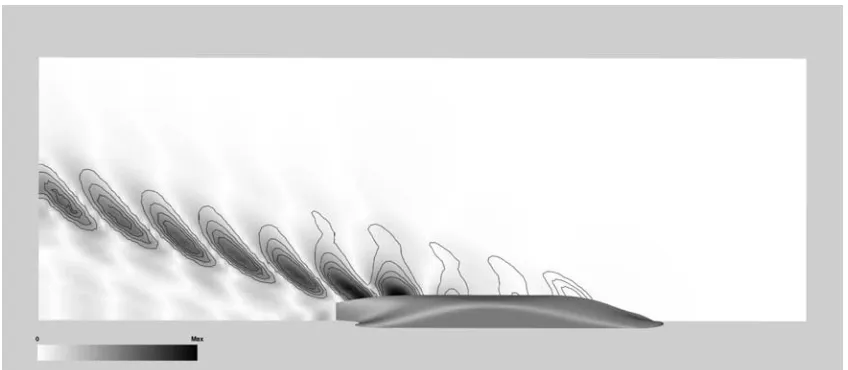
Figure 2.2: Hamburg Test Case – Comparison of wave pattern computed with ν-Shallo for the original hull form and a hull with bulb modification. 15 levels of the wave field between -1.5 m and 1.5 m.
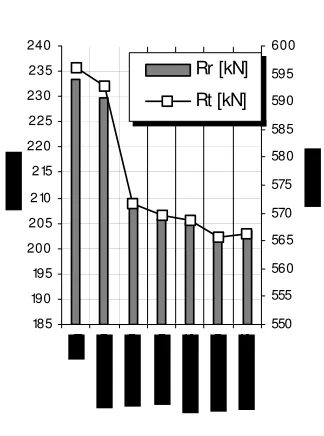
Figure 2.3: Hamburg Test Case – Wave and total resistance for original hull form and six successive bulb modifications
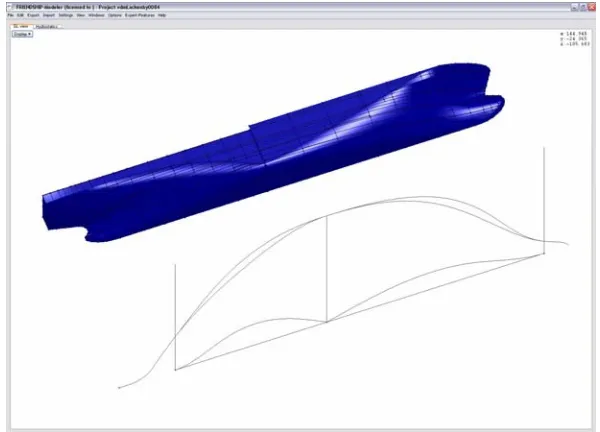
Therefore, an advanced optimisation process requires a proper modelling of the variants, pref-erably based on easy to use meta-data following functional design concepts. A sophisticated CAD solution with a parametric approach such as the FRIENDSHIP-Modeler is then mandatory in order to generate the anticipated shapes with the necessary quality and with as little input, i.e., free variables, as possible. In general, parametric approaches can be classified as partially para-metric or fully parapara-metric.
A partially parametric approach applies parametric modelling techniques on data derived from standard CAD tools. The shape might be given as B-spline curves and surfaces contained in an IGES-file or might even be made available as plain offset data only. Changes to the geometry are suitably parameterized, for instance via added patches, box deformations, merging or swing-ing (known as a Lackenby shift). Figure 2.4 shows an example of swswing-ingswing-ing applied to the Ham-burg Test Case as realized with the Generalized Lackenby approach of the
FRIENDSHIP-185 190 195 200 205 210 215 220 225 230 235 240
550 555 560 565 570 575 580 585 590 595 600
Rr [kN]
[image:4.595.203.365.345.563.2]Modeler. Figure 2.5 illustrates the extent of modifications that can be brought about by utilizing only two free variables, the classical changes in prismatic coefficient (here ± 0.5% of the parent hull) and in longitudinal centre of buoyancy (change ± 1.5%).
Finally, a fully parametric approach is even more efficient and powerful with regard to form variations. The entire shape is generated from form parameters without resource intensive inter-active work. If the parent hull is parametrically generated from the start or suitable form pa-rameters have been identified to closely approximate a given hull form, the spectrum of modifi-cations is considerable, ranging from global and comprehensive to local and subtle. Potentials and successes of this approach are reported in (Harries, 2006).
[image:5.595.147.447.486.702.2]While the changes introduced by the Generalized Lackenby approach (figure 2.5) might be slightly too pronounced for a typical commercial project, the example shall serve to bring to at-tention that the data produced within a formal optimisation process calls for new ideas in visu-alisation. The obvious and most widely applied method is the direct visual comparison of simi-lar visualisation scenes for two (or more) variants. This is either done by putting a number of images side-by-side or by switching repeatedly between views. The latter has the advantage that small differences in the data sets are readily perceived (but, naturally, it needs media other than paper). A visualization of the absolute differences of field values is the next step towards a more comprehensible and meaningful comparison. In the case of wave fields these methods work quite well (figure 2.6). For direct comparison the differences between data sets are large enough. Comparing hull forms is a bit harder since the geometry itself possess no direct colour information. Pair-wise comparisons of hull forms can be done by calculating the minimum dis-tances from all points on the first hull to the surface of the second hull. These differences can then be presented with colour coding on the first hull. A joint visualization that includes infor-mation from all data sets enables an observer to extract inforinfor-mation concerning all variants at a glance. This is presented in figure 2.5 which gives the image of the statistical variances of the hull form variations along with the variance of wave heights, as computed from a non-linear po-tential flow code in a Design-of-Experiment with 171 hulls. These statistical analyses might help to better comprehend the cause-and-effect of changes. Nevertheless, further work will be undertaken within VIRTUE in order to develop, introduce and utilize advanced visualisation in hydrodynamic design.
Figure 2.5: Variance plot illustrating extent of a partially parametric form variation and influence of form variations on wave pattern (NB: the pattern does not resemble a wave field)
Figure 2.6: Absolute difference plot of the wave heights. Comparison of the best hull variant with the original.
3 USER REQUIREMENTS
The Virtue Integration Platform (VIP) is required to provide management and support for all of the CFD and design tools required within an integrated CFD ship design environment. To do this it is first necessary to identify the user requirements. Such requirements should reflect the different scenarios for which the platform would be used, with the main users being the basins in the project partnership. The first task was to identify the key tools needed to address an over-all, holistic, ship CFD analysis. Additional tools could then be integrated into the platform at a later date. A comprehensive coverage of appropriate requirements of the user was considered including user interface, visualizations and scenarios, and addressed “why” and potential bene-fits. The requirements were elicited through a questionnaire:
[image:6.595.84.508.290.475.2]− Process control: Predefined processes, where a process is defined as a sequence of one or more tasks, should be available. Users should be able to construct, modify and run par-ticular processes depending on different user roles. The platform must also provide a mechanism to record and visualize the version and the state of processes. It should be possible to back-step in the process chain and repeat consecutive steps with modified pa-rameters, particularly for cases of errors or abnormal end of process, and it must be possi-ble to perform repetitive tasks.
− Project management: The platform should provide a means to monitor the work progress and the project manager must be able to obtain an overview at any time, and be able to in-form customers on work progress upon request. The project manager needs also to be able to specify the different levels of user access to the project data. They should have an option to specify permanence and to determine the data to be provided before closing a project.
− Optimization: It was clear that most of the basins and design consultancies currently do not employ optimization techniques as standard practice, over 60% responding rarely or never. Thus, optimization methods were not considered a primary concern for the initial phase of the VIP. However, the project partners envisage an increasing requirement for optimization so that by the end of 2009 optimization methods will be fairly common practice. Further, some partners indicated that by 2009 optimization methods based on RANSE computations are “desirable”. This implies that current methods address only computations based on potential theory. The feasibility of this has yet to be determined. However, the VIP would require an optimization tool that can store optimization history, capture generated data and re-use data from previous computations.
− Data Mining and Navigation: Requirements for this aspect of the platform needs further investigation but the notion is that it will provide direct comparisons to be made between data generated experimentally and that generated through simulations to facilitate the verification and validation of the underlying computational models.
− Verification and Validation: The VIP must assist the users in their work for verification by supporting grid sensitivity studies and the comparison of results of different code ver-sions. Consequently, it must be possible to import old calculations into the model. For validation purposes, experimental results are necessary. The platform therefore must have an import facility for model test and full-scale trials data. It must also be possible to com-pare and visualize experimental and computational results.
− Visualization: The project partners generally use third party software for visualization of the results and post-processing. A wide variety of different types of data, ranging from simple 2D to large 3D time dependent field data is used. The most complex and fre-quently used presentation being the visualization of 3D field data. The data may be time dependent and the grids may be fixed or moving. Computed data needs to be compared with experimental (non complete) data or variants of the computation and any differences should be quickly visible. The visualization should also provide a means for probing and extracting 1D and 2D data from a 3D data set and different audiences will influence the type of illustration, for example, a scientific or a more “commercial” (e.g. ray tracing) il-lustration. To explain computation results to non CFD-experts it must be possible to in-clude “mock ups” of the 3D geometry into the visualization scene. A collaborative visu-alization for experts sitting at different computers is also desirable.
− Data Management: A storage medium (e.g. common model) should support the commu-nication of the integrated tools. A version control system should be implemented to allow the tagging of data states and the platform should supply an estimation of storage (and CPU) requirements and issue a warning if unreasonable resources are required. The plat-form should take care of minimizing the data transfer and should provide mechanisms for data import and export, especially for legacy data.
identified and the reason provided to the user. Further, the user must be able to start (and stop) the (CFD) tools interactively.
4 THE VIRTUAL INTEGRATIED PLATFORM (VIP)
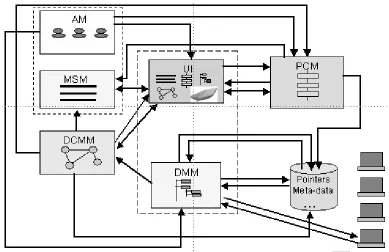
Understanding current practice and the user requirements, a system architecture has been produced detailing how the integration will be addressed and describes the fundamental building blocks that will be used to define and produce the VIP, and how these components may be com-bined into a holistic system. The architecture consists of five main modules and a user interface. The modules address system administration, data consistency, data management, process con-trol and messaging.
Administration module (AM): This module aims to provide a means for users to register in the platform; mechanisms to store, update and retrieve user information; and to supply such infor-mation to other modules of the platform. As such, the module provides first time users a means to register information such as their roles, capability, preferred platform user name and pass-word, contact means (e.g. email, phone), etc. The module will provide a means to store user in-formation and enable the platform administrator to retrieve and update such inin-formation. Where required it will supply other modules with user information (e.g. user roles).
Data consistency maintenance module (DCMM): This module represents the state of com-patibility with other data items that have direct or indirect dependency relationships. The char-acteristics of data consistency includes the notions that: two or more data items can exist, the data items have direct or indirect dependency relationships, data inconsistency is caused by changes to other data items, and data consistency can be maintained globally or locally by up-dating inconsistent data items. The module aims to represent and model data dependency rela-tionships and to maintain data consistency. The functionalities include: the module should be able to model data dependency and state of consistency, identify data inconsistency due to changes of other data items, and configure versions of different data items that are locally or globally consistent. The module should be closely coupled to the data management module to update data version information and communication with the process control module. The mod-ule should enable users to visualize data dependency relationships on a local machine, notify and provide explanation of data inconsistency via the user interface, and provide them with in-formation of version history, and consistent data versions. The module has a mix of peer-to-peer and a server-client architecture. It has peer-to-peer interactions with other modules of the plat-form and a client-side through which users can make requests of the platplat-form.
Data management module (DMM): The module enables users to view and update meta data of inter-used data in a central database, to download data from remote machines, and to update the data consistency maintenance module information of data versions. The functionalities will provide users with mechanisms to access meta-data of inter-used data according to user roles; support users to download data from remote machines through pointers that are stored in a cen-tral database; notify data consistency maintenance module information of updated data versions (e.g. design changes); and include an interface where users can define data conversions. Data is stored and distributed in local machines, while there is a central storage repository for meta-data.
Process control module (PCM): The PCM aims to co-ordinate different design and simula-tion tasks that are carried out by different users. The funcsimula-tionalities of the module include pro-viding mechanisms to model tasks and to construct, modify, save, and open processes; having scheduling algorithms and a resource model to support the enactments and allocation of tasks at the right time for the right reason by the right user through interactions with the data consistency maintenance module and users (via user interface); enabling users to visualize design or simula-tion processes on a local machine, and to check process informasimula-tion (e.g. who is doing what); and messages on tasks allocation to be sent to and stored in the message server module besides sending to users (via user interface) if they are on-line.
which contain information of data inconsistency, explanations and allocated tasks, and users should also be able to retrieve and delete messages from the message server.
User interface: The user interface is the “window” on the virtue platform that enables the in-teractions between users and the modules of the platform. The user interface provides users with information on allocated tasks; mechanisms to visualize processes and states of tasks (client side of process control module); means to visualize data dependency and to check data version in-formation (client side of data consistency maintenance module); inin-formation on data inconsis-tency and its explanation; methods to view and edit meta-data of inter-used data that is stored in a central database (the common model module); plug-ins, including optimization, visualization, and data mining; mechanisms for text, audio and video user communication; and information on users (e.g. users on-line, off-line).
[image:9.595.108.497.252.504.2]The resulting system architecture is shown in the following figure and many of the principles builds on an EU FP5 funded project, VRShips (VRS). A prototype system is being developed for evaluation in 2006 with a final prototype planned for delivery in 2008.
Figure 4.1: VIP system architecture design
5 CONCLUSION
Numerical simulation of fluid flow around ships and marine structures has a long tradition in Naval Architecture, dating back to the 19th century with some of the, rather clerical / classical, methods still in use today. More emphatically, advances in computer technologies alongside improved algorithms and extended theoretical basis over the past two decades have accelerated developments to such an extent that the dream of a complete “Numerical Towing Tank” or “Virtual Basin” is within reach today.
Current evaluation and interpretation of CFD ship design results are mostly based on intuition and experience of specialist users. An example is given in the paper that highlights the rising challenges and need for better visualisations and integrated multi-criteria optimisation. An inte-grated approach is required that can address the requirements for enhanced communications; process control and project management; integrated optimisation; the mining of data to support exploration, verification and validation of results; advanced integrated visualisations; data and consistency management; and a user friendly collaborative interface.
The VIP should ensure that generated and used data is consistent between the CFD tools in-volved, that changes and interactions between the tools are correctly propagated and that the simulations are undertaken in an organised manner. Multi-media collaborative design, across a number of designers working both on the same and different projects, as well as an integrated multi-criteria and multi-disciplinary optimisation toolkit, and advanced visualisations are re-quired to improve CFD ship design. A validation mechanism using experimental data should also be incorporated to enable comparison with calculated performance and evolution of simula-tion codes to produce and continually evolve more accurate and reliable predicsimula-tions. Specifi-cally the platform should include modules to administer and provide a means for users to regis-ter in the platform and to store, update and retrieve user information; to represent, model and manage data dependency relations and consistencies; to co-ordinate different design and simula-tion tasks that are carried out by different users; to facilitate effective communicasimula-tions; and to provide users with a “window” on the VIP to enable interactions with multiple users and the platform itself.
References
VIRTUE: The VIRtual Tank Utility in Europe, EU 6th Framework Programme in Sustainable develop-ment, global change and ecosystems, TIP5-CT-2005-516201, Jan 2005 to December 2009, http://www.virtual-basin.org/
Marzi, J. “Use of CFD methods for hullform optimisation in a model basin”, MARNET-CFD workshop, Haslar, 2003
Valdenazzi, F.; Harries, S.; Janson, C.-E.; Leer-Andersen, M.; Maisonneuve, J.-J.; Marzi, J.; Raven, H.: The FANTASTIC RoRo: CFD Optimisation of the Forebody and its Experimental Verification, Interna-tional Conference on Ship and Shipping Research - NAV 2003, Palermo, June 2003
Dudson, E.; Harries, S.: Hydrodynamic Fine-Tuning of a Pentamaran for High-Speed Sea Transportation Services, 8th International Conference on Fast Sea Transportation (FAST 2005), Saint Petersburg, June 2005
Harries, S.: Fundamentals of advanced hydrodynamic design, The Naval Architect, April 2006
Heimann, Justus: CFD Based Optimization of the Wave-Making Characteristics of Ship Hulls, Disserta-tion TU Berlin, Mensch & Buch Verlag, ISBN 3-89820-445-6, 2005
Harries, S.; Abt, C.; Hochkirch, K.: Modeling meets Simulation - Process Integration to improve Design, Sonderkolloquium zu Ehren der Professoren Hagen, Schlüter und Thiel, (Honorary colloquium for Prof. Hagen, Prof. Schlüter and Prof. Thiel), July 2004