PRAYOOT AKKARAEKTHALIN2, (Member, IEEE), IAN D. ROBERTSON 3, (Fellow, IEEE), AND NUTAPONG SOMJIT 3, (Senior Member, IEEE)
1Faculty of Applied Science, Department of Industrial Physics and Medical Instrumentation, King Mongkut’s University of Technology North Bangkok, Bangkok
10800, Thailand
2Faculty of Engineering, Department of Electrical and Computer Engineering, King Mongkut’s University of Technology North Bangkok, Bangkok 10800,
Thailand
3School of Electronic and Electrical Engineering, University of Leeds, Leeds LS2 9JT, U.K.
Corresponding author: Nutapong Somjit ([email protected])
This work was supported in part by the Thailand Research Fund and Office of the Higher Education Commission through the Research Grant for New Scholar under Grant MRG6280119, in part by the Thailand Research Fund through the Royal Golden Jubilee Ph.D. Program under Grant PHD/0056/2558, in part by the Thailand Research Fund through the TRF Senior Research Scholar Program under Grant RTA 6080008, and in part by the Engineering and Physical Sciences Research Council under Grant EP/S016813/1 and Grant EP/N010523/1.
ABSTRACT This paper introduces a novel free-space terahertz (THz) characterization setup featuring an electronic-based technique and miniature additive-manufactured hemispherical lens antennas. By using in-house custom-made hemispherical lenses, radiation characteristics of the electromagnetic (EM) wave of the measurement setup, e.g. the radiation pattern as well as the collimated and focused beam size of the THz beam, can be precisely predicted and synthesized by appropriately selecting the radius size of the lenses. This technique eases design and measurement setup complexity as compared to the existing conventional THz measurement setups without compromizing the measurement accuracy and reliability. To demonstrate the THz measurement setup developed in this paper, an asymptotically single-mode hollow Bragg fiber operating from 0.246 to 0.276 THz was characterized for its EM transmission properties. The measurement results characterized by this setup are in good agreements with the results obtained from the analytical study and a conventional free-space THz measurement system. The novel THz measurement technique was also characterized for its critical properties, e.g. reliability, repeatability, sensitivity, and accuracy, indicating that the setup can achieve highly accurate measurement quality while still offers various advantages compared to all other existing THz measurement setups such as ease of measurement that allows non-THz expert to setup, setup flexibility, cost-effectiveness, smaller required measurement space, less sensitivity to measurement environments, etc.
INDEX TERMS Free space measurement, terahertz measurement, hemispherical lens antenna.
I. INTRODUCTION
Terahertz (THz) technology has become very attractive for many engineering and scientific applications, e.g. material characterization [1]–[7], high-resolution imaging [8]–[15], and medical technologies [16]–[18], due to many various advantages over other technologies [19]–[22]. To evaluate figure-of-merits of any THz device, a THz characterization system with a good measurement accuracy is highly desired.
The associate editor coordinating the review of this manuscript and approving it for publication was Mohsen Khalily.
Apart from the measurement accuracy, cost-effectiveness and ease of setup are also important key parameters for the development of THz measurement and character-ization techniques. Generally, depending on the physical interaction between the device-under-test (DUT) and THz probes, THz measurement systems can be divided into two types, which are: 1) contact measurements using contact probes [2], [23]–[28] and 2) free-space or non-contact tech-niques [1], [3]–[8], [13]–[15], [19]–[21], [29]–[32].
is the THz characterization technique generally suitable for THz components fabricated using planar and on-chip technologies [23]–[28] such as sub-millimetre-wave mono-lithic integrated circuits (S-MMICs) and terahertz MMICs (T-MMICs) [27], [28]. The contact THz measurement tech-nology uses the same concepts normally employed in RF and microwave measurements by using high-frequency measure-ment extenders connected to a network analyser. The mea-surement setups can currently cover the THz frequency band ranging from 300 GHz to slightly more than 1.1 THz [27] depending on the contact probes and frequency extenders used in the measurements. However, contact measurements introduce a contact resistance at the physical interface loca-tions between the measurement probes and the DUT as well as other parasitic effects, which strongly affects measure-ment precision and accuracy, especially at THz frequencies. Additionally, contact measurements have limited operational life-cycles of the probes due to mechanical degradation of the mechanical contact areas over time. They are also very expensive and the physical contact force at the probe areas can easily cause fragility of the measurement probes, limiting their reusability.
Free-space measurements, widely used in characterising THz components [3]–[8], [13]–[15], [19]–[21], [29]–[32], are non-contact and use various types of antennas, e.g. horn antennas [7], [30], parabolic reflectors [7], [13]–[15], [20], [30]–[32] and planar antenna [3], [8] to transmit and guide THz test signals onto the input terminal of the DUT [3], [30]–[32] and receive the THz responses from its output. The free-space measurement technique elim-inates many limitations of the contact probe measurements, including limited probe lifetime, mechanical and electrical degradation of the contact surface due to the contact force and fragility issue. However, the system setups require many costly components, e.g. parabolic mirrors, reflectors and alignment tools, therefore; they are generally very compli-cated and require an experienced engineer or scientist to build a reliable setup. Depending on the power source used to gen-erate the THz signals [33]–[37], the free-space measurement techniques can be apparently categorised into: 1) laser-based and 2) electronic-based THz measurement setups.
The laser-based THz measurement setups generally use laser sources, e.g. quantum cascade laser (QCL), photocon-ductive antenna (PCA), electro-optical conversion (EOCs), uni-travelling-carrier photodiode (UTC-PDs), and photomix-ing, to generate high-power terahertz radiation with very broadband characteristics up to several THz. The laser-based measurement setup is normally very costly and inconvenient for setting up and performing a THz measurement since, for example, a cryogenic cooling system38 is generally required to stabilise the operational humidity and temperature of fem-tosecond laser sources used to control energy of the THz pulse to milli-joule scale. Additionally, special attention must be considered because, during measurements and measurement setups, there is a high-intensity laser signal from a laser source and a cooling liquid flow, e.g. helium or nitrogen,
which can be relatively dangerous if the measurements are not managed and performed properly.
The electronic-based THz measurement systems rely on electronic sources, e.g., backward wave oscillator, stimulated terahertz amplified radiation (STAR), and har-monic multiplying, which are widely used in THz imag-ing [8], [10]–[12], wafer testimag-ing [27], [28], and material characterization [2], [4]–[7] systems due to simplification and miniaturisation of the setups. The electronic-based systems combine various advantages from both close-proximity and laser-based measurements, for examples, no laser sources and cryogenic cooling systems are required while the setups use high-frequency extenders and network analysers, as in standard RF and microwave measurements, but without physical proximity between the DUT and other test com-ponents. However, electronic-based THz measurements are normally narrow band, due to frequency limitation of the high-frequency extenders, and still relatively complicated since many components and tools such as parabolic mir-rors, reflectors and comprehensive alignment positioners are required.
This paper presents a novel free-space electronic-based THz measurement setup featuring custom-made photopolymer-based hemispherical lens antennas fabricated by digital-light manufacturing process. The key concept in this work is to precisely define and synthesize EM propagation characteristics, especially the collimated and focused THz beam size at a required distance by appro-priately choosing the radius size of the three-dimensional (3D) lens structures. From this measurement concept, several advantages, as compare to all existing state-of-the-art THz measurement techniques, are achievable. The measurement setup developed in this work is relatively compact and uncomplicated since only two hemispherical lenses are used without any other additional components, e.g. horn antennas and parabolic mirrors, requiring no expert to build the setup as well as reducing environmental and setup errors. More-over, since the lens antennas can be simply designed and fabricated by using in-house cost-effective rapid-prototyping digital-light manufacturing process [39], the measurement setup can be swiftly custom-designed to match to any specific measurements at relatively low low-cost as com-pared to all existing conventional THz measurement setups. The THz measurement setup in this work was demonstrated by characterizing an asymptotically single-mode hollow Bragg fiber operating from 0.246 to 0.276 THz [30]. The measurement results are compared to the analytical and measurement results obtained from a conventional free-space measurement. Furthermore, accuracy, sensitivity, repeatabil-ity and reliabilrepeatabil-ity of the measurement setup developed in this work are characterized and discussed.
II. FREE-SPACE ELECTRONICS-BASED SETUPS
A. CONVENSIONAL FREE-SPACE MEASUREMENT SYSTEM
FIGURE 1. Illustration of various free-space electronic-based THz measurement setups. (a) conventional free-space measurement system, (b) nonconventional free-space measurement system and (c) measurement setup using hemispherical lenses.
conventional and nonconventional characterization systems with various tools and components required for measure-ments and directions of THz collimated beams used to mea-sure a DUT and the meamea-surement technique developed in this work. The basic measurement principle of the conventional free-space THz measurement system [30], [32] is depicted in Fig.1(a). In the setup, for a two-port DUT measurement, two rectangular-waveguide (RWG) high-frequency extenders are connected to a network analyzer and are used to generate (Tx) and receive (Rx) THz test signal for the measurement system. A horn antenna is mounted at each extender to define EM radiation properties of the collimated THz beam, e.g. radia-tion direcradia-tion, beam spot size and focal feed point, depending on characteristics of the antenna used in the setup such as half-power beamwidth, realised gain and etc. The radiated THz beam emitted from the horn antenna at Txextender is collimated and focused onto the DUT input port by a set of off-axis parabolic mirrors [7], [15], [30]–[32]. By using another set of parabolic mirrors, the THz responses from the output port of the DUT is directed and focused on to the horn antenna attached to the Rx frequency extender and further processed by a THz signal detector in the network analyzer. Therefore, the total measurement distance of the THz beam radiation depends on the required focused feed location and spot size of the beam at both Tx and Rx, which are in a very strong relationship with the radiation characteristics of the horn antennas, and, thus; large setup area would be required only for a single measurement. Additionally, both high-frequency extenders, all parabolic mirrors and the DUT are attached to the position-adjustable stages to achieve an accurate position and distant alignment with two auxiliary visible laser beams initially used to determine the focal point of each parabolic mirror.
B. NON-CONVENSIONAL FREE-SPACE MEASUREMENT SYSTEM
In the nonconventional free-space THz measurement [4]–[6], [30]–[32], as shown in Fig.1(b), a pair of high-frequency extenders and horn antennas are still used with the same functionalities as in the conventional techniques for two-port DUT measurements. The parabolic mirror at the Tx side is now used to direct and focus the THz collimated beam onto the input of the DUT through a hemispherical lens structured
fabricated by using high-resistivity silicon substrate [4]–[6]. Another parabolic mirror is used to direct and focus the THz responses from the output of the DUT to the Rxhorn antenna for further signal detection and interpretation. The hemi-spherical lens structure provides an advantage in even further focusing the THz collimated beam for both transmitted and received signals onto and from the DUT as compared to the conventional setup. However, the setup is generally very suit-able for only on-chip and planar component measurements since it requires a flat DUT surface to be attached to the base of the 3D lens structure to avoid a complicated EM boundary condition at the boundary interface.
C. FREE-SPACE MEASUREMENT WITH 3D DIELECTRIC LENS ANTENNA SYSTEM
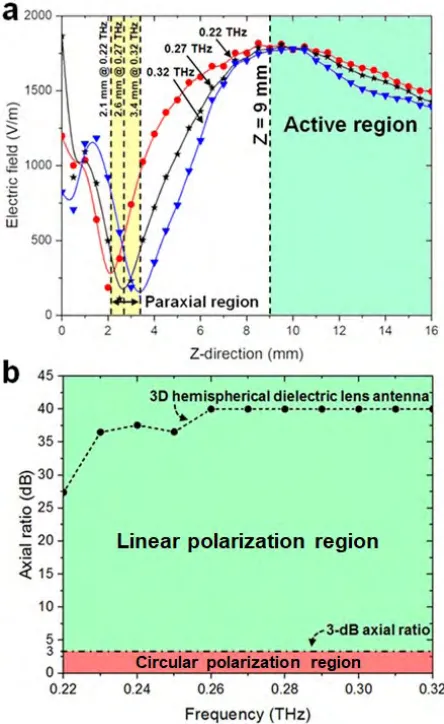
FIGURE 2. (a) Simulated electric-field intensity along the direction of propagation (z-direction) of the 3D hemispherical dielectric lens antenna. The electric fields are plotted at three frequencies, i.e., 0.22 (lower band), 0.27 (mid-band), and 0.32 THz (upper band), showing the paraxial and active regions highlighted in the yellow and green, respectively. The active region is recommended in the measurement setup. (b) Simulated axial ratio (AR) of the 3D hemispherical dielectric lens antenna at 0◦for the
whole frequency band. The linear and circular polarization regions are highlighted in the green and red, respectively. The axial ratio of 3D lens antennas in this work offer the linear polarization.
i.e., 0.22 (lower band), 0.27 (mid-band), and 0.32 THz (upper band), along the direction of propagation,z-direction, from 0 mm to 16 mm. The paraxial focus [40], [41], generated from the caustic rays of the 3D spherical surface of the lens structures and, thus, representing the lowest electric-field intensity, ranges from 2.1 to 3.4 mm on the z-axis for all frequencies of interest. Any distances along the direction of propagation falling within the paraxial region, shown in the yellow area in Fig. 2(a), must not be chosen as the separation distance between the hemispherical lens antennas and the input terminal of the DUT since no THz signal is coupled into the DUT. On the other hand, the maximum electric-field intensity is found at approximately 9 mm for all nominal frequencies, which is considered as the optimum separation distance for the best EM coupling between the lens antennas and the input port of the DUT. Practically, it is relatively
complicated to build a measurement setup with an exact separation distance, even by using a costly alignment system, e.g. three-axis laser-assisted and high-precision positioners. However, any distances between the DUT input and lens antenna slightly beyond the optimum point within the active region, shown in the green area in Fig. 2(a), are also accept-able, easing the requirement of accurate position alignment. The optimum distance between the DUT output and receiving lens antenna can be found by using the similar technique pre-viously mentioned by appropriately changing the separation distances, along the direction of THz radiation beam, from zero mm to slightly beyond the active region, by avoiding the paraxial zone, until the maximum signal transmission is shown on network analyzer.
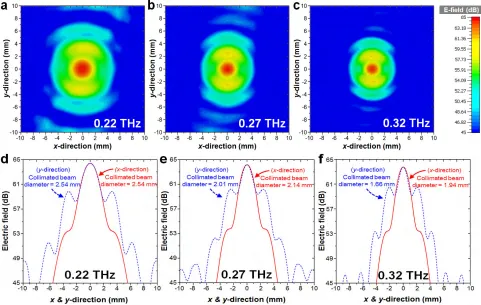
Fig. 2(b) plots the simulated axial ratio (AR) of the 3D hemispherical dielectric lens antenna over the whole WR-3 frequency band from 220 GHz to 320 GHz. From the simulation results, the hemispherical lens radiators have an AR of approximately from 27.5 to 40dB for the whole frequency band and, thus, the linear polarization of the collimated THz beam was used in the measurement sys-tem developed in this work. Figs. 3(a)–3(c) present contour plots of the simulated cross-sectional electric-field inten-sity of the collimated beam at the distance of 9mm for 0.22 THz (lower band), 0.27 THz (mid-band) and 0.32 THz (upper band), respectively. From the simulation results shown in Figs. 3(d)–3(f), the collimated beam spot sizes, calcu-lated at 3-dB beamwidth points, for 0.22 THz, 0.27 THz and 0.32 THz were approximately 2.54mm, 2.01–2.14mm and 1.66–1.94mm, respectively. As previously mentioned, the sizes of the collimated THz beam can be precisely predicted and synthesized during the design and simula-tion process of the hemispherical lens by selecting the appropriate dimensions of the lens antennas used in the measurement setup.
III. EXPERIMENTAL RESULTS
A. CONVENTIONAL FREE-SPACE MEASUREMENT SETUP
FIGURE 3. Simulation results of the cross-sectional electric-field intensity plotted in perpendicular to the direction of the THz propagation, on the x-y-plane in thez-direction (Fig. 7), at 9 mm of the 3D hemispherical dielectric lens antenna. The electric fields are plotted at three frequencies, i.e., (a) 0.22 THz (lower band), (b) 0.27 THz (mid-band) and (c) 0.32 THz (upper band) with the corresponding collimated beam characteristics for: (d) 0.22 THz (lower band), (e) 0.27 THz (mid-band) and (f) 0.32 THz (upper band), respectively.
FIGURE 4. Asymptotically single-mode Bragg fiber. (a) cross-sectional view of the fiber, (b) fabricated prototypes with two different lengths of 30 mm and 100 mm and (c) Conventional measurement system used in [30].
visible laser alignment systems were used to determine the focal points of the parabolic mirrors as well as to accurately align all measurement components in the setup. By using
this setup, the THz signal is firstly generated from the high-frequency extender and radiated from the WR-3 conical horn antenna. The radiated THz beam was guided and controlled for its precise direction and radiation characteristics by using two parabolic mirrors. The Bragg fiber was placed at the focal point of the second parabolic mirror to ensure that a colli-mated THz beam was appropriately coupled into the input terminal of the THz fiber. At the output terminal of the fiber, a THz signal was radiated out and subsequently received by using the conical horn antenna connected to the WR-3 high-frequency extender at the output side of the measurement setup. The intensive conventional free-space setup used to characterize the propagation properties of the Bragg fiber was recently published by the authors in [30].
B. FREE-SPACE MEASUREMENT SETUP WITH 3D DIELECTRIC LENS ANTENNA
[image:5.576.40.268.437.637.2]FIGURE 5. Free-space measurement setup procedure developed in this work. (a) The first visible laser was used to align two extender heads in y-direction, (b) the second visible laser was used to align two extender heads inx-direction. and (c) The Bragg fiber was placed in the system and the third visible laser was used to align the core of the Bragg fiber to the center of the both extender heads.
were placed on the movable stages, which are located on an optical bench to protect any vibration caused by the envi-ronment. The alignment setup procedure of the free-space measurement developed in this work, which are shown in Fig. 5, consist of the following steps:
1. From Fig.5(a), the first visible laser was used to align they-direction of two extender heads.
2. From Fig.5(b), the second visible laser was used to align inx-direction to get the maximum power from transmitter to receiver extender.
3. As shown in Fig.5(c), the Bragg fiber were placed on the top of the sample holder. The third visible lasers were used to align the core of the Bragg fiber to the center of the extender head by adjusting the movable sample holder in x-direction and y-direction.
[image:6.576.41.274.67.261.2]When completing the alignment, two 3D printed lens antennas were mounted on the both open-ended of the WR-3 RWGs. To control the distance between the Bragg fiber and transmitted 3D printed lens antenna inz-direction, the 3-Axis RollerBlock was used to adjust the distance in micrometer-scale. The fully measurement setup of proposed system were shown in Fig.6. The distance between the Bragg fiber and transmitted 3D printed lens antenna was fixed at 9 mm to reduce the effect of the paraxial region of the lens antenna as described in Section ‘‘Free-space measurement with 3D dielectric lens antenna system’’. The received 3D printed lens antenna was placed at the output end of the Bragg fiber, similar to the previous work [30]. For VNA setup, the intermediate frequency (IF) bandwidth of the proposed measurement setup was set to 10 Hz, the smoothing fac-tor was 3%, and 231 frequency points were used to record the data in the frequency range from 0.246 to 0.276 THz.
FIGURE 6. Measurement setup developed in this paper. Two 3D-printed lens antennas were mounted on the both open-ended sides of the WR-3 RWGs and the Bragg fiber was fixed on top of the sample holder. The optimum distance between the transmitting lens antenna and the input terminal of the Bragg fiber was 9 mm.
The full measurement and analysis procedure consist of the following steps:
1. Measure the transmission coefficientS21of the length of 30 mm Bragg fiber.
2. Measure the transmission coefficientS21of the length of 100 mm Bragg fiber.
3. Use the cut-back calibration method to calculate the propagation loss of the Bragg fiber structure.
C. MEASUREMENT RESULTS
To evaluate the measurement setup developed in this work, two asymptotically single-mode Bragg fibers with different lengths of 30 mm and 100 mm operating from 0.246 to 0.276 THz were characterized for their EM propagation characteristics, which were subsequently compared to both analytical and measurement results, characterized by using the conventional free-space setup, reported in our previ-ously published work [30]. Figs.4(a) and 4(b) show the cross-sectional sketch and fabricated prototypes of the asymptotically single-mode Bragg fibers, respectively, whilst Fig.4(c) depicts the conventional free-space measurement setup [30] used to characterize the THz fibers.
The free-space loss (FSL) between the lens antenna and the input aperture of the Bragg fiber is analytically calculated using the Friis transmission formula based on the actual measurement setup used in this work. The FSLs at lower, mid-band and upper frequencies, e.g., 220 GHz, 270 GHz and 320 GHz, are 38.37 dB, 40.15 dB and 41.63 dB, respec-tively. The calculated propagation loss without the Bragg fiber is 0.13 dB/mm. The propagation loss characteristics of the THz fibers obtained from each different measurement setup, shown in Fig. 7, were extracted using the cut-back calibration method for the nominal frequency band and are compared to the analytical results. Over the whole operational frequencies from 0.246 to 0.276 THz, the average difference of the THz propagation loss between the technique developed in this work and analytical results is 16.64% whilst the con-ventional setup achieves the difference of 11.92% compared to the analytical results.
FIGURE 7. Comparisons of the propagation loss characteristics of asymptotically single-mode Bragg fiber.
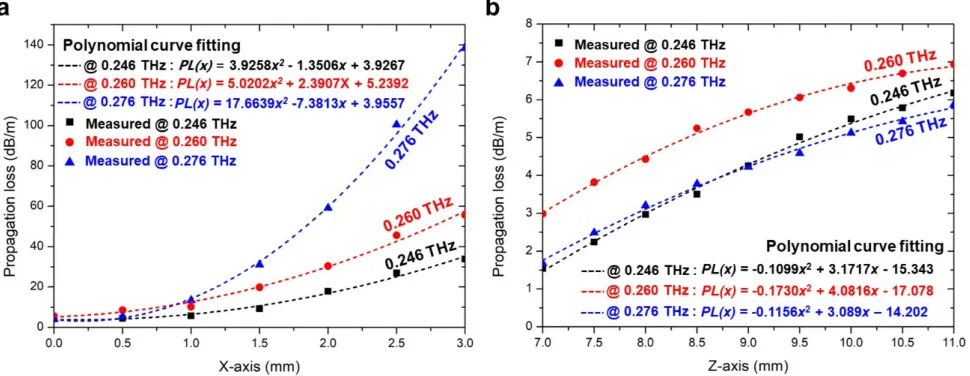
FIGURE 8. Measured propagation loss of the THz Bragg fiber for off-axis (x-direction) and on-axis (z-direction) misalignments. (a) Propagation loss from misalignments along thex-axis and (b) propagation loss from misalignments along thez-axis.
attempts of the EM propagation loss of the Bragg fiber were conducted. All measurement results were averaged and the standard deviation of 0.219 was calculated for the whole nominal frequency band from 0.246 to 0.276 THz. Subse-quently, the average propagation loss characteristics were compared to both analytical calculations and measurement results obtained from the conventional free-space setup previ-ously published by the authors. The THz loss characteristics measured in this work have good agreements compared to the results from both analytical calculation and conventional free-space measurement setup with accuracies of at least 83.36% and 88.08%, respectively.
Sensitivity:Misalignments between both input and output terminals of the Bragg fiber and the 3D-printed lens antenna for both off-axis and along the axis of the collimated beam were used to determine the sensitivity of the measurement setup. For the off-axis measurement, as shown in Fig.5(c), the Bragg fiber mounted on top of the fiber holder was moved along the off-axis direction, x-axis, by using a three-axis
[image:7.576.46.531.265.453.2]TABLE 1. Key parameter comparisons between different THz measurement setups.
with a standard deviation of 0.187. The measurement sensitivity for the off-axis,x-direction, was derived from the slope of the non-linear transfer function of the propagation loss characteristics, which were plotted in Fig.8(a) for three different frequencies, i.e. 0.246 THz (lower band), 0.260 THz (mid-band) and 0.276 THz (upper band). From the plot, the slope of the loss characteristic and the rate of change of the slope are much higher at high frequency, meaning that high frequency is much more sensitive to thex-distance error compared to low frequency due to the shorter wavelengths at higher frequencies. By using a curve fitting software, Origin, the propagation loss characteristic as the function of off-axis distances of each frequency can be fitted.
At 0.246 THz (lower band):
PL(x)=3.9258x2−1.35061x+3.9267. (1)
At 0.260 THz (mid-band):
PL(x)=5.0202x2+2.3907X+5.2392. (2)
At 0.276 THz (upper band):
PL(x)=17.6639x2−7.3813x+3.9557. (3)
wherePL(x)is the propagation loss in dB/m as a function of the distance change inx-direction (off-axis),x, mm.
For the on-axis sensitivity measurement, as also shown in Fig.5(c), the Bragg fiber was moved along the axis of the radiated collimated beam, z-axis, from the initial stage of z = 9mm, where the maximum electric-field intensity was achieved, to z = 7mm andz = 10mm, respectively. The step size of thez-direction changes,1z, of 0.5mm, accurately controlled by the three-axis positioner assisted by the visible laser alignment system, was chosen. The positions on bothx andyaxes were kept constant atx = 0mm andy = 0mm during the measurement to ensure the perfect x andy-axis alignment between the input and output terminals of the fiber and the 3D lens antennas. All propagation characteristics, i.e. S-parameters, were measured and recorded after each distance change along the z-axis. At least three sensitivity measurements along thez-directions were attempted and the
results were averaged and the standard deviation of 0.302 was calculated. Fig.8(b) plots the average propagation loss of the Bragg fiber at the on-axis distances of interest from z =
7mm toz = 11mm at 0.246 THz (lower band), 0.260 THz (mid-band) and 0.276 THz (upper band). The slope of each plot determines the sensitivity of each frequency in compar-ison with the on-axis distances. By consideringz = 9mm as the boundary between paraxial and active regions, it is noticeable that the slope of the plotted curve in the paraxial region is higher than the one in the active region, meaning that the measurement results were less sensitive to thez-distance error in the active region for the same signal frequency. The propagation loss characteristic as the function ofz-axis distances of each frequency can be fitted for each frequency of interest.
At 0.246 THz (lower band):
PL(x)= −0.1099x2+3.1717x−5.343. (4)
At 0.260 THz (mid-band):
PL(x)= −0.1730x2+4.0816x−17.078. (5)
At 0.276 THz (upper band)
PL(x)= −0.1156x2+3.0890x−4.2022. (6)
wherePL(x)is the propagation loss in dB/m as a function of the distance change inx-direction,x, mm.
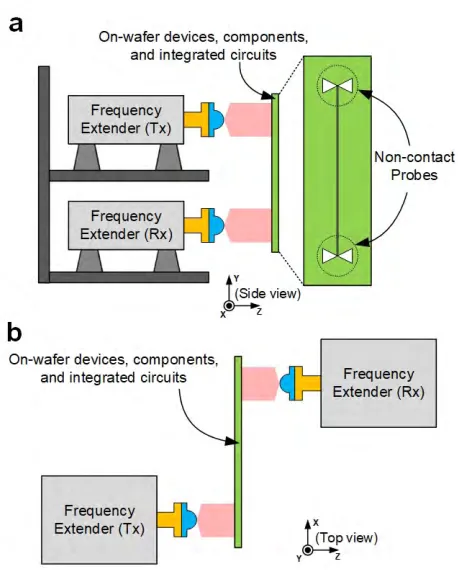
FIGURE 9. On-wafer THz-frequency measurement. (a) The transmitted and received antenna were placed on the same side and(b) the transmitted and received antenna were placed on the opposite side and the wafer-under-test was mounted between both lens antennas.
3D-printed hemispherical lens antennas developed in this work with other published works, [3], [8], [13], [23], and [30].
IV. CONCLUSIONS
A novel free-space THz measurement setup featuring an electronic-based technique and miniature additive-manufactured hemispherical lens antennas was introduced in this paper. By using lens antennas, the requirements of using many components e.g. parabolic mirrors to synthesize colli-mated beam radiated from the transmitter and to the receiver can be completely eliminated, easing the measurement setup procedure. Since the measurement concepts used in the setup features standard RF and microwave measurement tech-nique, the setup developed in this paper is compatible with standard high-frequency electronic circuit and component measurement. Moreover, since the THz source used in the setup is based on high-frequency electronic systems, there is no requirement on cooling mechanism using liquid nitro-gen or helium as in the conventional laser-based measure-ment setups. From the measuremeasure-ment demonstration, the THz characterization setup developed in this work has a good measurement agreement compared to the conventional free-space measurement and analytical calculation. Furthermore, the measurement setup also offers excellent figure-of-merit in terms of reliability, sensitivity, accuracy and repeatability. Even the free-space THz measurement setup developed in this work is very attractive to be used as an alternative
REFERENCES
[1] H. Song, S. Hwang, and J.-I. Song, ‘‘Optical frequency switching scheme for a high-speed broadband THz measurement system based on the pho-tomixing technique,’’Opt. Express, vol. 25, no. 10, pp. 11767–11777, May 2017.
[2] A. Kazemipour, M. Hudlicka, S.-K. Yee, M. A. Salhi, D. Allal, T. Kleine-Ostmann, and T. Schrader, ‘‘Design and calibration of a compact quasi-optical system for material characterization in millime-ter/submillimeter wave domain,’’IEEE Trans. Instrum. Meas., vol. 64, no. 6, pp. 1438–1445, Jun. 2015.
[3] N. Duangrit, B. Hong, A. D. Burnett, P. Akkaraekthalin, I. D. Robertson, and N. Somjit, ‘‘Terahertz dielectric property characterization of photopolymers for additive manufacturing,’’ IEEE Access, vol. 7, pp. 12339–12347, 2019.
[4] C. Caglayan, G. C. Trichopoulos, and K. Sertel, ‘‘Non-contact probes for on-wafer characterization of sub-millimeter-wave devices and inte-grated circuits,’’ IEEE Trans. Microw. Theory Tech., vol. 62, no. 11, pp. 2791–2801, Nov. 2014.
[5] C. Caglayan and K. Sertel, ‘‘Noncontact on-wafer characterization of differential-mode millimeter- and submillimeter-wave devices and inte-grated circuits,’’IEEE Trans. Microw. Theory Techn., vol. 64, no. 11, pp. 3911–3917, Nov. 2016.
[6] C. Caglayan and K. Sertel, ‘‘Experimental analysis of repeatability and calibration residuals in on-wafer non-contact probing,’’ IEEE Trans. Microw. Theory Techn., vol. 65, no. 6, pp. 2185–2191, Jun. 2017.
[7] D. Armand, H. Taniguchi, Y. Kadoya, T. Tanaka, and K. Tanaka, ‘‘Ter-ahertz full horn-antenna characterization,’’Appl. Phys. Lett., vol. 102, no. 14, p. 141115, Apr. 2013.
[8] H. Song, S. Hwang, H. An, H.-J. Song, and J.-I. Song, ‘‘Continuous-wave THz vector imaging system utilizing two-tone signal generation and self-mixing detection,’’Opt. Express, vol. 25, no. 17, pp. 20718–20726, Aug. 2017.
[9] D. Wang, B. Li, L. Rong, Z. Xu, Y. Zhao, J. Zhao, Y. Wang, and C. Zhai, ‘‘Extended depth of field in continuous-wave terahertz computed tomography based on Bessel beam,’’Opt. Commun., vol. 432, pp. 20–26, Feb. 2019.
[10] P. Dean, ‘‘Terahertz imaging using quantum cascade lasers—A review of systems and applications,’’J. Phys. D, Appl. Phys., vol. 47, no. 37. Aug. 2014, Art. no. 374008.
[11] A. Bonifac, I. Gusachenko, K. Dholakia, and S. Gigan, ‘‘Rapid broad-band characterization of scattering medium using hyperspectral imaging,’’
Optica, vol. 6, no. 3, pp. 274–279, Mar. 2019.
[12] Y. L. Lim, K. Bertling, T. Taimre, T. Gillespie, C. Glenn, A. Robinson, D. Indjin, Y. Han, L. Li, E. H. Linfield, A. G. Davies, P. Dean, and A. D. Rakic, ‘‘Coherent imaging using laser feedback interferometry with pulsed-mode terahertz quantum cascade lasers,’’Opt. Express, vol. 27, no. 7, pp. 10221–10223, Apr. 2019.
[13] N. Karpowicz, H. Zhong, J. Xu, K.-I. Lin, J.-S. Hwang, and X.-C. Zhang, ‘‘Comparison between pulsed terahertz time-domain imaging and contin-uous wave terahertz imaging,’’Semicond. Sci. Technol., vol. 20, no. 7, pp. 293–299, Jun. 2005.
[14] H. Huang, D. Wang, L. Rong, S. Panezai, D. Zhang, P. Qiu, L. Gao, H. Gao, H. Zheng, and Z. Zheng, ‘‘Continuous-wave off-axis and in-line terahertz digital holography with phase unwrapping and phase autofocusing,’’Opt. Commun., vol. 426, pp. 612–622, Nov. 2018.
[16] Q. Tang, M. Liang, Y. Lu, P. K. Wong, G. J. Wilmink, D. D. Zhang, and H. Xin, ‘‘Microfluidic devices for terahertz spectroscopy of live cells toward lab-on-a-chip applications,’’ Sensors, vol. 16, no. 4, p. 476, Apr. 2016.
[17] G. G. Hernandez-Cardoso, S. C. Rojas-Landeros, M. Alfaro-Gomez, A. I. Hernandez-Serrano, I. Salas-Gutierrez, E. Lemus-Bedolla, A. R. Castillo-Guzman, H. L. Lopez-Lemus, and E. Castro-Camus, ‘‘Terahertz imaging for early screening of diabetic foot syndrome: A proof of concept,’’Sci. Rep., vol. 7, Feb. 2017, Art. no. 42124.
[18] A. Stylianou and M. A. Talias, ‘‘Nanotechnology-supported THz medical imaging,’’F1000Research, vol. 2, p. 100, Mar. 2013.
[19] A. J. L. Adam, ‘‘Review of near-field terahertz measurement meth-ods and their applications,’’ J. Infr., Millim., THz Waves, vol. 32, nos. 8–9, pp. 976–1019, Jul. 2011.
[20] J. Li, K. Nallappan, H. Guerboukha, and M. Skorobogatiy, ‘‘3D printed hollow core terahertz Bragg waveguides with defect layers for surface sens-ing applications,’’Opt. Express, vol. 25, no. 4, pp. 4126–4144, Feb. 2017. [21] S. Krimi, J. Klier, J. Jonuscheit, G. von Freymann, R. Urbansky, and R. Beigang, ‘‘Highly accurate thickness measurement of multi-layered automotive paints using terahertz technology,’’Appl. Phys. Lett., vol. 109, no. 2, Jun. 2016, Art. no. 021105.
[22] M. Tonouchi, ‘‘Cutting-edge terahertz technology,’’Nature Photon., vol. 1, pp. 91–105, Feb. 2007.
[23] T. J. Reck, L. Chen, C. Zhang, A. Arsenovic, C. Groppi, A. Lichtenberger, R. M. Weikle, and N. S. Barker, ‘‘Micromachined probe for submillimeter-wave on-wafer measurements—Part I: Mechanical design and charac-terization,’’IEEE Trans. THz Sci. Technol., vol. 1, no. 2, pp. 349–356, Nov. 2011.
[24] T. J. Reck, L. Chen, C. Zhang, A. Arsenovic, C. Groppi, A. Lichtenberger, R. M. Weikle, and N. S. Barker, ‘‘Micromachined probes for submillimeter-wave on-wafer measurements—Part II: RF design and characterization,’’IEEE Trans. THz Sci. Technol., vol. 1, no. 2, pp. 349–356, Nov. 2011.
[25] L. Chen, C. Zhang, T. J. Reck, A. Arsenovic, M. Bauwens, C. Groppi, A. W. Lichtenberger, R. M. Weikle, and N. S. Barker, ‘‘Terahertz micro-machined on-wafer probes: Repeatability and reliability,’’IEEE Trans. Microw. Theory Techn., vol. 60, no. 9, pp. 2894–2902, Sep. 2012. [26] M. F. Bauwens, N. Alijabbari, A. W. Lichtenberger, N. S. Barker, and
R. M. Weikle, ‘‘A 1.1 THz micromachined on-wafer probe,’’ inIEEE MTT-S Int. Microw. Symp. Dig., Tampa, FL, USA, Jun. 2014, pp. 1–4.
[27] S. L. Rumyantsev, A. Muraviev, S. Rudin, G. Rupper, M. Reed, J. Suarez, and M. Shur ‘‘Terahertz beam testing of millimeter wave monolithic integrated circuits,’’IEEE Sensors J., vol. 17, no. 17, pp. 5487–5491, Sep. 2017.
[28] W. Deal, X. B. Mei, K. M. K. H. Leong, V. Radisic, S. Sarkozy, and R. Lai, ‘‘THz monolithic integrated circuits using InP high electron mobility tran-sistors,’’IEEE Trans. THz Sci. Technol., vol. 1, no. 1, pp. 25–32, Sep. 2011. [29] B.-J. Wen, T.-A. Liu, H.-C. Yu, S.-F. Chen, and Y.-C. Cheng, ‘‘Non-contact resistance measurement of transparent electrodes deposited on flexible display substrates under repetitive bending test by terahertz time domain spectroscopy,’’Displays, vol. 45, pp. 58–62, Dec. 2016.
[30] B. Hong, M. Swithenbank, N. Greenall, R. G. Clarke, N. Chudpooti, P. Akkaraekthalin, N. Somjit, J. E. Cunningham, and I. D. Robertson, ‘‘Low-loss asymptotically single-mode THz Bragg fiber fabricated by digital light processing rapid prototyping,’’IEEE Trans. THz Sci. Technol., vol. 8, no. 1, pp. 90–99, Jan. 2018.
[31] J. Yang, J. Zhao, C. Gong, H. Tian, L. Sun, P. Chen, L. Lin, and W. Liu, ‘‘3D printed low-loss THz waveguide based on Kagome photonic crystal structure,’’Opt. Express, vol. 24, no. 20, pp. 22454–22460, Oct. 2016. [32] Z. Wu, W.-R. Ng, M. E. Gehm, and H. Xin, ‘‘Terahertz electromagnetic
crystal waveguide fabricated by polymer jetting rapid prototyping,’’Opt. Express, vol. 19, no. 5, pp. 3962–3972, Feb. 2011.
[33] L. Angrisani, ‘‘THz measurement systems,’’ inNew Trends and Develop-ments in Metrology. Rijeka, Croatia: InTech, Jul. 2016, pp. 21–48. [34] T. Nagatsuma, A. Kaino, S. Hisatake, K. Ajito, H.-J. Song, A. Wakatsuki,
Y. Muramoto, N. Kukutsu, and Y. Kado, ‘‘Continuous-wave terahertz spectroscopy system based on photodiode,’’PIERS Online, vol. 6, no. 4, pp. 390–394, 2010.
[35] B. Khani, Y. Hu, V. Rymanov, C. Brenner, M. Hofmann, and A. Stöhr, ‘‘Compact optoelectronic continuous wave terahertz spectroscopy system (230-400 GHz) for paper sorting and characterization,’’ inProc. Eur. Conf. Lasers Electro-Opt., Munich, Germany, Jun. 2017, p. CC_P_3.
[36] C. W. Berry, M. R. Hashemi, S. Preu, H. Lu, A. C. Gossard, and M. Jarrahi, ‘‘Plasmonics enhanced photomixing for generating quasi-continuous-wave frequency-tunable terahertz radiation,’’ Opt. Lett., vol. 39, no. 15, pp. 4522–4524, Aug. 2014.
[37] B. Sartorius, D. Stanze, T. Göbel, D. Schmidt, and M. Schell, ‘‘Continuous wave terahertz systems based on 1.5µm telecom technologies,’’J. Infr., Millim., THz Waves, vol. 33, no. 4, pp. 405–417, Apr. 2012.
[38] C. Sirtori, S. Barbieri, and R. Colombelli, ‘‘Wave engineering with THz quantum cascade lasers,’’Nature Photon., vol. 7, pp. 691–701, Sep. 2013. [39] N. Chudpooti, N. Duangrit, P. Akkaraekthalin, I. D. Robertson, and N. Somjit, ‘‘220-320 GHz hemispherical lens antennas using digital light processed photopolymers,’’IEEE Access, vol. 7, pp. 12283–12290, 2019. [40] M. Avendaño-Alejo, L. Castañeda, and I. Moreno, ‘‘Properties of caustics produced by a positive lens: Meridional rays,’’J. Opt. Soc. Amer. A, Opt. Image Sci., vol. 27, no. 10, pp. 2252–2260, Oct. 2010.
[41] M. Avendaño-Alejo, D. González-Utrera, and L. Castañeda, ‘‘Caustics in a meridional plane produced by plano-convex conic lenses,’’J. Opt. Soc. Amer. A, Opt. Image Sci., vol. 28, no. 12, pp. 2619–2628, Dec. 2011.
NONCHANUTT CHUDPOOTI (S’16–M’18) received the B.Sc. degree (Hons.) in industrial physics and medical instrumentation and the Ph.D. degree in electrical engineering from the King Mongkut’s University of Technology North Bangkok, in 2012 and 2018, respectively, where he was appointed as a Lecturer with the Depart-ment of Industrial Physics and Medical Instru-mentation, Faculty of Applied Science, in 2018. His main research interests include the applica-tion of microwave microfluidic sensors, millimeter-wave substrate inte-grated circuit applications, and substrate inteinte-grated waveguide applications. He was a recipient of the Best Presentation Award from the Thailand–Japan Microwave, in 2015 and 2018, and the Young Researcher Encouragement Award, in 2016.
NATTAPONG DUANGRIT was born in
Chiangmai, Thailand, in 1991. He received the B.Eng. degree from the Rajamangala Univer-sity of Technology Thanyaburi, in 2014. He is currently pursuing the Ph.D. degree with the King Mongkut’s University of Technology North Bangkok. His Ph.D. was supported by the Thai-land Research Fund through the Royal Golden Jubilee Ph.D. Program. His main research interests include the application of 3D printing technology for millimeter-wave and THz devices and substrate integrated waveguide applications.
he established the Microwave Systems Research Group and was a Founding Member of the Advanced Technology Institute. In 2004, he was appointed to the Centenary Chair in Microwave and Millimetre-Wave Circuits, University of Leeds. He was the Director of learning and teaching, from 2006 to 2011, and the Head of the school, from 2011 to 2016. Dr. Robertson was the General Technical Programme Committee Chair of the European Microwave Week, in 2011 and 2016.