Int. J. Electrochem. Sci., 14 (2019) 4852 – 4860, doi: 10.20964/2019.05.23
International Journal of
ELECTROCHEMICAL
SCIENCE
www.electrochemsci.org
Determination of Gallic Acid in Tea by a Graphene Modified
Glassy Carbon Electrode
Meifeng Chen, Huiping Lv, Xia Li, Zhilong Tian, Xinying Ma*
College of Chemistry and Chemical Engineering, Heze University, Shandong, Heze274015, China *E-mail: hezexueyuanhx@163.com
Received: 24 December 2018 / Accepted: 21 February 2019 / Published: 10 April 2019
The determination of gallic acid (GA) content by a graphene modified glassy carbon electrode (graphene/GCE) was studied. The electrochemical behavior of GA on this electrode was studied by cyclic voltammetry (CV), and the standard curve was constructed by differential pulse voltammetry (DPV). The results indicate that graphene has a good catalytic effect on GA in phosphate buffer (PBS) and shows a linear response toward GA in the 8.0×10⁻⁸ to 2.0×10⁻⁵ mol•L−1 concentration range. The detection limit is 1.2×10⁻⁹ mol•L−1. This proposed determination for GA on graphene/GCE was carried out in the presence of potentially interfering compounds such as sorbic acid, tartaric acid, ascorbic acid and glucose. The content of GA in green tea was determined by this method, and the recovery was 97.9% - 100.6% with satisfactory results.
Keywords: Gallic acid; Differential pulse voltammetry; Graphene; Electrochemical determination
1. INTRODUCTION
[image:1.596.256.339.672.746.2]Gallic acid (GA), 3, 4, 5-trihydroxybenzoic acid (Figure 1), is a type of phenolic acid. It can be found in many plants such as tea leaves, gallnuts, sumac, etc. [1, 2]. GA is not only a raw material used in industry (such as in tanning, ink dyes and manufacturing of paper) but it is also widely used in the food and pharmaceutical industry due to its broad range of bioactivities and pharmacological activities, including anti-inflammatory, antihistaminic and antitumor activities [3,4]. Therefore, this study for quantitative determination of GA in food and medicine is necessary.
In the past few years, some techniques have been used successfully for the determination of GA in different samples, for example, HPLC [5, 6], high-performance thin-layer chromatography [7], the pulse perturbation technique [8], electrochemical sensors and nanosensors [9-17]. Electrochemical techniques have focused more attention on the electrochemical oxidation of hydroxyl groups. The direct electrochemical oxidation of GA is also possible.
Nanosensors have attracted attention because they are reliable, ultrasensitive and low cost, especially for drug and food analysis [18, 19]. Compared to other nanosensors, graphene has been widely
used as an electrode material because of its unique
electrochemical properties and important technological applications. A graphene modified glassy carbon electrode (grapheme / GCE) is simple to make, reusable, and inexpensive to prepare [18, 19]. Although several electrochemical methods have been developed for GA determination, to the best of our knowledge, GA determination by graphene/GCE has not been reported.
In this work, the analysis of GA by an electrochemical sensor based on graphene is described. The results indicate that graphene has a good catalytic effect on GA in PBS. This sensor is selective for GA even in the presence of some potentially interfering compounds. The modified graphene / GCE is highly reproducible, stable and sensitive, which indicates that it has promise for novel applications in the detection of GA in tea samples.
2. EXPERIMENTAL INFORMATION
2.1 Apparatus and reagents
Voltammetry measurements were carried out using CHI660D electrochemical work stations (Shanghai Chenhua Instrument Co., Ltd., Shanghai, China). The three-electrodes used in the electrochemical experiments are the graphene / GCE used as a working electrode, the saturated Ag/AgCl electrode and a Pt wire, which is used as a reference and counter electrode. The ultrasonic cleaner (Kunshan, China) is the KH-100DB, and the pH of the solution was adjusted by using a pH meter (module PHS-3B, Shanghai, China). Agilent1220 HPLC system was used. A quartz subboiling high-purified water distiller (SYZ-550) (Jiangsu, China) was also used.
2.2 Preparation of the graphene / GCE
Before modification, GCE was polished carefully with a polishing cloth and suspension of alumina slurry. Then, GCE was rinsed with nitric acid (volume ratio 1:1), absolute ethanol and distilled water in an ultrasonic bath for 1 min, respectively. A specific amount of graphene suspension droplets were dropped on the surface of the electrode by a micropipette. After drying under an infrared lamp, the graphene modified electrode was obtained. The graphene modified electrode can be used for multiple determinations by scanning in PBS (pH=3.0).
2.3 Experimental methods
Electrochemical experiments were carried out by a typical three-electrode system connected to the CHI660D. Cyclic voltammetry (CV) or differential pulse voltammetry (DPV) methods are used to study the electrochemical test of GA. The scanning curve was recorded when the electrode was immersed in the measured liquid. After each scan, the electrode was placed in PBS (pH=3.0) and scanned until the peak was no longer detected and stored for the next use.
3. RESULTS AND DISCUSSION
3.1The amount of graphene
The thickness of graphene on the surface of GCE has a great influence on the determination of GA. Graphene / GCEs were prepared on GCE by removing 1-10μL graphene (0.5 mg•mL−1) with a liquid pipette The experimental results for the determination of GA under the same conditions showed that the oxidation peak current (ipa) of GA increased with an increase in volume in the range of 1 to 5 μL, and the peak decreased with an increase in concentration in the range of more than 5μL. This result may be due to an increase in the number of reaction sites on the surface of GCE, as the electron transfer rate and the reaction sensitivity increased. On the other hand, a continuous increase of the concentration results in a thicker graphene coating, and hindered electronic transmission, increased difficulty in substrate diffusion to the surface of the electrode, and decreased oxidation peak current was observed. This is consistent with the provisions publication [21].
3.2 Study of the electrochemical behavior of GA
observed from graphene / GCE (curve c). The results showed that peak current improved significantly, suggesting that the graphene / GCE provided large surface area and enhancing the peak current for the detection of GA.
-0.6 -0.4 -0.2 0.0 0.2 0.4 0.6 0.8 1.0 1.2 1.4 -160 -140 -120 -100 -80 -60 -40 -20 0 20 40 60 80 100 c b a i / A
[image:4.596.208.391.132.269.2]E / V
Figure 2. Cyclic voltammograms (CVs) of (a) bare GCE and (c) graphene / GCE with 8×10⁻⁶ mol·L-1
GA in PBS (pH=3.0). Cyclic voltammogram of (b) graphene / GCE without GA in PBS (pH=3.0).
3.3 Optimum Conditions for the Determination of GA 3.3.1 Optimal pH
Figure 3 shows CVs for the determination of GA in different pH solutions under the same conditions with scanning rate of 0.1 V·S-1 after 25 s. The results show that the oxidation peak potential of GA decreased with an increase in pH [16]. The linear equation is Epa=0.91-0.10 pH, R=0.9976, which indicates that the reaction on the modified electrode involves protons. We can further see that the oxidation peak current reached its maximum value at pH=3.0, so a pH of 3.0 was selected for this experiment.
-0.8 -0.6 -0.4 -0.2 0.0 0.2 0.4 0.6 0.8 1.0 1.2 1.4 -160 -140 -120 -100 -80 -60 -40 -20 0 20 40 60 80 100
2 3 4 5 6 7 8
0.1 0.2 0.3 0.4 0.5 0.6 0.7 0.8 i / A pH g a i / A
[image:4.596.196.402.526.696.2]E / V
Figure 3. CVs of 8×10⁻⁶ mol·L-1 GA at a graphene / GCE at different pH. Insert is linear relationship
3.3.2 Optimum Scanning Rate
The oxidation peak current of GA increased with an increase in scanning rate (Figure 4). The oxidation peak current of GA (ipa) has a linear relationship with the scanning rate (Insert of Figure 4), as shown in equation: ipa=4.17×10⁻⁶+2.23v (V·S-1), and the correlation coefficient is R=0.9973. This demonstrates that the oxidation of GA is an adsorption-controlled process [22] on the graphene/GCE. With an increase in the scanning rate, the peak deformation was poor, and the sensitivity was reduced. Therefore, a scanning rate of 0.1 V·S-1 was selected for further studies.
-0.8 -0.6 -0.4 -0.2 0.0 0.2 0.4 0.6 0.8 1.0 1.2 1.4 -250
-200 -150 -100 -50 0 50 100 150 200
0.00 0.05 0.10 0.15 0.20 0.25 0.30
0 10 20 30 40 50 60 70 80
i
/
A
v / V/S
o a
i
/
A
[image:5.596.196.397.232.392.2]E / V
Figure 4. CVs of 8.00×10⁻⁶ mol·L-1 GA in PBS (pH=3.0) at a graphene / GCE at different scan rate.
Insert is the plot of peak currents of GA versus scan rates (a ~ o: 0.02, 0.04, 0.06, 0.08, 0.1, 0.12, 0.14, 0.16, 0.18, 0.2, 0.22, 0.24, 0.26, 0.28, 0.3 V·S-1).
3.3.3 Determination of the Optimum Stirring Time
Because GA is adsorbed on the surface of graphene / GCE, the adsorption time of GA has a great influence on the determination of the optimum stirring time. Under the same conditions, the peak current of GA oxidation was recorded. The results show that ipa of GA increases gradually with stirring time from 10 to 25 seconds and reaches its maximum at 25 seconds; therefore, the best adsorption time is 25 seconds.
3.4 Standard curve and detection limit
addition method was used to increase the concentration to 1.2×10⁻⁹ mol•L−1, The ipa of GA appeared, so the detection limit was 1.2× 10⁻⁹ mol•L−1.
0.2 0.3 0.4 0.5 0.6 0.7 0.8
-80 -75 -70 -65 -60 -55 -50 -45
0 5 10 15 20
0 5 10 15 20
i
/
A
c / mol
j a
i
/
A
[image:6.596.196.397.134.304.2]E / V
Figure 5. DPV curves of different concentrations of GA in PBS (pH=3.0). Insert is linear relationship
between GA concentration and oxidation peak current of GA. (Each of the numbers from a to j corresponds to a concentration of 8.0×10⁻⁸, 2.0×10⁻⁷, 4.0×10⁻⁷, 6.0×10⁻⁷, 8.0×10⁻⁷, 2.0×10⁻⁶, 4.0×10⁻⁶, 6.0×10⁻⁶, 8.0×10⁻⁶, 2.0×10⁻⁵ mol·L-1, respectively)
The comparison of the proposed sensor with other reported sensors for the determination of GA have been done. The results are shown in Table1.
Table 1. Comparison of different electrodes for GA
Electrode Method Linear range (μmol•L−1) (μmol•LLOD −1) Reference
GCE/PEI-rGO LSV 0.58-58 0.41 10
GCE/PEP DPV 1-20 0.06 11
GE/TH/NICF Amperometry 4.99-1200 1.66 12
CPE/SiO2 DPV 0.8-100 0.25 13
AgNP/Delph/G
CE Amperometry 0.60-625.80 0.28 14
Graphene/PM Amperometry 0.1-728.9 0.027 15
ASPCE Amperometry 0.01 -1799.6 0.031 16
APTS@GO/PP
AH-SDS/GCE DPV 0.006-2000 0.0017 17
Graphene/GCE DPV 0.08-20 0.0012 This work
[image:6.596.58.541.472.678.2]
3.5Analytical application
[image:7.596.97.500.229.324.2]Samples of 2, 4, and 6 mL tea liquid and quantitative amounts of pH=3.0 PBS buffer solution (No. 1, 2, 3) were transferred into a volumetric flask and adjusted to constant volume. The oxidation peak currents were measured with the standard addition method, and the recovery rate was calculated. The results of the measurements and calculations are shown in Table 2. The results have been compared with standard method of HPLC.
Table 2. Results of the analysis of GA in samples (n=6)
Sample Added(μmol•L−1) Found(μmol•L−1) Recovery (%)
1 1.00 0.979a,0.985b 97.9a, 98.5b
2 10.00 9.809a,10.29b 98.09a, 102.9b
3 20.00 20.11a,19.92b 100.6a,99.6b
a: this work; b:HPLC method
It can be seen clearly that this proposed method was successfully applied to the determination of GA in tea samples. The analysis results obtained in this work were compared with those obtained by the HPLC method. Table 2 shows the measurement results obtained by the proposed method (Table 2a) and the HPLC method (Table 2b). The analysis results obtained using this proposed method were consistent with those obtained by the HPLC method. It can be seen that this sensor was successfully applied to the determination of GA.
3.6 Reproducibility
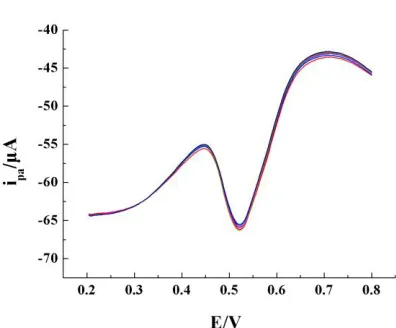
Figure 6. DPV curves for six times determination for 8.00 × 10⁻⁶ mol•L−1 GA in PBS (pH=3.0) by a
graphene / GCE
[image:7.596.185.383.520.684.2]
The relative standard deviation of the oxidation peak current, measured six times, is RSD=1.33%, which shows that the graphene / GCE has good reproducibility.
3.7 Interference experiment
The interference experiment of GA with a concentration of 8.0 ×10⁻⁶ mol•L−1 was carried out based on optimized conditions. The results showed that the presence of 150 times the typical expected concentration of Ca2+, Fe3+, Cu2+, Na+, K+, PO43-, CO32-, Cl- and NO3-, 100 times typical expected concentration of sorbic acid, tartaric acid, ascorbic acid and glucose, 10 times typical expected concentration of uric acid, salicylic acid, benzoic acid and phenol did not interfere with the determination of GA (the relative measurement error was less than 5%). Therefore, the present electrode has good selectivity.
From these above reports, it can be seen that graphene sensor can enhance the sensitivity of the electrode. It exploited a new way to determine GA in tea. It showed a wide linear range and a low LOD with several modified electrodes (Table 1), suggesting that this proposed method was suitable for the determination of GA. It also can be seen that this method has good recovery and precision in real samples from Table 2.
4. CONCLUSIONS
The results indicate that graphene has a good catalytic effect on GA in PBS and shows a response that is linear in the 8.0×10⁻⁸ to 2.0×10⁻⁵ mol•L−1 GA concentration range. The detection limit is 1.2×10 -9 mol•L−1. This proposed determination for GA on graphene / GCE was carried out even in the presence of some potentially interfering compounds such as sorbic acid, tartaric acid, ascorbic acid and glucose. The modified electrode is highly reproducible, stable and sensitive. The content of GA in green tea was determined by this method, and the recovery was 97.9%-100.6% with satisfactory results.
ACKNOWLEDGEMENTS
The project was supported by the Project of Shandong Province Higher Educational Science and Technology Program (J17KB62) and a project of HOME Program-Help Our Motherland through Elite Intellectual Resources from Overseas.
References
1. D. Rajalakshmi and S. Marasimhan, Marcel Dekker, (1996) 65.
2. B. Boye, E. Brillas, A. Buso, G. Farnia, C. Flox, M. Giomo and G. Sandona, Electrochim. Acta, 52 (2006) 256.
3. I. Mudnic, D. Modun, V. Rastija, J. Vukovic, I. Brizic, V. Katalinic, M. Kozina, B. Medic-Saric and M. Boban, Food Chem., 119 (2010)1205.
6. K. Narumi, J.I. Sonoda, K. Shiotani, M. Shigeru, M. Shibata, A.Kawachi, E. Tomishige, K. Sato and T. Motoya, J. Chromatogr. B., 945 (2014) 147.
7. N. Srivastava, S. Verma, S. Pragyadeep, S. Srivastava and R.A. Singh, J. Planar. Chromatogr., 27 (2014) 69.
8. R. Jiménez-Prieto, M. Silva and D. Pérez-Bendito, Anal. Chim. Acta, 1 (1996) 53. 9. S. Li, H. Sun, D. Wang, L. Qian, Y. Zhu and S.Tao, Chin. J. Chem. Eng., 30 (2013) 837. 10.J.H. Luo, B.L .Li, N.B. Li and H.Q. Luo, Sens. Actuators, B, 186 (2013) 84.
11.R. Abdel-Hamid and E.F. Newair, J. Electroanal. Chem., 704 (2013) 32. 12.N.S. Sangeetha and S.S. Narayanan, Anal. Chim. Acta, 828 (2014) 34. 13.J. Tashkhourian and S.F. Nami-Ana, Mater. Sci. Eng., C, 52 (2015) 103.
14.S. Shojaei, N. Nasirizadeh, M. Entezam, M. Koosha and M. Azimzadeh, Food Anal. Methods, 9 (2016) 2721.
15.C. Tse-Wei, P. Selvakumar, S. M. Chen and V. Vijayalakshmi, Int. J. Electrochem. Sci., 12 (2017) 4107.
16.N. Raja, T. Kokulnathan, S. M. Chen, W. C. Liao and T. S. Priya, Int. J. Electrochem. Sci., 12 (2017) 4620.
17.M. Ghaani, N.Nasirizadeh, S.A. Yasini Ardakani, F. Z. Mehrjardi, M. Scampicchio and S. Farris, Food Anal. Methods, 8 (2016) 1103.
18.M.F. Chen, X.Y. Ma, X. LI, M.J. Yin, Y.Y. Li and Z.H. Sun, J. Chil. Chem. Soc., 63 (2018) 3795. 19.X.Y. Ma, M.F. Chen, H.P. Lv, Z.X. Deng, M.J. Yin and X. L. Wang, Int. J. Electrochem. Sci., 13
(2018) 6286.
20.M. F. Chen, X.Y. Ma and X. Li, J. Solid State Electrochem., 16 (2012) 3261. 21.X.Li, M.F. Chen, X.Y. Ma. Anal. Sci., 28 (2012) 147.
22.Y.L. Su, S.H. Cheng, Anal. Chim. Acta, 901 (2015) 41.