Rochester Institute of Technology
RIT Scholar Works
Theses Thesis/Dissertation Collections
2008
Differential virtualization for large-scale system
modeling
Jason Koppe
Follow this and additional works at:http://scholarworks.rit.edu/theses
This Thesis is brought to you for free and open access by the Thesis/Dissertation Collections at RIT Scholar Works. It has been accepted for inclusion in Theses by an authorized administrator of RIT Scholar Works. For more information, please [email protected].
Recommended Citation
Differential Virtualization for Large-Scale System Modeling
By
Jason Koppe
Thesis submitted in partial fulfillment of the requirements for the degree of Master of Science in Computer Security and Information Assurance
Rochester Institute of Technology
B. Thomas Golisano College
of
Computing and Information Sciences
Rochester Institute of Technology
B. Thomas Golisano College
of
Computing and Information Sciences
Master of Science in
Computer Security and Information Assurance
Thesis Approval Form
Student Name:
Jason Koppe
Thesis Title:
Differential Virtualization for Large-Scale System Modeling
Thesis Committee
Name
Signature
Date
Bo Yuan
Chair
Bill Stackpole
Committee Member
Yin Pan
Thesis Reproduction Permission Form
Rochester Institute of Technology
B. Thomas Golisano College
of
Computing and Information Sciences
Master of Science in
Computer Security and Information Assurance
Differential Virtualization for Large-Scale System Modeling
I, Jason Koppe, hereby grant permission to the Wallace Library of the Rochester Institute of Technology to reproduce my thesis in whole or in part. Any reproduction must not be for commercial use or profit.
Abstract: Today’s computer networks become more complex than ever with a vast number of connected host systems running a variety of different operating systems and services. Academia and industry alike realize that education in managing such complex systems is extremely
important for computer professionals because, with computers, there are many levels of detailed configuration. Configuration points can occur during all facets of computer systems including system design, implementation, and maintenance stages. In order to explore various hypotheses regarding configurations, system modeling is employed – computer professionals and
researchers build test environments. Modeling environments require observable systems that are easily configurable at an accelerated rate. Observation abilities increase through re-use and preservation of models. Historical modeling solutions do not efficiently utilize computing resources and require high preservation or restoration cost as the number of modeled systems increases. This research compares a workstation-oriented, virtualization modeling solution using system differences to a workstation-oriented, imaging modeling solution using full system states. The solutions are compared based on computing resource utilization and administrative cost with respect to the number of modeled systems. Our experiments have shown that upon increasing the number of models from 30 to 60, the imaging solution requires an additional 75 minutes; whereas, the difference-based virtualization solution requires an additional three (3) minutes. The imaging solution requires 151 minutes to prepare 60 models, while the difference-based, virtualization solution requires 7 minutes to prepare 60 models. Therefore, the cost for model archival and restoration in the difference-based virtualization modeling solution is lower than that in the full system imaging-based modeling solution. In addition, by using a virtualization solution, multiple systems can be modeled on a single workstation, thus increasing workstation resource utilization. Since virtualization abstracts hardware, virtualized models are less
dependent on physical hardware. Thus, by lowering hardware dependency, a virtualized model is further re-usable than a traditional system image. If an organization must perform system modeling and the organization has sufficient workstation resources, using a differential
I
Table of Contents
TABLE OF CONTENTS ... I TABLE OF FIGURES ... III TABLE OF TABLES ... IV ACKNOWLEDGEMENTS ... V
1 INTRODUCTION ... 1
1.1 PROBLEM ... 1
1.2 IMPORTANCE ... 3
1.3 REVIEW OF CURRENT RESEARCH ... 3
1.4 DOCUMENT OUTLINE ... 6
2 BACKGROUND ... 7
3 RESEARCH DESIGN ... 10
3.1 ASSUMPTIONS AND LIMITATIONS ... 10
3.2 ENVIRONMENT OVERVIEW ... 13
3.2.1 Network Services ... 13
3.2.2 Workstation Deployment ... 14
3.2.3 Virtual Machine Templates ... 20
3.2.4 Using the Environment ... 23
3.3 OPTIMIZING RESTORATION TIME ... 24
3.4 DIRECT MODIFICATION CHARACTERIZATION ... 28
3.5 WORKSTATION CAPABILITIES ... 29
4 RESULTS AND ANALYSES ... 31
4.1 OPTIMIZING RESTORATION TIME ... 31
4.2 DIRECT MODIFICATION CHARACTERIZATION ... 35
4.3 WORKSTATION CAPABILITIES ... 41
5 CONCLUSIONS ... 42
6 FUTURE WORK ... 43
7 APPENDICES ... 44
7.1 RESTORATION RESULT DATABASE ... 44
7.2 DIFFVIRTRESULT.PS1 ... 48
7.3 BATCHANALYZE.PS1 ... 49
7.4 STARTTEST.PS1... 50
7.5 MASSIMAGE.PS1 ... 51
7.6 DEFAULT.XML ... 58
7.7 USERADD.PL ... 60
III
Table of Figures
FIGURE 1–SAMPLE LAB DIAGRAM ... 12
FIGURE 2–HOME DIRECTORY SPECIFICATION UPON USER CREATION ... 14
FIGURE 3–DHCP OPTIONS REQUIRED FOR WDS ... 15
FIGURE 4–NETSH COMMANDS TO CONFIGURE DHCP OPTION 60 ... 16
FIGURE 5–SERVERMANAGERCMD TO INSTALL WDS ... 16
FIGURE 6–CREATING AND ADDING A CAPTURE BOOT IMAGE ... 17
FIGURE 7–VISTA SYSPREP COMMAND TO PREPARE A SYSTEM FOR CAPTURE ... 17
FIGURE 8–XP SYSPREP COMMAND TO PREPARE A SYSTEM FOR CAPTURE ... 17
FIGURE 9–PXE PROCESS REQUIRING F12 TO BOOT ... 17
FIGURE 10–WDSBOOT MANAGER ... 18
FIGURE 11–CAPTURE WIZARD,CAPTURE SOURCE ... 18
FIGURE 12–CAPTURE WIZARD,CAPTURE DESTINATION ... 19
FIGURE 13–CAPTURE WIZARD, GROUP CHOICE AFTER AUTHENTICATION ... 19
FIGURE 14–ENABLING TEMPLATE MODE ... 21
FIGURE 15–CLONE SELECTION... 23
FIGURE 16–RESTORATION EXPERIMENT RESULT RECORD EXAMPLE ... 27
FIGURE 17–SIMULTANEOUS RESTORATION OF MODELS ... 32
FIGURE 18–DISK THROUGHPUT DURING XP RESTORATION WITH SIXTY MODELS ... 34
FIGURE 19–DISK THROUGHPUT DURING IMAGING RESTORATION WITH SIXTY MODELS ... 34
FIGURE 20–SIZE OF EIGHTY DISTINCT LINKED CLONES ... 35
FIGURE 21–SIZE OF EIGHTY DISTINCT GHOST IMAGE ... 35
FIGURE 22–DISK THROUGHPUT DURING DIRECT MODIFICATION RESTORATION WITH SIXTY MODELS ... 36
FIGURE 23–DISK OPERATIONS DURING FIRST LAUNCH OF MODEL USING XP DIRECT MODIFICATION ... 37
FIGURE 24–DISK OPERATIONS DURING FIRST LAUNCH OF MODEL USING VISTA DIRECT MODIFICATION ... 38
FIGURE 25–DISK OPERATIONS DURING LAUNCH OF MODIFIED MODEL USING XP DIRECT MODIFICATION ... 39
FIGURE 26–DISK OPERATIONS DURING LAUNCH OF MODIFIED MODEL USING VISTA DIRECT MODIFICATION ... 39
FIGURE 27–DISK OPERATIONS DURING SHUTDOWN OF MODIFIED MODEL USING XP DIRECT MODIFICATION ... 40
IV
Table of Tables
TABLE 1–MEMORY ALLOCATION FOR VIRTUAL MACHINES ... 30
TABLE 2–EXPECTED VERSUS ACTUAL REPORTS FROM RESTORATION EXPERIMENTS... 33
TABLE 3–PERFORMANCE STATISTICS DURING THE XP RESTORATION WITH SIXTY MODELS ... 33
TABLE 4–PERFORMANCE STATISTICS DURING THE IMAGING RESTORATION WITH SIXTY MODELS ... 33
TABLE 5–PERFORMANCE STATISTICS DURING THE DIRECT MODIFICATION RESTORATION WITH SIXTY MODELS ... 36
TABLE 6–DISK OPERATIONS FROM SERVER DURING INITIAL LAUNCH OF ONE MODEL ... 38
TABLE 7–DISK OPERATIONS FROM SERVER DURING LAUNCH OF ONE MODIFIED MODEL ... 39
V
Acknowledgements
Thanks…
To my persistent professor and advisor for life: my mother, Jennifer
To my temporary teachers and peers for life: my friends, including the RIT faculty and staff
1
1
Introduction
Complex computer networks exist throughout the world. In fact, computer networks are so vast and growing so quickly that colleges and universities offer degree programs focused upon computer system design and administration. An entire training industry exists for computer certifications like Microsoft Certified Professional, Cisco Career Certifications and for other major products. Further, there are even more computer certifications from organizations like SANS and CompTIA. Academia and industry alike realize that education is important for
computer professionals because, with computers, there are many levels of granular configuration. Configuration points range from the way a web browser displays a page to the fashion that a network adapter queues packets for delivery or acceptance. In order to test hypotheses regarding new or different computer system configurations, system modeling occurs – computer
professionals and researchers build test environments. Anti-malware researchers might setup a quarantined computer network and launch potentially malicious software to understand its
behavioral traits. Software testers might setup multiple versions of different operating systems at many different configuration granularities to verify whether the software executes as expected in distinct environments. System administrators might setup a duplicate server environment to assess the latest software patches and any negative impacts they cause. System imaging and virtualization have both helped advance computer system modeling procedures and capabilities.
This research aims to determine infrastructures that employ existing resources to use and archive large-scale heterogeneous system models by utilizing workstations to perform differential
operating system virtualization. By staging workstations with virtual machine templates, users can create, store, and restore differential virtual machines based on the templates. Once a user instantiates this difference, they can execute the difference using primarily the workstations computing resources.
1.1
Problem
2 Models that use hardware specific imaging can lead to a model that underutilizes computing resources since each workstation executes operations for a single operating system. Unless the test requires each workstation to perform at one-hundred percent resource utilization, it is likely that a virtualization-based model could achieve higher hardware resource utilization. To
elaborate, if a test requires simulated user activity similar to web browsing or document authoring, a modeled entity should not be at full utilization at the processor, network, disk, or memory. Further, these solutions, while useful in small environments and necessary for situations like hardware configuration testing and disk forensics, do not scale as the number of modeled systems increases because they require sufficient modeling hardware. For example, if a tester needed to simulate fifty workstations running Red Hat Linux and fifty workstations
running Microsoft Windows 2000, a hardware specific imaging modeling approach requires the tester to have one-hundred physical workstations dedicated to the test environment – this is not practical.
Virtualization is one approach to utilize more efficiently the hardware available and thus
3 Thus, explored in this research is a modeling solution that harnesses both workstation resources and virtualization.
1.2
Importance
Generally, modeling is important to research because it enables scientists ―to apply quantitative reasoning to observations about the world, in hopes of seeing aspects that may have escape the notice of others‖ (Silvert 2001). Computer modeling is becoming much more important as systems become more complex. This research could apply to, and therefore benefit, any
organization that performs computing research tasks ranging from software assurance to systems education.
1.3
Review of current research
Research regarding the administration and execution of modeling environments has been prevalent in academician-led research. Academicians are all wondering the same thing: how does one provide environments where users can apply and model computer systems concepts? Further, even if such environments are possible, how can one manage them in a low-cost fashion? This section presents previous attempts at workstation-based virtualization for
computer system modeling that include minimal guest operating system support, minimal usage of differential techniques, minimal performance analysis, no system deployment techniques, and lastly, out-dated concerns of expensive monetary costs.
(Lei and Rawles 2003) raised practical cost and space concerns regarding space acquisition and computing resource utilization. The central purpose of their study was to survey performance and cost of three virtualization technologies that would enable a more practical lab environment. Their research included both quantitative methods involving performance benchmarking with different storage and virtualization technologies and qualitative methods regarding cost analysis. They tested installation time of six virtual operating systems in three virtualization platforms VMware Workstation, Microsoft Virtual PC, and Netraverse Win4Lin utilizing six storage technologies on three separate host operating systems; further, they monitored resource
4 enable applied system and networking administration learning. This study is unique in that it quantifiably measures performance of the system at multiple points of interest: host resource utilization, virtual OS installation time, and network utilization.
(Begnum et al. 2004) presented challenges their institutions experienced using traditional physical hardware to enable students to learn and apply system administration concepts. The purpose of their study was to provide an environment where students could manipulate systems from an administrative context. The authors described use of User-Mode Linux (UML) as a virtualization platform and My Linux Network (MLN) as a virtualization administration tool at university and industry environments. The authors concluded that their use of virtualization through User-Mode Linux enabled students more efficiently learn system administration concepts. The authors stated that they’re approach to enabling students to apply system
administration concepts need only function ―as specified in the RFC’s‖ – therefore, they weren’t required to offer specific operating systems or applications, just something that ―worked
correctly.‖ While their UML architecture enables system administration education in their institution, other organizations might require implementation of heterogeneous architectures including non-Linux operating systems.
Educators at the University of Cincinnati (Stockman, Nyland, and Weed 2005) faced mobility and manageability issues surrounding a small deployment of workstation-based virtualization to teach networking and system administration material. The purpose of their study was to present their findings regarding a centralized delivery of virtual machines to a lab environment including 18 physical workstations to assist student mobility and staff system management. Their
experiment was centered on an Active Directory domain that included a network-attached
5 mobility could be achieved with a central storage for student systems and that managing base virtual machines at the central storage was much simpler than distributing the base virtual machines to the workstations. Regarding the test, the authors did not include quantifiable performance characteristics. In addition to similar infrastructure management considerations, this research methodology will contrast their use of centralized base virtual machines by de-centralizing base virtual machines. The Stockman et al study did not mention the use of linked clones. The use of Microsoft Virtual PC as a virtualization platform limits types of supported virtual operating system to Microsoft operating systems; other organizations might require implementation of heterogeneous infrastructures that include non-Microsoft operating systems.
Other educators (Vollrath and Jenkins 2004) sought to address their problem of limited physical lab space; their lab consisted of 30 computers but was required to support nearly 60 students. They experienced logistical issues regarding lab space availability and concerns regarding high-cost instructional sign-offs. The goal of their study was explore implications and high-cost of using virtualization to alleviate their space and sign-off problems. The study proposed the use of Microsoft Virtual PC as a virtualization platform and further utilizing the differentiation feature of Virtual PC for various procedural benefits. Vollrath, a student at the time, evaluated the feasibility of their lab assignments in their test virtual environment. Their conclusions were broad and included an out-of-lab grading process by saving student virtual machine differences to external media, in-class exams from equivalent virtual machines are probable and easier creation of lab assignments and hoped that their infrastructure would enable students to focus on management rather than installation of systems. Vollrath and Jenkins study ostensibly used Microsoft Virtual PC to support Linux and Microsoft operating systems; only Microsoft
operating systems are supported guest operating systems as detailed in the Microsoft Virtual PC specifications (Microsoft Corporation 2007a). As stated previously, Microsoft Virtual PC might not be an option for organizations that require implementation of heterogeneous infrastructures that include non-Microsoft operating systems. Their use of virtual machine differences to lower resource cost is a novel approach that this research project aims to utilize.
6 paravirtualization, the core purpose of their study was to present their virtualization
implementation, known as SOFTICE (Scalable, Open source, Fully Transparent and Inexpensive Clustering for Education). The authors state that in using open source applications (UML/MLN) and not relying on virtual disk delivery to students as in (Stockman, Nyland, and Weed 2005) makes their system more appealing and ―accessible over the internet.‖ (Gaspar, Langevin, and Armitage 2007) argue that investing computing resources for workstation-oriented virtualization is an ―investment [that] will sit mostly idle and unused.‖ Thus, (Gaspar, Langevin, and Armitage 2007) assume that institutions do not already have computing resource capacity to utilize
workstation-powered virtualization. Finally, (Gaspar, Langevin, and Armitage 2007) do not address practical environments that implement non-Linux platforms.
(Stackpole et al. 2008) addressed the lack of evaluation for decentralized virtualization that supports scalable, heterogeneous environments for use in system administration education. They described the problems with a full operating system imaging solution. The crux of the paper is the proposed usage of linked clones for storage of student-customized virtual machines. The authors demonstrate that utilization of storage, network, and management resources would decrease significantly because of the differential nature of the student data. This paper is the basis for this thesis; this research aims to quantify the claims Stackpole et al. by measuring performance and documenting management procedures.
1.4
Document Outline
The remainder of this document is organized as follows. Chapter 2 presents concepts basic to understanding the research. In chapter 3, the research environment and experiments are
7
2
Background
Traditionally, experimenting with computer systems meant one required either additional computer hardware. By having additional hardware, additional physical systems could be constructed and used in experiments. Boot loaders were developed to enable multi booting. Multi booting involves installing more than one operating system to a workstation. After installing more than one operating system and upon starting the workstation, one can select which operating system to execute; thus, one can experiment with multiple logical systems on one physical system. Imaging, a process of duplicating hard disk contents, proves useful in system modeling. Using disk imaging, one can preserve the state of a disk by copying the contents to another disk or by archiving it in a single file. With disk imaging, one can easily configure similar workstations to have the same disk contents and, therefore, the same operating system and software configuration. Disk imaging has been popularized through products from companies like (Symantec 2008) and (Acronis 2008) and open source solutions like (Clonezilla 2008). Further, to increase efficiency when copying the same disk image to many disks, these products harness the abilities of multicast IP transmissions. Multicasting enables a server to send one copy of the disk image to many workstations, rather than sending many copies to many workstations. By only requiring the server to access and send the image once, the server requirements are decreased. Therefore, multicast enables scalable imaging and is useful when imaging many similar workstations. However, in the end, spare hardware is costly and multi booting or system imaging does not fully utilize the workstation hardware.
Newer to system modeling is the concept of virtualization, or abstracting computer hardware. Different types of virtualization exist, but for the purposes of this research, it is important that the virtualization platform enable the concurrent execution of multiple operating systems on a single workstation. The virtualization platform used in this research, VMware Workstation, abstracts nearly all of the underlying hardware. ―VMware Workstation virtualizes I/O devices using a novel design called the Hosted Virtual Machine Architecture […] that takes advantage of a pre-existing operating system for I/O device support‖ (Sugerman et al. 2001).
8
the VMM will intercept it and switch to the host world rather than accessing the native hardware directly. Once in the host world, the [virtualization application] will perform the I/O on behalf of the virtual machine through appropriate system calls.
This type of virtualization is also employed by Xen; however, the platforms differ in how processor instructions are abstracted. Hardware-assisted virtualization, supported by AMD-V and Intel VT, offer full, consistent processor abstraction at a loss of memory throughput (Nakajima 2007) and require special hardware. In this research, VMware Workstation enables the execution of multiple virtual machines per workstations, so one can achieve a higher
utilization of workstation resources. Therefore, by coupling virtualization and disk imaging, one can configure many workstations with multiple virtual machines and increase the utilization of modeling resources. To optimize resource utilization further, many virtualization products offer the ability to create differential virtual machines. (Stackpole et al. 2008) provide the following an explanation of linked clones, which are VMware’s implementation of differential virtual machines, and offer insight as to how differential virtual machines optimize storage
requirements.
The use of VMware’s linked clones is critical to the efficient use of network and storage resources. VMware defines a linked clone as “a copy of a virtual machine that shares virtual disks with the parent virtual machine in an ongoing manner […while…] changes to the disk of the linked clone do not affect the parent.” While the size of a modified operating system image is the sum of the size of the operating system and the modifications, the size of a linked clone is merely the size of the modifications. When saving modifications, linked clones consume less storage space; therefore, linked clones more efficiently use disk space than full system images.
10
3
Research Design
In this chapter, an environment that supports differential virtualization on shared-use
workstations is presented. Then, three experiments using the environment are detailed. In the first experiment, this research compares a workstation-oriented, virtualization modeling solution using system differences to a workstation-oriented, imaging modeling solution using full system states; the solutions are compared based on computing resource utilization and administrative cost while increasing the number of modeled systems. The second experiment attempts to deduce storage requirements for a specific differential virtualization approach. The third experiment demonstrates the capabilities of an individual workstation to operate many virtual machines. In section 3.1, overall assumptions and limitations for all experiments are discussed. Section 3.2 details environment implementation. Sections 3.3, 3.4, and 3.5 detail the three separate experiments. The results and analyses are presented in chapter 4.
3.1
Assumptions and Limitations
This research does not intend to determine whether clustered server-grade virtualization or workstation-based virtualization is better suited for modeling. Therefore, it is assumed that this research applies to organizations that have a substantial number of workstations whose combined processing ability and memory space is underutilized.
It is assumed that there are benefits to preserving model state and that saving progress is important ability that, when technically feasible, enhances the user experience. Thus, a large portion of this environment is focused on preserving the state of a model.
In order to measure user experience with a particular environment, it is safe to assume that if users spend less time creating, saving, and restoring the model, they can spend more time working with the model. It is assumed that having more actual time to use and manipulate the model is beneficial to modeling.
11 usability. Additionally, software installed on models may behave differently since software can detect its operating environment. Thus, it is also assumed that modeled processes and systems do not purposely behave differently within a virtualized model.
A rather large assumption is that the administrators employ Microsoft Active Directory with Microsoft DNS, DHCP, and File Services. Active Directory offers seamless authentication and access control, two features that the shared modeling environment requires. Further, it is assumed that, since Active Directory is a highly pervasive technology, there is no need to describe a basic setup of an Active Directory instance. In addition, VMware Workstation is the chosen virtualization platform for this environment because it offers extensive guest operating system support (VMware, Inc. 2008a).
For the purposes of testing and demonstrating a research environment, principles like least privilege, role based policy enforcement, resource quotas, and other areas that require attention in a practical deployment of such a modeling solution are ignored. It is assumed that those implementing a true instance of the research environment will pay attention to many security-focused areas that this research ignores. Throughout the remainder of this chapter, configuration points that require more attention in a practical deployment are annotated.
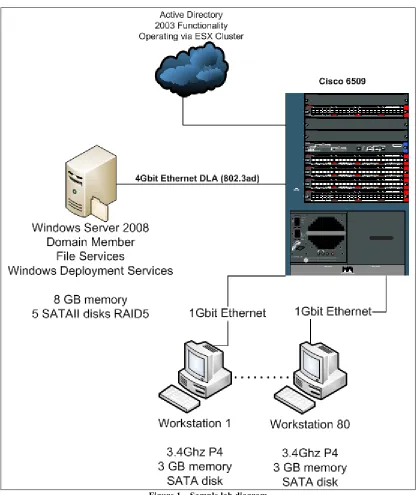
In modeling this research, scope limitations are required. There are initial components, such as workstations, servers, network hardware, storage solutions, and operating systems, from which samples must become determined. While modifying the configuration of components in the sample might yield different performance results, this research used the standard hardware configuration from the sampled laboratory yet varies operating systems on the workstations. The existing components in the Systems Administration laboratory for the NSSA department at RIT are used. The laboratory contains twenty benches each with four workstations. The eighty workstations operate a 3.4 GHz processor, 3 GB of memory, 110 GB hard disk, and two one-gigabit network adapters. Each workstation has a one-one-gigabit network connection to a data subnet while the other adapter connects to the bench hub. A Cisco 6509 with one-gigabit
12 Intel quad-gigabit network adapter offers networked file services for the laboratory using a four-gigabit bandwidth network team. Finally, the Active Directory infrastructure is comprised of a set of virtual machines running on a VMware ESX cluster of Dell PowerEdge 2850 rack mount servers, one of which is noted as Vader SRV in the diagram below. Figure 1 portrays the laboratory from a logical perspective; insignificant physical entities are not illustrated.
13
3.2
Environment Overview
This overview describes, explains, and justifies the procedures required to implement an environment that supports differential, workstation-based virtualization for mobile computer system modeling. The remaining subsections describe an implementation of the environment.
The ideal environment stores differential virtual machines at a highly available storage solution for two reasons. The first, mobility, is a necessary feature for modeling environments when there are more users than workstations. The second reason is to uphold data redundancy – store important data in some way to decrease the risk of data loss or inaccessibility in the unfortunate event of infrastructure error or failure. This is not to say that linked clones must be stored at a highly available storage solution all of the time. In fact, this research concludes that caching linked clones on workstations prior to executing might be more feasible.
On the workstations, an operating system and template virtual machines are installed prior to user interaction. Once a user has an authorized account and networked home directory, they can initiate logon sessions with at least one workstation. Once the user has initiated at least one session, they can create linked clones within their networked home directory. Once the linked clones are created, they can be configured and powered on — this can be considered the start of a user’s modeling session. As the user manipulates their linked clones, their modifications are stored to the network share whenever the virtualization software dictates writes to the virtual disk or virtual memory. At any time, the user can snapshot, suspend or power off their linked clone to save the current state of their model to the file server — this can be considered the end of a user’s modeling session. Once the modeling session is complete, the user can end their logon session. Later, when the user returns, they initiate at least one logon session to restart their modeling session by opening, configuring and powering on their linked clones.
3.2.1 Network Services
14 Directory and Domain Name Services prior to other services because all remaining services rely on Domain Name Services to access Active Directory and further rely on Active Directory for authentication and role-based access control. This research recommends configuration of File Services prior to user creation.
The creation of users is an important and potentially time-consuming process. For this
environment, it is important that each user obtains control of a home folder and that this home folder is automatically mapped when the user performs logon to a domain-joined workstation. The home folder is the central location where the user stores their linked clones. It is
recommended to use a script to automate a majority of the process and prevent user-error. Such a script would likely utilize cacls.exe and icacls.exe to modify access lists on the home
directories. Further, the directory services utilities are included in Server 2008 as the feature, RSAT-ADDS. The directory service utilities assist with managing AD objects and fan facilitate the user creation process. The add utility, dsadd.exe, enables object attribute configuration upon creation. When dsadd.exe is used in context of user additions, the hmdir attribute signifies the
home folder and the hmdrv attribute signifies to which local drive the hmdir will be mapped
when the user logs onto a workstation. For example, the command in Figure 2 adds a user
named john to the default users’ organizational unit with a home directory of \\server\share\.
The share will be mapped to Z:\ when john logs on to a domain-joined workstation. In addition to the directory service tools, many Microsoft programming and scripting languages offer façades to the Active Directory Services Interfaces (Microsoft Corporation 2008g).
dsadd user "CN=john,CN=Users,DC=koppe,DC=thesis" -hmdir \\server\share
-hmdrv z:
Figure 2 – Home directory specification upon user creation
3.2.2 Workstation Deployment
15 Next, this section details the configuration of a WDS server to enable deploying operating
systems to workstations.
There are many important DHCP configuration concepts. Since DHCP leases IP addresses, DHCP traffic does not natively traverse networks. However, DHCP relay agents perform this multi-network action. Further, DHCP has a notion of lease scope. This means that
administrators must configure the DHCP service to offer and acknowledge a range of addresses. For the purposes of this thesis, network relaying and scope configuration is not of interest, but is required. For network usability purposes, practical implementations need to consider these configuration areas. For the purposes of illustrating how DHCP interoperates with WDS, configuration is performed on an entire DHCP server scope; however, one could extend these configuration steps to smaller scopes and more servers. Using the netsh utility (Microsoft
Corporation 2005), one could dynamically configure DHCP settings at a specific time or through user-initiated script. For example, an administrator might only want WDS to function during a specific period – one way to achieve this is through automated, scheduled netsh tasks.
WDS requires three specific DHCP configuration settings including the address of the WDS server, a PXE specification, and the boot filename (Microsoft Corporation 2008c). The following screenshot, Figure 3, shows the specific DHCP options configured to direct PXE clients to download a specific boot file (boot\x86\wdsnbp.com) from a specific WDS server (192.168.66.150).
Figure 3 – DHCP options required for WDS
Statically configuring the boot\x86\wdsnbp.com does not limit deployment to x86 architectures; architecture detection commences after the boot program executes. Further, since DHCP is on a separate server from WDS, the administrator must create and define option 60 using either netsh or the graphical interface. Figure 4 below shows the netsh commands to create and configure option 60.
16
Support" "PXEClient"
netsh Dhcp Server set optionvalue 60 STRING "PXEClient"
Figure 4 – Netsh commands to configure DHCP option 60
Now that DHCP directs PXE clients to the WDS server, the WDS server needs to be configured. The Windows Deployment Services (WDS) ―enables rapid deployment of Windows to
computers via network-based installation‖ (Microsoft Corporation 2008c). This research uses WDS to install the workstation operating systems. Since it offers multicast support, the version of WDS that this research uses is a role in Windows Server 2008. Use servermanagercmd.exe, as illustrated below in Figure 5, or the Server Manager graphical console to install the role.
servermanagercmd -install WDS
Figure 5 – Servermanagercmd to install WDS
Once installed, the server requires initialization. Initialization uses servermanagercmd.exe or the Server manager graphical console. The initialization process includes the creation of the Remote Installation share, DHCP option configuration, and PXE response configuration. Microsoft recommends placing the Remote Installation share on a different volume than the operating system. This research assumes the DHCP server exists at a separate address; therefore, the default DHCP configuration is acceptable. Finally, set PXE to respond to all unknown and known clients. The value of this configuration instructs the WDS server to permit access to specific workstations. Since the PXE response setting is an access control, consider security when configuring this in a practical environment.
Upon initialization, WDS suggests adding images. In WDS, there are different types of images; however, this research details usage of three types: install, boot setup, and boot capture images. The initialization wizard asks for an image source directory such as one found on Vista SP1 or Server 2008 media. By providing the sources directory, one boot setup image and some install images are added. A boot setup image enables the installation of an install image. For example, a workstation boots from the network and loads the boot setup image. Then, the boot setup image installs and configures a custom install image to the workstation.
17
wdsutil /new-captureimage
/image:"Microsoft Windows Longhorn Setup (x86)" /architecture:x86 /destinationimage /filepath:"c:\capture.wim"
wdsutil /add-image /imagefile:"c:\capture.wim" /Imagetype:boot /Name:"Microsoft Windows Capture (x86)”
Figure 6 – Creating and adding a capture boot image
The capturing process is similar to a traditional system imaging process. An operating system is installed on a reference computer and customizations are made. Then, the system must be prepared with the Microsoft Sysprep utility (Microsoft Corporation 2008c). While the Sysprep utility is included in Vista, it must be downloaded for XP as a part of the Deployment Tools package (Corporation 2008).
%systemroot%\system32\sysprep\sysprep /oobe /generalize /reboot
Figure 7 – Vista sysprep command to prepare a system for capture
sysprep –mini –reseal -reboot
Figure 8 – XP sysprep command to prepare a system for capture
[image:27.612.74.542.402.528.2]Once prepared, the workstation reboots and begins the PXE process. To arrive at the boot selection screen, press F12 as directed in Figure 9 below.
Figure 9 – PXE process requiring F12 to boot
18 Figure 10 – WDS Boot Manager
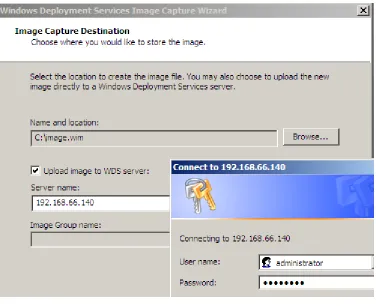
[image:28.612.118.495.405.669.2]WDS first captures the system image to a drive local to the workstation; therefore, there must be a volume with sufficient free space attached to the workstation prior to capturing. The next figures, Figure 11, Figure 12, and Figure 13, illustrate the capture process. Note that in Figure 12 the Location must have sufficient free space to store the capture image. In this example, C:\ is a 20GB volume with 4GB of used space. This means that the image will be approximately 4GB. Since there are 16 GB of free space on the volume, the image can be created successfully before being uploaded to the WDS server.
19 Figure 12 – Capture Wizard, Capture Destination
Figure 13 – Capture Wizard, group choice after authentication
[image:29.612.192.420.405.439.2]20 deployment process and other WDS-related processes are detailed in a Microsoft TechNet
article, titled Windows Deployment Services Processes (Microsoft Corporation 2008d); further, the automated steps of the massImage.ps1 script are documented in the script heading comments (see appendix 7.5, page 51). An unattended installation can become very complex. The example in the appendix, default.xml, installs a Windows Vista image to a 20GB C:\ partition on the first disk, creates and formats a second partition P:\ with the remaining space on the first disk, renames the computer according to the WDS naming pattern, and joins the domain TESTDOMAIN with credentials TESTUSERNAME and TESTPASSWORD. In a true environment, care should be taken to assure that the TESTUSERNAME role has limited
abilities; see Performing Unattended Installations from TechNet (Microsoft Corporation 2008e) for detailed information about automating installation.
In order for the workstations to name according to a naming pattern, they must either be
prestaged or started in a specific order. WDS uses Active Directory to name computers. During the deployment process, WDS sets the workstation name based on the hardware UUID or the network adapter MAC address. If either of these is known, the workstations can be prestaged using wdsutil.exe (included when the WDS-RSAT feature is installed in Windows Server 2008). If not, WDS can assign names based on a defined pattern. For example, one could define a pattern WS%02# that would cause WDS to name new workstations WS01, WS02, WS03, etc.
Ultimately, if workstation names are important to an organization, WDS offers flexible configurability to the workstation naming process.
3.2.3 Virtual Machine Templates
Virtual machine templates are the basis for linked clones. Configuring a template requires a few extra steps beyond basic virtual machine creation steps. Once the virtual machine is created, the virtual operating system in installed and customized, a snapshot must be taken. Once the
snapshot is taken, the virtual machine must be configured to template mode. This is completed in the virtual machine settings dialog in the options tab as shown in Figure 14 below.
21 Figure 14 – Enabling template mode
Once the templates are created, they must be stored on each workstation. By storing virtual machine templates on each workstation, the environment offers a reduction in the time required for user model restoration (the experiment detailed in section 3.3 proves this claim). The task of restoring the base operating system or virtual machine template is removed from the user and given to management. The deployment process, as discussed in the previous section, is the opportune time to move virtual machine templates to the workstations. Prior to capturing the custom install image, the administrators could inject the virtual machine templates to a folder in the custom image.
22 created with wdsutil.exe, and having workstations join namespace with wdsmcast.exe.
Workstations can join the namespace while executing their normal operating system if Windows Vista SP1 and Server 2008 AIK is installed (Microsoft Corporation 2008b). Otherwise, a custom boot image can be created on any server where the latest AIK is installed. The process of
creating the custom image is detailed in a TechNet article titled Using Transport Server
(Microsoft Corporation 2008f) in the section titled Using a Transport Server for Multicasting. A multicast namespace is created in much the same fashion that a multicast transmission is created. A script similar to massImage.ps1 could be created to facilitate the process of multicasting
updated templates to all modeling workstations. Firstly, a template image must be created because multicasting is optimized for single file transfers (Sadler 2007). A template image can by making a differential-update version of the template repository in a folder using
Robocopy.exe. Then, that directory must be mounted to a volume letter using subst.exe.
Finally, the virtual disk can be captured using imagex.exe, from the Windows Server 2008 AIK.
Once the template image is made, the image should be stored in the WDS REMINST subdirectory images. Then, the namespace must be created using the path to the images
subdirectory as the /configstring parameter in a wdsutil.exe /new-namespace command.
If using a custom boot image, the image should have wdsmcast.exe, imagex.exe,
wimfltr.sys, and wimfltr.inf along with a startup script; these files come with Windows
Server 2008 AIK. There is an example Win PE startup script, startnet.cmd, in appendix 7.8, on page 68. However, this method might require the workstation to have twice as much free space as the change in size of the template repository if additions or updates are required. For
23
3.2.4 Using the Environment
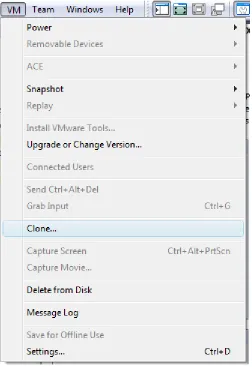
[image:33.612.182.434.295.662.2]When a user has a valid account on the domain, they can begin to use the modeling environment. A user can perform three basic tasks: create linked clones, use linked clones, store linked clones. Thus, a user must be trained in linked clone management. A high-level usage perspective is that users create and use linked clones to model systems and processes. Users can store their linked clones on a centralized storage solution to retain a specific system state. Creating linked clones in VMware Workstation is straightforward: the user opens the template and selects Clone from the VM menu as shown in Figure 15. It is crucial that users understand they are to use linked clones and not full clones. In the cloning process, a user has the option to create a full clone. However, this defeats the purpose of differential virtualization and users must be educated.
24 The user then selects the template’s snapshot and the linked clone option. Lastly, the user must specify a name and location to save the linked clone. There are two optional locations for linked clones: the workstation or the file server. Linked clones should be stored in specific locations based on their state. Linked clones exist in either the on or off state. When off and not active in a model, linked clones should be stored on the file server in order to uphold the mobility
requirement of the shared modeling environment. However, during linked clone use, location is a critical to usability. As detailed in the experiment in section 3.4, the computing resources required for direct modification of linked clones on a file server exceed those offered by the sampled file server. Thus, location during use must carefully be considered based upon file server capabilities.
If the file server is capable of sustaining reasonable disk throughput when many linked clones are being modified directly from the file server, this is the optimal modification approach. When users save, open, and use their linked clones directly from the file server, this is called the direct modification approach. However, if the file server is not capable of sustaining sufficient disk throughput, the users must save and use their linked clones on each workstation. It is possible to facilitate caching of linked clones on workstations using Windows Offline files or other third party applications; however, it is not difficult for users to copy linked clones selectively to their desktop for use in a modeling session. This approach can be considered a cache-and-update approach. The linked clones must be cached to the workstation before the modeling session, executed on the workstation during the modeling session, and updated on the file server after the modeling session. The other approach, where linked clones are stored and used directly from the file server is called the direct modification approach.
Once the user has created, and possibly cached, the linked clone, using VMware Workstation as their personalized modeling environment is nearly as straightforward as using a traditionally hardware-specific system. See the VMware Workstation documentation for usage instructions (VMware, Inc. 2008b).
3.3
Optimizing Restoration Time
25 modeling environment from a stored state. This process includes the workstation startup, user login, downloading their stored model, and finally reaching a stage where their model is usable. Logically, by reducing the time it takes to restore a model, the user has more time to manipulate and work with the model.
The purpose of this experiment is to determine the amount of time it takes to restore many modeling environments using a traditional restoration technique as well as how long it takes to restore similar modeling environments using two variants of the differential virtualization approach. By manipulating restoration approach and workstation operating system, one can determine how the dependent variable of restoration time is affected.
In this experiment, the model environments are pre-configured and saved for a number of
simulated users ranging from one to sixty. The models are set to automatically login and execute a startup script. This script will write a file to the file server in the folder specific to the
workstation. Therefore, by noting the time that the systems started and automatically creating a file when the model is operational, one can understand how the restoration time changes with respect to the number of model environments for each restoration approach and configuration. With intent to correlate component ability with restoration time, the performance of the file server is measured during restoration experiments; specifically, the disk operations per second, disk bytes per operation, disk queue length, and network bytes transferred per second.
There are many assumptions for this experiment. Restoration time is considered in this
26 The Ghost images and linked clones used in this experiment are Windows 2003 Server based with no user-specific modifications other than the small scripts to automate the experiment for the purposes discussed in the previous section.
In order to automate the experiment, certain pre-experiment configurations are necessary. IP addresses are unique per physical workstation. A DHCP server assigns specified IP addresses to workstations based on the MAC address of the workstation’s physical hardware. A unique domain user account exists for each workstation. Each domain user account has full access control of exactly one folder on the file server. In this folder, there exists a Ghost image and a linked clone. For the ease of this experiment, all domain users can read these folders. Next, the workstations are configured such that they first attempt to boot from a network location and then the local disk. The sample laboratory has eighty workstations and some are not available due to configuration errors or hardware issues. Therefore, at most sixty models are used in this
experiment.
To illustrate how restoration time changes with different approaches and configurations, three heat sizes, one, thirty, and sixty, are designated. The size of the heat is representative of the number of unique systems modeled in the environment. Therefore, a heat with a size of sixty signifies the use of sixty workstations to achieve sixty unique modeled systems. This is analogous to sixty users each modeling a unique single operating system. Three restoration approaches are considered: Symantec Ghost system imaging, Windows Vista based cached differential virtualization, and Windows XP based cached differential virtualization. In all configurations, Windows Server 2008 is used as the operating system executing on the file server. Effectively, this experiment is a cross-sectional survey with nine resulting datasets.
27 Ghost imaging approach while 59 others simultaneously restored. A simple script, called
batchanalyze.ps1, was written to perform basic data analysis a comma-delimited database using this schema. For longevity, the result database is included in appendix 7.1, on page 44.
traditional,60,maul101,8935.3245675
Figure 16 – Restoration experiment result record example
At the beginning of the test, each workstation is pre-configured and powered off. To start the test, a script called starttest.ps1 is executed on the file server. This script gathers input regarding the test type and heat size. Upon input, the script notes the time and in quick succession, the specified number of workstations are manually powered on. Starting the workstations will continue down one of three avenues:
1. Automatic imaging using Symantec ghost 2. Windows Vista boot process
3. Windows XP boot process
The traditional preparation technique uses Symantec Ghost to restore a single operating system to a single physical machine. In order to automate the imaging process, a special PXE boot image was created. Since the workstations are configured to boot from the network, once the workstation starts, it downloads and executes this special PXE boot image. The special PXE boot image loads DOS, loads necessary drivers and maps a network folder based on the IP address of the workstation. Then, each workstation downloads a unique Ghost image from the file server to its local disk. It is crucial that each workstation reads a separate Ghost image in order to simulate a realistic restoration process. When two users restore their unique
environment, they are reading a distinct set of files, not the same set. Therefore, each workstation will copy a unique Windows 2003 R2 image to their hard drive and reboot. On startup, a local user will automatically login and execute a script. This script will map a network drive based on the IP address of the workstation and write a file to that network drive as
described earlier.
28 these tests, workstations are domain-joined and configured to auto-logon based upon the name of the workstation. When the workstation starts, the domain user specific to that workstation automatically performs the logon process and their network folder maps to Z:\. Then, a script empties the user’s desktop, copies the linked clone from Z:\ to the user’s desktop, and starts the linked clone. Further, once the linked clone starts, the same script runs a script inside the clone that writes the file to the workstation-specific folder on the file server.
3.4
Direct Modification Characterization
As described earlier, an optimal environment is one where linked clones are modified directly on a file server, not one that uses the cache-and-update approach. In the first heat of size sixty for differential virtualization, the direct modification approach was utilized. Unfortunately, it was quickly apparent that the tested file server would not support many simultaneously operating linked clone virtual machines. This section analyzes the requirements for an environment where direct modification is the primary approach when manipulating linked clones from a file server.
The purpose of the direct modification experiments is to determine requirements for executing linked clones from network storage services. Clearly, after discovering that the file server in used in the restoration experiment could not support sixty direct modifications, this behavior requires further research.
In the experiments outlined in section 3.3, network utilization never reached its theoretical upper limit. Even in the XP restoration experiment, when a maximum of 58,190,595 bytes per second transferred through the network adapter, the adapter only reached roughly 11% utilization of its 4Gbit bandwidth. It is assumed that the storage solution is a limiting hardware piece of the IO path. Since it is assumed that the storage solution is the problematic component in the IO path, the data gathering and analysis is limited to primarily statistics of the file server disk. Further, the model operating systems are limited to just Windows Sever 2003.
In this experiment, hardware performance statistics are gathered using Windows Performance Monitor while one or many virtual machines are created, opened, or closed using the direct modification approach. First, the restoration time experiment is attempted using direct
29 statistics are gathered. Then, in another test, the linked clone is shutdown and performance statistics are gathered. Finally, in the last test, the linked clone is started for a second time, simulating a restoration, and the performance statistics are gathered. Thus, as a result, there are four Performance Monitor data sets. One set from which analysis will show how many attempts to utilize the direct modification approach affect the file server’s resources. While, from the other three sets, analysis will show how specific actions on a single direct modification of a linked clone affect the file server’s resources. Finally, a performance correlation is attempted between a single direct modification and many direct modifications.
3.5
Workstation Capabilities
Until now, experiments have focused on differential system modeling using a single model per workstation. However, virtualization plays a major role in this research because it facilitates the operation of multiple models per workstation. The purpose of this experiment is to determine the capabilities of workstations regarding the execution of virtual machines.
Firstly, it is assumed that users can intelligently manage resources allocated to each virtual machine. In this modeling environment, the user has full control of their virtual machines; therefore, the user must set reasonable resource limits for their virtual machines. The user must understand that the workstation has a finite amount of disposable resources and that the
workstation operating system requires a portion of those resources. It is not assumed that there exist precise resource limits but rather that the user can gauge usability within a model on a per-model basis. For example, if a user runs a Windows Server 2003 virtual machine with 92MB of memory and they are unable to run more than a few programs inside the virtual machine, the user
should gather that the virtual machine might benefit from an increase in virtual memory.
30 This experiment is straightforward; using XP and Vista, multiple virtual machines are launched on one workstation and ensure that each virtual machine is responsive. Table 1 below details the amount of virtual memory allocated to each virtual machine for this experiment.
Virtual Machine Memory Allocation
Windows Server 2003 384MB Windows XP Professional 512MB CentOS 5.1 Server 384MB
31
4
Results and Analyses
The logical services required to support a multi-user, shared, workstation-based modeling environment greatly enhance the network from a management and usability standpoint.
Administrators can easily update model templates and can restrict access on a user or role-based level. Users are able to move between workstations without worrying about hardware
dependency. It is crucial for an administrator to understand the purpose and configuration intricacies each component and process. When compared to an environment that supports modeling via traditional full-system based imaging, this environment has the same essential services. The addition of Windows Deployment Services in the researched environment is a complex process to learn. However, it is no different from learning the complex traditional imaging process. In the researched environment, differential modeling reduces the amount of user-specific data; thus, the overall storage requirements are decreased. In both the traditional approach and the researched approach, a significant amount of managerial tasks exist including maintain workstation images, maintaining models, and maintaining the network services. In the researched approach, models are built once; whereas, in the traditional approach, the models are hardware-specific and must be recreated when hardware changes. For those reasons,
management in the researched environment requires less attention than management in the traditional environment. The remainder of this chapter presents results and analysis for the three experiments described in chapter 3.
4.1
Optimizing Restoration Time
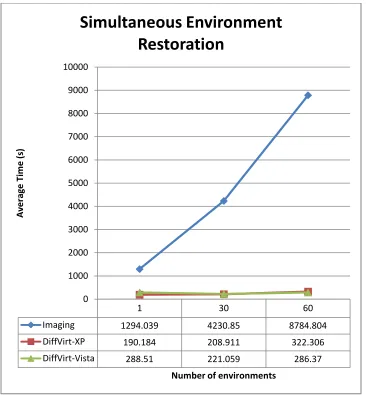
The imaging restoration approach costs more than two hours longer than the differential
32 Figure 17 – Simultaneous restoration of models
While the experiment seeks a specific number of result files, this goal was not met during each heat. For example, in the Vista based restoration approach, less than all of the linked clones properly executed their startup script. The logon script used in the Vista test was not as effective as the script used in the XP test. The script used in the XP test, diffVirtResult.ps1 in appendix 7.2 on page 48, passes the workstation name as a parameter to the vmrun.exe
runprograminguest command; whereas the script used in the Vista test utilized
renamefileinguest and then runprograminguest. The vmrun.exe renamefileinguest
command did not consistently function. Therefore, the Vista test yields a less accurate representation of restoration time than the XP test and the remainder of analysis will focus on describing the differences between the imaging and XP approaches. Even though the actual
1 30 60
Imaging 1294.039 4230.85 8784.804
DiffVirt-XP 190.184 208.911 322.306
DiffVirt-Vista 288.51 221.059 286.37
0 1000 2000 3000 4000 5000 6000 7000 8000 9000 10000
A
ve
rag
e
Ti
m
e
(
s)
Number of environments
33 number of result files does not equal the number of expected files; the expected number of linked clones successfully restored and started. Table 2 details the actual number of result files
generated for each heat. The Vista based differential virtualization test has significantly lower actual reports in the thirty- and sixty-sized heats whereas the imaging tests have slightly lower actual reports.
Expected 30 60
[image:43.612.209.380.187.249.2]Actual Imaging 29 57 Actual DiffVirt-XP 30 60 Actual DiffVirt-Vista 20 31
Table 2 – Expected versus actual reports from restoration experiments
Statistics were gathered regarding the server hardware performance using the Windows Performance Monitor during the restoration tests for a ten-minute period. In Table 3, the
relevant statistics gathered during the XP restoration test with sixty modeled systems are shown. In Table 4, the statistics gathered during the imaging restoration test with sixty modeled systems are shown.
Item (per sec) MAX AVG TOTAL % SUM
Disk Reads 866 560 110,336 99.96
110,385 Disk Writes 4 0 49 0.04
Disk Read Bytes 55,836,846 30,528,474 6,014,412,431 99.99
6,014,756,007
Disk Write Bytes 28,673 1,744 343,576 0.01 Disk Queue Length 39 20.9949
Network Sent Bytes 58,190,595 25,888,362 2,200,510,747 98.87
[image:43.612.64.545.383.664.2]2,225,584,540 Network Received Bytes 900,447 288,205 25,073,794 1.13
Table 3 – Performance statistics during the XP restoration with sixty models
Item (per sec) MAX AVG TOTAL % SUM
Disk Reads 1,000 721 431,661 100.0
431,661 Disk Writes - - - 0.00
Disk Read Bytes 32,450,628 23,350,984 13,987,239,500 100.0
13,987,239,500
Disk Write Bytes - - - 0.00
Disk Queue Length 18 15.2733 - - - Network Sent Bytes 33,759,377 25,898,157 3,599,843,808 91.05
3,953,833,288 Network Received Bytes 3,275,002 2,510,564 353,989,479 8.95
Table 4 – Performance statistics during the imaging restoration with sixty models
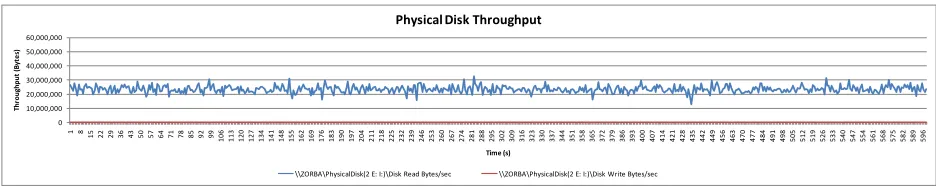
ten-34 minute period containing the entire test. Recall that the XP restoration test with sixty models took less than ten minutes in its entirety. Therefore, just the relevant data for the XP restoration test from the period where the file server had disk activity, 0:57 – 4:13, is of interest. The following two figures, Figure 18 and Figure 19, show, in line charts, the disk statistics for file server during the XP restoration and imaging restoration experiments, respectively.
Figure 18 – Disk throughput during XP restoration with sixty models
Figure 19 – Disk throughput during imaging restoration with sixty models
It is easy to categorize three stages of the XP restoration experiment when the throughput is represented in this fashion. The first minute, the workstations are powering on. For the four minutes where disk reads are apparent, the workstations copy linked clones to their local disk. Finally, the last half of the chart shows no activity – there is no interaction with the file server once the workstation caches its linked clone. The charted imaging throughput statistics shows a consistent amount of disk activity on the file server during the entire ten-minute gathering
period. Further, one can also see that the disk does not deliver as high of a throughput during the imaging restoration as it does in the XP restoration.
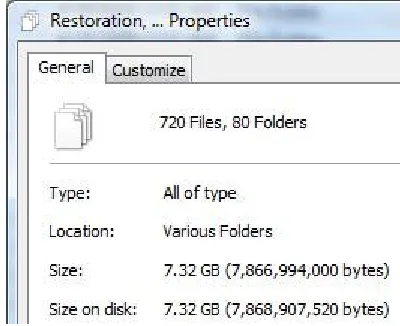
Since linked clones are, by definition, much smaller than full system images, the amount of unique, yet similar, data transferred during the imaging restoration experiment considerably larger. The following two figures, Figure 20 and Figure 21, show the sizes of eighty linked clones and eighty Ghost images, respectively. Note that in this instance, each linked clone is
0 10,000,000 20,000,000 30,000,000 40,000,000 50,000,000 60,000,000
1 8 15 22 29 36 43 50 57 64 71 78 85 92 99
106 113 120 127 134 141 148 155 162 169 176 183 190 197 204 211 218 225 232 239 246 253 260 267 274 281 288 295 302 309 316 323 330 337 344 351 358 365 372 379 386 393 400 407 414 421 428 435 442 449 456 463 470 477 484 491 498 505 512 519 526 533 540 547 554 561 568 575 582 589 596
Thr ou ghp ut ( B yt e s) Time (s)
Physical Disk Throughput
\\ZORBA\PhysicalDisk(2 E: I:)\Disk Read Bytes/sec \\ZORBA\PhysicalDisk(2 E: I:)\Disk Write Bytes/sec
0 10,000,000 20,000,000 30,000,000 40,000,000 50,000,000 60,000,000
1 8 15 22 29 36 43 50 57 64 71 78 85 92 99
106 113 120 127 134 141 148 155 162 169 176 183 190 197 204 211 218 225 232 239 246 253 260 267 274 281 288 295 302 309 316 323 330 337 344 351 358 365 372 379 386 393 400 407 414 421 428 435 442 449 456 463 470 477 484 491 498 505 512 519 526 533 540 547 554 561 568 575 582 589 596
Thr ou ghp ut ( B yt e s) Time (s)
Physical Disk Throughput
[image:44.612.73.541.315.408.2]35 approximately 0.091GB (93MB) versus the 3GB of a Ghost image. Recall that these models are only slightly modified from the model template – modifications consist of installing scripts to automate the test. The differential nature of linked clones is the contributor to the stark size difference in these models.
Figure 20 – Size of eighty distinct linked clones Figure 21 – Size of eighty distinct Ghost image
Therefore, by using cache-and-update differential virtualization, less time is required for the model restoration phase. Further, given an environment comparable to the sampled
environment, a cache-and-update restoration and archival approach consistently yields high throughput as the number of models increases. In restoration, when caching is occurring, the disk throughput is characterized by nearly all read operations.
4.2
Direct Modification Characterization
Firstly, the direct modification approach to restoration in this experiment uses the same
experimental design from section 3.3. In this instance, however, only eighteen models reported in the ten minutes, with an average restoration time of approximately 371 seconds (this data is in the Restoration Result Database in appendix 7.1 on page 44 as diffvirt-vista,70-17). After ten minutes, the usability of the ―operational‖ models was very low – one could not even click a button inside the model because the virtual mouse would not respond. Since the high-level requirement of usability did not exist, perhaps low-level performance measurements reveal a cause for low usability. The performance data gathered for a ten-minute period during a Vista restoration test with sixty modeled systems using the direct modification approach are
[image:45.612.329.533.167.325.2]36
Item (per sec) MAX AVG TOTAL % SUM
Disk Reads 197 75 45,151 43.97
102,678 Disk Writes 139 96 57,527 56.03
Disk Read Bytes 3,559,645 1,043,720 625,188,450 49.86
1,253,883,296
Disk Write Bytes 2,481,341 1,049,574 628,694,846 50.14 Disk Queue Length 18 10.2300
Network Sent Bytes 3,066,858 1,552,146 215,748,251 66.48
[image:46.612.68.547.72.199.2]324,536,118 Network Received Bytes 1,351,262 771,545 108,787,866 33.52
Table 5 – Performance statistics during the direct modification restoration with sixty models
[image:46.612.74.541.478.569.2]The sum of disk throughput, at approximately 1.2 billion bytes, for the ten-minute period described in Table 5 is much lower than the sum of the disk throughput, at approximately 6 billion bytes, in the XP cached restoration approach (see Table 3, page 33). But, why? One possibility is that the file server cannot handle reading and writing operations in this capacity since the direct modification approach, in this capacity, has a read-to-write ratio of nearly one, whereas in the XP cached restoration approach it was nearly 100 (see Table 3, page 33). Another reason is that maybe the file server hardware cannot handle writing in this capacity. Figure 22, below, helps us to compare the read versus write operation throughput during the ten-minute direct modification test with sixty models by showing the percentage of disk reads or writes per second. The bottom area (blue) represents the read bytes per second while the top area (red) represents the write bytes per second. One can loosely see that more the linked clones read more bytes in the beginning of the ten-minute period whereas, in the end, they wrote more bytes.
Figure 22 – Disk throughput during direct modification restoration with sixty models
Thus, one might gather that while read throughput exceeds the write throughput, linked clones more easily operate directly from the file server. Yet, when the write throughput exceeds the read throughput, the total disk throughput decreases causing linked clone usability and operation to diminish. However, it is likely that this analysis is sample-specific. One cannot easily
extrapolate this characteristic to other storage systems without similar testing utilizing the other hardware. 0% 20% 40% 60% 80% 100%
1 8 15 22 29 36 43 50 57 64 71 78 85 92 99
106 113 120 127 134 141 148 155 162 169 176 183 190 197 204 211 218 225 232 239 246 253 260 267 274 281 288 295 302 309 316 323 330 337 344 351 358 36