Int. J. Electrochem. Sci., 12 (2017) 386 – 395, doi: 10.20964/2017.01.67
International Journal of
ELECTROCHEMICAL
SCIENCE
www.electrochemsci.org
Synthesis and Electrochemical Properties of
0.7LiMn
0.71Fe
0.29PO
4·0.3Li
3V
2(PO
4)
3/C Composite as
High-Performance Cathode Materials for Lithium-Ion Batteries
XinYu Wang1, Zhi Su1,*, ShanShan Li2
1 College of Chemistry and Chemical Engineering, Xinjiang Normal University, Urumqi 830054,
Xinjiang, China
2 Bayingol Vocational and Technical College, Korla 841000, Xinjiang, China *E-mail: suzhixj@sina.com
Received: 7 September 2016 / Accepted: 23 November 2016 / Published: 12 December 2016
A new polyanionic composite cathode materials, 0.7LiMn0.71Fe0.29PO4·0.3Li3V2(PO4)3/C, was
synthesized using a novel sol-gel method and with N,N-dimethyl formamide (DMF) as solvent. X-ray diffraction and transmission electron microscopy results indicated that the composite material was well-crystallized and a conductive carbon matrix surrounded the 0.7LiMn0.71Fe0.29PO4·0.3Li3V2(PO4)3/C particles of grain size 20–50 nm. Elements Mn, V, and Fe in
the composite were confirmed to be in +2, +3, and +2 valence states, respectively, by X-ray photoelectron spectroscopy. Electrochemical tests showed that as a cathode material, 0.7LiMn0.71Fe0.29PO4·0.3Li3V2(PO4)3/C exhibited the best reversible capacities of 152.5, 130.1, 123.6,
109.5, and 83.6 mAh·g-1 at charge/discharge rates of 0.05, 0.1, 0.2, 0.5, and 1 C, respectively. It also retained 147.2 mAh·g-1 (91.8%) capacity in the Li-ion battery after 50 cycles at 0.05 C.
Keywords: lithium-ion cathode materials ; composite; sol-gel; nanoparticle; electrochemical properties
1. INTRODUCTION
the effect of Jahn-Teller lattice distortions of Mn3+ also leads to poor cycling stability. In order to overcome these problems of LMP/C, strategies such as carbon coating, ion doping, and compounding with other materials have been implemented [4-8].
One of these other materials is LiFePO4/C (LFP/C). It has good electrical conductivity, and
reports have indicated that it can improve the properties and cycle characteristics of other LMP/Cs. Ye et al. demonstrated an improved discharge capacity of 149.2 mAh·g-1 at 0.1 C rate in
LiMn0.9Fe0.1PO4/C [9]. Liu et al. reported that LiFePO4/C with size-controlled showed good rate
performance, with an initial capacity of 157.0 mAh·g-1 at 0.2 C [10]. Ma et al. synthesized
Graphene-LiFePO4/C showed the initial charge/discharge capacity at 0.1 C is 141 mAh·g-1 [11].
A third material , Li3V2(PO4)3/C (LVP/C),[12,13]shows a much higher Li+ migration rate
owing to the open 3D framework of LVP. Encapsulation and composition with LVP [14-18] and V-doping [19] have been studied to improve the electrochemical performance of other LMP/Cs. Yang et al. prepared LiFePO4·Li3V2(PO4)3/C and found that the conductivity of LFP/C was greatly enhanced
by the introduction of Li3V2(PO4)3/C [20]. Recently, Nevertheless, the exact effect and mechanism of
LMP/C doping and/or compositing with dopants remain unknown.
Based on Our previous research [21-23], in this paper we design and synthesize the composite material 0.7LiMn0.71Fe0.29PO4·0.3Li3V2(PO4)3/C by a new sol-gel method that employed DMF as a
solvent to control the particle size. The prepared composite was systematically compared to the single component LMP/C, and the binary composite LiMn0.71Fe0.29PO4 (0.71LMP·0.29LFP/C) in terms of
structure and electrical performance. As an electrode material, the 0.7LiMn0.71Fe0.29PO4·0.3Li3V2(PO4)3/C composite exhibited good electrochemical performance and
high energy density.
2. EXPERIMENTAL
In this research all reagents were used directly without further depuration.
2.1 Synthesis
First, V2O5 (0.55 g) was dissolved in 8 mL H2O2 (30%), and glucose, the carbon source for
carbonization were dissolved in 40 mL DMF. Then, Mn(CH3COO)2·4H2O (1.23 g),
Fe(CH3COO)2·4H2O (0.49 g), CH3COOLi·2H2O (1.12 g), and H3PO4 (85 wt.%) according to
stoichiometric ratio were dissolved in 50 mL DMF. Then the two solutions were mixed and stirred to form a sol that was dried at 80 °C for 8 h to obtain a gel. It was calcinated at 700 °C for 12 h under Ar before cooling back to ambient condition. the 0.7LiMn0.71Fe0.29PO4·0.3Li3V2(PO4)3/C composite was
2.2 Characterization
X-ray studies of the phase identities of the well-prepared samples were done on X-ray diffraction (Bruker D2) using Cu Ka radiation at 30 kV and 10 mA. The crystal morphology was characterized by transmission electron microscopy (FEI Tecnai 20) at 200 kV. The valences of Fe, Mn and V in 0.7LiMn0.71Fe0.29PO4·0.3Li3V2(PO4)3/C were determined by X-ray photoelectron
spectroscopy ( ESCALAB 250Xi). .
2.3 Electrochemical Analysis
The electrochemical performance of materials were carried out by preparation into the coin-type half cells (LIR 2025) in glove box under Ar environmental protection. The cathode materials were composed of acetylene black, a poly (tetra uoroethylene)binder, and a mixture of the synthesized materials in a 5 : 15 : 80 weight ratio.While lithium metal was used as reference electrodes, and the electrolyte was 1 M LiPF6 dissolved in ethyl methyl ethylene carbonate, ethylene carbonate and
dimethyl carbonate with a 1:1:1 volume ratio.
The charge and discharge experiments were conducted under ambient condition by using a battery test system LAND CT2001A (Wuhan, China) between 2.5 and 4.4 V. Cyclic voltammetry (CV) was made on LK2005A (China, Tianjin) electrochemical workstation in the potential ranges of 2.5–4.3 V at a scan rate of 0.1 mV·s-1 under ambient condition. Electrochemical impedance
spectroscopy (EIS) measurement was conducted by using Zahner IM6ex electrochemical workstation over a frequency from 10 Hz to 100 kHz with sinusoidal signal of 5 mV between the working and reference electrodes
3. RESULTS AND DISCUSSION
Fig. 1 displays the XRD patterns of three as-prepared composite samples. The Li3V2(PO4)3·LiMn0.67Fe0.33PO4/C composite material consists of olivine structure LiFe0.5Mn0.5PO4
(PDF no. 42-580) and monoclinic formation Li3V2(PO4)3 (PDF no. 47-0107). Due to the LiMnPO4 and
LiFePO4 were homogeneous heterogeneous materials and formed a new solid solution with the same
structure; thus, the solid solution and LVP did not generate a new compound, so no peaks corresponding to impurities were observed. The carbon contents in LMP/C, 0.71LMP·0.29LFP/C and 0.7LiMn0.71Fe0.29PO4·0.3Li3V2(PO4)3/C were 6.3,7.1 and 6.8% as measured by elemental analysis.
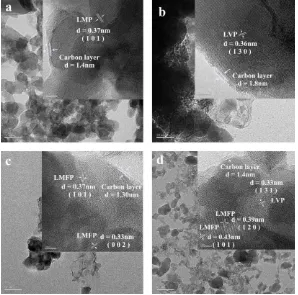
The TEM and HRTEM images of the prepared materials are shown in Fig. 2. The LiMnPO4/C,
Li3V2(PO4)3/C, ·LiMn0.71Fe0.29PO4/C and 0.7LiMn0.71Fe0.29PO4·0.3Li3V2(PO4)3/C contained small
0.43, 0.39 and 0.33 nm in Fig.2d are on the lattice planes (101), (120), and (131) of LiFe0.71Mn0.29PO4
and LVP in the composite 0.7LiMn0.71Fe0.29PO4·0.3Li3V2(PO4)3, respectively. Therefore, the target
material was verified as a composite of the LiFe0.67Mn0.33PO4/C and the Li3V2(PO4)3/C [24]. And
particles in all the samples were coated with a nanocarbon mesh, which served as a good electronic conduction network [25].
10 20 30 40 50 60 70
0.71LMP0.29LFP/C
0.7LiMn
0.71Fe0.29PO40.3Li3V2(PO4)3/C LVP/C
2()
Intens
ity
(a
.u.
)
LMP/C
PDF#33-0803
Figure 1. XRD patterns of the three samples (0.7LiMn0.71Fe0.29PO4·0.3Li3V2(PO4)3/C,
0.71LMP·0.29LFP/C and LMP/C.)
Figure 2. TEM and HRTEM images of (a) LiMnPO4/C,(b) Li3V2(PO4)3/C, (c) LiMn0.71Fe0.29PO4/C
[image:4.596.185.415.184.364.2] [image:4.596.150.448.423.718.2]
The valence states of V, Fe, and Mn in Li3V2(PO4)3·LiMn0.67Fe0.33PO4/C are studied through
XPS, with the wide-range spectra shown in Fig. 3a. The Li1s, P2p, and O1s binding energies are about 56.06, 134.94, and 532.06 eV, respectively, which are consistent with the literature values [26]. In Fig. 3b, 3c, and 3d, the spectra of Mn2p, V2p, and Fe2p each can be split into two peaks, implying that the valences of Mn, V, and Fe in the composites are +2, +3, and +2, respectively[27,28]. These results further indicate that LFP, LVP, and LMP coexist in the composite material.
7
Figure 3. Wide-range XPS spectra of 0.7LiMn0.71Fe0.29PO4·0.3Li3V2(PO4)3/C, with separate energy
regions corresponding to (b) Fe 2p, (c) V 2p, and (d) Mn 2p.
Fig. 4 initials the original charge/discharge profiles of all materials between 2.5–4.4 V. Not surprisingly, the discharge performance of LMP/C was poor (96.8 mAh·g-1, curve a). In the
0.7LiMn0.71Fe0.29PO4·0.3Li3V2(PO4)3/C composite (curve c), the discharge capacity increased to 156
mAh·g-1, likely due to the smaller particle size, which enlarges the reaction area and improves the
utilization of the active material. The discharge performance of the 0.7LiMn0.71Fe0.29PO4·0.3Li3V2(PO4)3/C composite is higher than the LiMn1/3Fe1/3Co1/3PO4/C
composite in the study by Xiong et al [29]. Moreover the characteristic plateaus of LMP/C disappeared in 0.7LiMn0.71Fe0.29PO4·0.3Li3V2(PO4)3/C, and a slow plateau at 3.5–4.0 V appeared due to the merger
of plateaus from LVP/C and LMP/C.
The composite 0.7LiMn0.71Fe0.29PO4·0.3Li3V2(PO4)3/C also demonstrated good cyclic stability
[image:5.596.97.501.187.496.2]
and 50th cycles at the 0.05 C rate for are shown in Table 1. And the 0.7LiMn0.71Fe0.29PO4·0.3Li3V2(PO4)3/C composite material represented obvious improvements in the
[image:6.596.106.493.137.420.2]matter of the average voltage, energy retention rates and energy density.
[image:6.596.55.555.479.673.2]Figure 4. The first charge-discharge curves of all materials at 0.05 C.
Figure 5. (a)Cycle performance of prepared composites tested under 0.05C (b) Rate capability of the prepared materials
Compared to the 0.95LiMn0.95Fe0.05PO4·0.05Li3V2(PO4)3/C composite material, the capacity
It has the highest discharge energy density (537.28 W·kg-1 vs. 360.79 W·kg-1 in LMP/C), and retention rate (95.6%) after 50 cycles. These results indicate that the 0.7LiMn0.71Fe0.29PO4·0.3Li3V2(PO4)3/C
composite exhibits improved cycling stability. Fig. 5b shows the cycle performances of all sample materials at 0.05, 0.1, 0.5, and 1 C rates. Again, the cycle performance of 0.7LiMn0.71Fe0.29PO4·0.3Li3V2(PO4)3/C is much better than all other materials and at all the charge
rates. At 1 C, 0.7LiMn0.71Fe0.29PO4·0.3Li3V2(PO4)3/C exhibited an excellent capacity of 100 mAh·g-1,
whereas LMP/C showed only 79.3 mAh·g-1. In addition, 0.7LiMn0.71Fe0.29PO4·0.3Li3V2(PO4)3/C
[image:7.596.35.572.268.394.2]showed a lower polarisability than LMP/C, especially at high C-rates, thereby demonstrating improved electrochemical performance.
Table 1. Energy densities and discharge capacities of the materials, at first and 50th cycles.
Sample
Discharge capacity Average
Voltage Discharge energy The particle
size (nm) (mAh•g-1)
(V) (W/kg)
1st 50th C.R.
(%)a 1st 50th 1st 50th
C.R. (%)b
LMP/C 96.8 90.2 93.2 4.01 3.99 388.17 360.79 92.9 50-70 0.71LMP·0.29LFP/C 113.2 107.1 94.8 4.00 4.00 452.80 428.40 94.6 25-35 0.7LiMn0.71Fe0.29PO4·0.3Li3V2(PO4)3/C 156.0 147.2 91.8 3.6 3.65 561.60 537.28 95.6 10-20
a C.R.:capacity retention ratios compared to the first cycle, b C.R.: energy retention ratios
Figure 6. CV curves of (a) LMP/C, (b) 0.71LMP·0.29LFP/C (c)
0.7LiMn0.71Fe0.29PO4·0.3Li3V2(PO4)3/C, and (d) 0.7LiMn0.71Fe0.29PO4·0.3Li3V2(PO4)3/C over
[image:7.596.62.505.434.747.2]
The CV curves of all materials electrodes are shown in Fig. 6a–c. For LMP/C (Fig. 6a), the redox potential peak at around 4.34/3.85 V, in accord with the oxidation of Mn2+ to Mn3+.
The redox peaks of LMP/C and LFP/C were observed in 0.71 LMP·0.29LFP/C in Fig. 6b. The CV results of 0.7LiMn0.71Fe0.29PO4·0.3Li3V2(PO4)3/C revealed four clear couples of redox peaks (Fig.
6c). The redox peaks at 3.61/3.51V, 3.69/3.63V and 4.10/4.02V tally with V4+/V3+, whereas the weak couple at 4.18/3.94 V is associated with LMP. Moveover, the redox peak of LFP was not discovered in the 0.7LiMn0.71Fe0.29PO4·0.3Li3V2(PO4)3/C composite material, possibly due to its merger with the
redox peak of LVP at 3.61/3.51V. These results are consistent with the corresponding charge/discharge curves. As shown in Fig. 7d, the curves of the three CV scan cycles almost overlap, indicating high electrochemical reversibility and low polarization. Therefore, CV analysis also confirmed that 0.7LiMn0.71Fe0.29PO4·0.3Li3V2(PO4)3/C possesses great electrochemical properties.
Figure 7. (a) Nyquist plots of all materials and (b) the relationship between Z' and ω-1/2 for different
compositions.
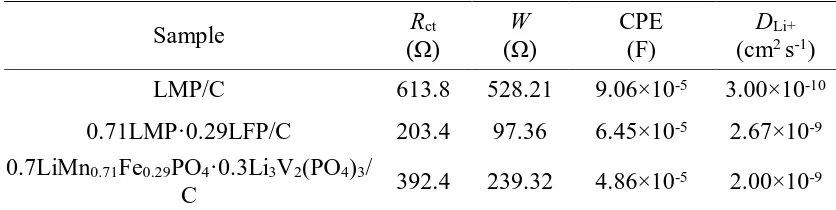
The Nyquist plots of three material electrodes are illustrated in Fig. 7a in the range of 10 Hz– 100 kHz. The measurement was performed in the charged state of 4.1 V after an original cycling at 0.05 C. Fig. 8a shows that the Warburg impedance and charge transfer resistance of the 0.7LiMn0.71Fe0.29PO4·0.3Li3V2(PO4)3/C material are much lower than those of LMP/C, indicating
effectively improved Li extraction and insertion in the former. The parameters acquired by the equivalent circuit simulation of Li+ are listed in Table 2. In Fig. 7b, there is a linear relationship in the low-frequency region between Z' and the square root of frequency (ω-1/2) in all the curves. The Li+
diffusion coefficient (D) is calculated according to the following equation [31] D = (0.5 R2 T2)/(A2 n4F4 C2 σ2) (1)
where T represents the absolute temperature, R represents the gas constant, A represents the surface area of the electrode, F represents the Faraday constant, n represents the number of electrons lost per molecule during oxidization, C represents the molar concentration of Li+, and σ represents the Warburg factor which is related to Z' by:
[image:8.596.54.544.284.473.2]
where Rel and Rct are kinetic parameters independent of frequency, ω represents the angular
frequency in the low frequency region. According to equation (2), σ can be found as the slope in the plot of Z' vs ω-1/2. The diffusion coefficients calculated from equation (1) are listed in Table 3. For 0.7LiMn0.71Fe0.29PO4·0.3Li3V2(PO4)3/C, D = 2.00×10⁻⁹ cm2·s-1, almost six times that of LMP/C
[image:9.596.88.506.227.332.2](3.00×10-10 cm2·s-1). This result that the high performance of the 0.7LiMn0.71Fe0.29PO4·0.3Li3V2(PO4)3/C composite is tally with seen in the battery performance tests.
Table 2. Electrochemical parameters from a.c. EIS results, calculated using Z-view software.
Sample Rct
(Ω)
W (Ω)
CPE (F)
DLi+
(cm2 s-1)
LMP/C 613.8 528.21 9.06×10⁻⁵ 3.00×10⁻¹⁰
0.71LMP·0.29LFP/C 203.4 97.36 6.45×10⁻⁵ 2.67×10⁻⁹
0.7LiMn0.71Fe0.29PO4·0.3Li3V2(PO4)3/
C 392.4 239.32 4.86×10
-5 2.00×10⁻⁹
Note: Rct represents the charge-transfer resistance, W represents the Warburg impedance, and
CPE represents the constant phase element. DLi+ represents Li+ diffusion coefficient.
4. CONCLUSIONS
The 0.7LiMn0.71Fe0.29PO4·0.3Li3V2(PO4)3/C composite material with carbon conductive
network, 0.7LiMn0.71Fe0.29PO4·0.3Li3V2(PO4)3/C, was smoothly synthesized by a new sol-gel method,
with a formulation designed to control the particle size. In Li-ion batteries, the composite material as the active cathode material showed excellent overall cycle stability, with discharge capacities of 156.5 mAh·g-1 at 0.05 C and 90.6 mAh·g-1 at 1 C. EIS and CV analysis results indicate that the composite material can efficiently facilitate Li insertion/extraction. In summary, the composite material 0.7LiMn0.71Fe0.29PO4·0.3Li3V2(PO4)3/C combines the advantages of its three components (LFP/C,
LMP/C, and LVP/C), thereby improving Li+ mobility compared to LMP/C and displaying good electrochemical performance.
ACKNOWLEDGEMENTS
This study was supported by the National Natural Science Foundation of China (No.21661030)
References
1. A.K. Padhi, K.S. Nanjundaswamy and J.B.D. Goodenough, J Electrochem Soc., 144(1997) 1188. 2. J.M. Tarascon and M. Armand, Nature., 414(2001) 359.
3. M.S. Whittingham, Y. Song, S. Lutta, P.Y. Zavalij and N.A.J. Chernova, J Mater Chem., 15(2005) 3362.
5. P.S. Herle, B. Ellis, N. Coombs and L.F. Nazar, Nat Mater., 3(2004) 147.
6. M. Yonemura, A. Yamada, Y. Takei, N. Sonoyama and R.J. Kanno, J Electrochem Soc., 151(2004) A1352.
7. C. Delacourt, L. Laffont, R. Bouchet, C. Wurm, J.B. Leriche, M. Chem Mater., 18(2006) 5520. 8. N. Meethong, H. Huang, S.A. Speakman, W.C. Carter and Y.M. Chiang, Adv Funct Mater.,
17(2007) 1115.
9. F. Ye, L. Wang, X. He, M. Fang, Z. Dai, J Power Sources., 253(2014) 143.
10.Liu, J, Wang, Z, Zhang, G, Liu, Y, and Yu, A. Int J Electrochem Sci., 8(2013)2378. 11.Ma, Y, Li, X, Sun, S, Hao, X, and Wu, Y. Int. J. Electrochem. Sci., 8(2013)2842.
12.H. Liu, G. Yang, X. Zhang, P. Gao, L. Wang, J. Fang and X. Jiang, J Mater Chem., 22(2012) 11039.
13.S.C. Yin, H. Grondey, P. Strobel, H. Huang and L.F. Nazar, J Am Chem Soc., 125(2003) 326. 14.Y.C. Lin, G.T.K. Fey, P.J. Wu, J.K. Chang and H.M. Kao, J Power Sources., 244(2013) 63. 15.F. Wang, J. Yang, Y. NuLi and J.Wang, Electrochim Acta., 103(2013) 96.
16.K. Zaghib, M. Trudeau, A. Guerfi, J. Trottier, A. Mauger, R. Veillette and C.M. Julien, J Power Sources., 204(2012) 177.
17.J. Wang, Z. Wang, X. Li, H. Guo, X. Wu, X. Zhang and W. Xiao, J Alloy Compd., 581(2013) 836. 18.C.S. Yin, S.P. Strobel, H. Grondey and F.L. Nazar, Chem Mater., 35(2004) 1456.
19.G. Yang, H. Ni, H. Liu, P. Gao, H. Ji, S. Roy and X.J. Jiang, J Power Sources., 196(2011) 4747. 20.R.M. Yang, W. Ke and S. Wu, J Power Sources., 165(2007) 646.
21.S. Li, Z. Su, X. Wang, RSC Adv., 5(2015) 80170.
22.Y. Si, Z. Su, Y. Wang, T. Ma, J. Ding, New J Chem., 39(2015) 8971. 23.S. Li, Z. Su , X. Jiang, A. Muslim, Mater Lett., 154(2015) 29.
24.Y. Guo, Y. Huang, D. Jia, X. Wang, N. Sharma, Z. Guo and X. Tang, J Power Sources., 246(2014) 912.
25.J. Mendialdua, R. Casanova and Y. Barbaux, J Electron Spectrosc., 71(1995) 249.
26.Q. Chen, J. Wang, Z. Tang, W. He, H. Shao and J. Zhang, Electrochim Acta., 52(2007) 5251. 27.S. Zhong, L. Wu and J. Liu, Electrochim Acta., 74(2012) 8.
28.S.T. Myung, S. Komaba, N. Hirosaki, H. Yashiro and N. Kumagai, Electrochim Acta., 49(2004) 4213.
29.Xiong, Y, Chen, Y, Zeng, D, Xiao, Q, Li, Z, and Lei, G.. J Nanosci Nanotechno., 16(2016) 465.
30.L. Chen, B. Yan, H. Wang, X. Jiang and G. Yang, J Power Sources., 287(2015) 316. 31.S. Liu, J. Xu, D. Li, Y. Hu, X. Liu and K. Xie, J Power Sources., 232(2013) 258.