Int. J. Electrochem. Sci., 13 (2018) 7598 – 7611, doi: 10.20964/2018.08.75
International Journal of
ELECTROCHEMICAL
SCIENCE
www.electrochemsci.org
Preparation and Properties of SeO
2and PWA Binary
Compound Doped SPEEK Proton Exchange Membranes
Zhicai He1,† ,*, Zhengping Zhao2,†, Chenyu Pan3, Lixin Xue3, Mingqiang Zhong3
1 College of medicine and chemical engineering, Taizhou University, Taizhou 318000, China 2 Zhijiang College, Zhejiang University of Technology, Hangzhou 310014, China
3 College of Materials Science and Engineering, Zhejiang University of Technology, Hangzhou
310014, China
†
Co-first author
*E-mail: hezhicai@tzc.edu.cn
Received: 12 March 2018 / Accepted: 19 June 2018 / Published: 5 July 2018
Herein, we prepared proton exchange membranes by adding SeO2 and phospho-wolframic acid (PWA)
into DS 85 wt% sulfonated polyether ether ketone (SPEEK). The result indicates that their proton conductivity is increasing without decrease of their methanol permeability. SeO2 has a "V" type of
lattice which provides favorable channels for proton transfer. The structures of composite membranes had changed in the chemical reactions. The characteristic peaks of Keggin in PWA appeared in infrared spectrum, but some peaks disappeared in X-ray diffraction pattern. Moreover, the result reveals that their proton conductivities is gradually increasing. After treated with an 8 T high magnetic field at 120℃ for 10 h, the composite membranes showed anti-magnetic property. The thermal performance of composite membranes with SeO2 and PWA molar ratio of 2:1 increased obviously.
Keywords: Electrochemical properties, SeO2, PWA, Binary compound doped
1. INTRODUCTION
In order to promote the green development, cyclic development and low-carbon development deemed as the main task, which improves the energy utilization rate and promote the clean energy development, have become the inevitable trend of scientific research. Direct Methanol fuel cell (DMFC) is a high-efficiency power generation device that directly converts chemical energy into electrical energy with energy conversion efficiency of about 70%. The byproducts of energy transformation are mainly water and carbon dioxide (CO2) without any pollution. It is obvious this
Proton exchange membrane fuel cells (PEMFCs) have attracted increasing attention because of their special properties, such as lower temperature characteristics. Considering its features of few chemical hazards to the human body and even harmless to the environment, it is suitable for wide applications in daily life.[4]. Triad membrane electrode (TME) is the core component of PEMFC, which combined by negative, positive electrode and proton exchange membrane with hot pressing [5-6]. Scientific researchers have never stopped the study of proton exchange membranes in the long-term exploration of PEMFC. From the point of materials applications, proton exchange membranes as the core element of TME are mainly from the aspects of conducting proton property, chemical stability and mechanical properties. In the late 1960’s, polystyrene sulfonic acid membrane had been used in PEMFC [7]. However, styrene sulfonic acid as a proton exchange membrane material still has some serious drawbacks, for example, it is prone to degradation during use, which directly leads to shortened battery life and reduced power density, and causes the formation of water in the battery to be contaminated leading to limit application in astronauts. With the progress of science and technology, fuel cell technology is constantly updated, and the development of proton exchange membrane fuel cell is durability test of the proton exchange membrane. Until now, the most commonly used proton exchange membrane (PEM) is still the perfluorinated sulfonic proton exchange membrane (Nafion) produced by Du Pont Company in 1962. Although the Nafion membrane solves many problems with the styrene sulfonic acid proton exchange membrane, it still increases the service life of the fuel cell. Besides, the research and development of fuel cell technology have not been popularized for decades. In addition to the well-known stability, it has also been urged on such issues as durability and high cost, which are bottlenecks encountered in commercialization. To actively develop new materials is the only way to solve this big challenge, which is also the hotspot of proton exchange membrane fuel cell research [8-9].
At present, materials used as proton exchange membrane materials are mainly divided into perfluorinated sulfonic acid and the fluorine-free sulfonic acid. Fluorine-free sulfonic acid membrane not only low cost, but also the environmental pollution is relatively small, is the proton exchange membrane development trend [10]. Among many fluorine-free sulfonic acid membrane materials, SPEEK geomembrane has attracted much attention due to its excellent diamagnetic resistance, excellent mechanical properties, good thermal properties and high electrical conductivity.The proton conductivity of SPEEK membranes with moderate, high mechanical strength, thermal stability, relatively low cost and the methanol permeability coefficient is lower than that of current commercial Nafion membrane, which is considered to be a relatively potential candidates to replace nafion membrane materials. Currently, the study of sulfonated polyether ether ketone has preliminary results from synthetic to modification are the hot research topic. However, it is almost possible to achieve ideal level because of the guide protons and resistance performance of alcohol limit[11-15]. SeO2 has
the different lattice structures with PWA, which provides the different mechanism for the proton conduction.
In this paper, the SPEEK composite membranes with DS of 85% were prepared with binary doping SeO2 improving its methanol resistance and anti-swelling property and and PWA increasing the
2. EXPERIMENTAL SECTION
2.1 The preparation of binary doped membranes
The trituration SPEEK85 resin soluble in DMAc solvent to mixture 10 wt.% solution. Stir in size 100 nm SeO2 and powder for 24 h to make SeO2 dispersed evenly in the SPEEK solution. Then, a
certain amount of acetone and PWA were added, stirring the membrane liquid for 2-4 h and ultrasonic treatment for 1-2 h, making SeO2 and PWA dopant further evenly dispersed in the liquid system of
SPEEK membranes. The molar ratio of SeO2 and PWA are 1:1 and 2:1 respectively, and the total
[image:3.596.89.509.350.541.2]amount of doping respectively 5 wt.%, 10 wt.% and 15 wt.%. Using pipette measured 13 ml of liquid membrane and casting in a clean glass to cavity flow film, and drying under 50℃ for 24 h. After drying for 4 h under 120℃ and natural cooling to room temperature, a small amount of deionized water in the vitreous cavity was introduced to open the membrane with a dry film thickness of about 200 microns. The codes of membranes were described in Table 1.
Table 1. Codes of composite membranes specimens
Code SPEEK
(wt.%)
SeO2
(wt.%)
PWA (wt.%)
Strong Magnetic Field (8T)
SP 100 0 0 -
SP-SeO2 99 1 0 -
SP-S1P4 95 0.7 4.3 -
SP-S0P5 95 0.4 4.6 -
SP-S1P9 90 0.7 9.3 -
SP-S2P8 90 1.4 8.6 -
SP-S1P14 85 1.1 13.9 -
SP-S2P13 85 2.0 13.0 -
SP-S1P4-PE8 95 0.7 4.3 Perpendicular
SP-S0P5-PE8 95 0.4 4.6 Perpendicular
SP-S2P8-PE8 90 1.4 8.6 Perpendicular
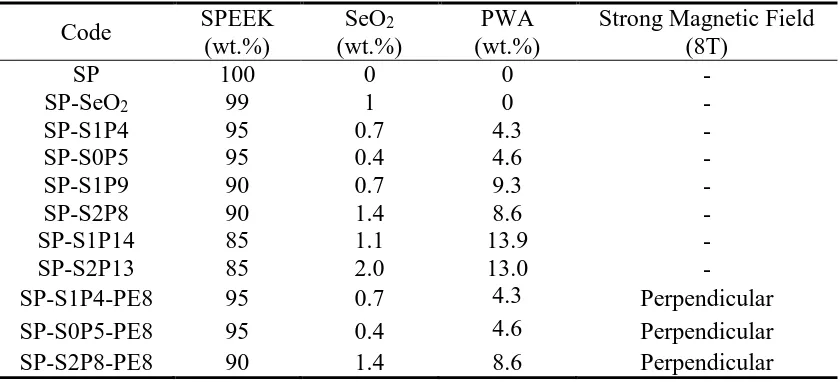
2.2 Strong magnetic field treatment of the membrane sample
Figure 1. Directional processing field and film surface vector relationship
2.3 The mainly characterization and testing
Fourier transform infrared (FTIR) spectra of proton exchange membrane structure characterization will first mix the samples with KBr powder through dry processing, on the basis of Beer-tablet of Lambert's law to make it thin enough.Then the Nicolet-type AVATAR380 Fourier transform infrared spectrometer (Thermo Nicolet Corporation, Madison, USA, FT-IR) on synthesis of modified membrane samples of infrared testing, condition of room temperature (25℃) wave number range of 500-4000 cm-1.
Wide-angle X-ray scattering measurements (XRD) were performed on a Bruker AXS-D8 Avance X-ray diffractometer with a copper target (40 kV, 40mA).
Varying temperature system of low field Nuclear Magnetic Resonance (LF-NMR, Shanghai new McLaren electronic technology co., LTD.), water probe method was used to analyze the doping the water distribution within the membrane. Resonance frequency 21.800 MHz, 0.51 T magnet strength, probe coil diameter 10 mm. First immersed the membrane samples in distilled water for 24 h, remove surface moisture on filter paper, after the film sample into the bottom of 10 mm tube. The sealing tube mouth was tested in 35℃ magnet box, using hard CPMG pulse sequence sampling. The index law and attenuation curves of sampling and multiple index model and wheat marquardt method and optimum algorithm of film sample CPMG on attenuation curve fitting and optimization calculation, get the transverse relaxed Time (the Relaxation Time 2, T2) Relaxation spectrum. After the sampling tube first came out, tube mouth is uncovered on sealing membrane in the 105℃ magnet heating drying for 3 minutes, open the heat pump and sealing tube mouth in 35℃ magnet box testing. Using hard CPMG pulse sequence sampling and sampling according to the index law of attenuation curve. Peel off the film sample tube mouth sealing membrane, heat and dry the magnet at 105℃, open the heat pump and then repeat the above operation to repeat sampling every 3 minutes, until all the moisture in the sample has left.
accurate characterization of the magnetic, all test results are minus the test device substrate diamagnetic semaphore.
Proton conductivity of membrane specimens in the traverse direction was measured in a measurement cell using an AC Electrochemical Impedance Spectroscopy, which consisting of a Solartron Instruments 1287 electrochemical interface and a Solartron Instruments 1255 B frequency response analyzer (UK) [16]. The EIS recorded over a frequency range is 1-106 Hz. Before the tests, all membrane specimens were abundantly immersed in 1 mol/L hydrochloric acid solution for 24 h then rinsed with de-ionized water for several times. Consequently, resistance of membranes was measured and proton conductivity was calculated as described.
3. RESULTS AND DISCUSSION
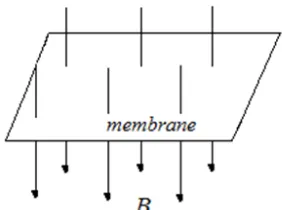
A thermo Nicolet 6700 with ATR infrared spectrometer was employed to collect information. FTIR spectrum line of as-obtained samples are shown in Figure 2.
3000 2500 2000 1500 1000
1501cm-1
1595cm-1
1491cm-1
1469cm-1
1280cm-1
1249cm-1 1020cm-1
1079cm-1
978cm-1 896cm
-1
wave number (cm-1)
SP
SP-SeO2
SP-S1P9
[image:5.596.173.430.343.553.2]808cm-1
Figure 2. The IR spectra of SP, SP-SeO2 and SP-L1P9
Three membrane specimens and 1280 cm-1, 1079 cm-1 of punishment is O=S=O bond of symmetric and asymmetric stretching vibration peak, is 1249 cm-1 -Ar-O-Ar- groups of characteristic peak, is 1020 cm-1 S=O bond stretching absorption peak, show the same membrane matrix structure of the sample, it doesn't change due to the addition of dopant. In the SP-SeO2 sample, the characteristic
peak at 1252 cm-1 may be ascribed to the peak shift of -O- bond caused by rare earth oxide-doped SeO2. The absorption peaks of SP and SP-S1P9 membrane samples in 1595 cm-1, 1469 cm-1 and 1491
cm-1 is attributed to benzene ring, and SP-S1P9 film sample of characteristic peak at 1501 cm-1, benzene ring may be sulfonic acid group and PWA caused by the interaction of SeO2 [17]. The
characteristic peak belong to the PWA tetrahedron argument of oxygen (P-O) vibration, the argument of oxygen (W=Ot) vibration, bridge oxygen argument (W-Oc) and argument (W-Oe) vibration, respectively. And 1079 cm-1 is resulted from O=S=O bond symmetric stretching vibration peak, so it get relative spectral peak. Se-O spectral peak wave number was not within the scope of the testing, SeO2 and the interaction is difficult to be observed[18].
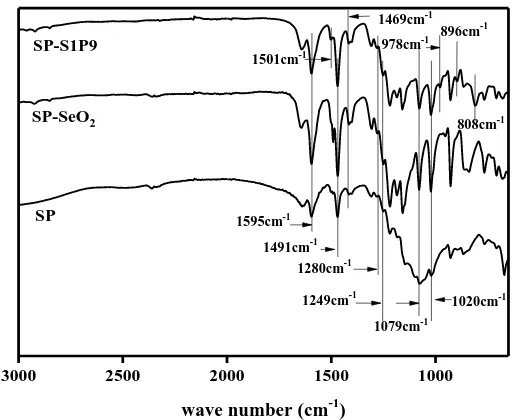
SP film sample for typical amorphous diffraction peak, SP-SeO2, SP-S0P5-PE8 and
SP-S1P4-PE8 membrane diffraction peaks of the sample (111), (200), (220), (311) and (222) are in accordance to the corresponding position of the diffraction peak SeO2. The doped film contains the crystal
structure of SeO2. And it is not affected by the 8 T parallel magnetic field treatment, which is possible
that SeO2 and sulfonic acid groups form the coordination effect, and the crystal structure of the
two-phase interface in the doped film has no influence. Besides, small changes in internal or membrane and is not reflected in the diffraction characteristic peak (Figure 3). When doped with membrane after vertical 8T magnetic field treatment, SP-S0P5-PE8 diffraction peak in the sample (211), (222), (400), (440) and (622), and SeO2 database corresponding to the diffraction peak position of the perfectly. By
8T magnetic field vertical handle 4 h under 120℃, SP-S1P4-PE8 film sample of SeO2, according to
[image:6.596.144.458.385.626.2]the characteristics of diffraction peak again show that the molecular structure of the doped film inside change under strong magnetic field, form a range of SeO2 small chip area [20].
Figure 3. Diffraction characteristic peak of film sample
Table 2. T2 and A of membrane specimens
CODE SP-S1P4 SP-S0P5
Relaxed time T2(ms) 3.42 3.27
Nuclear magnetic signal A(p.u.) 22270.71 30786.78
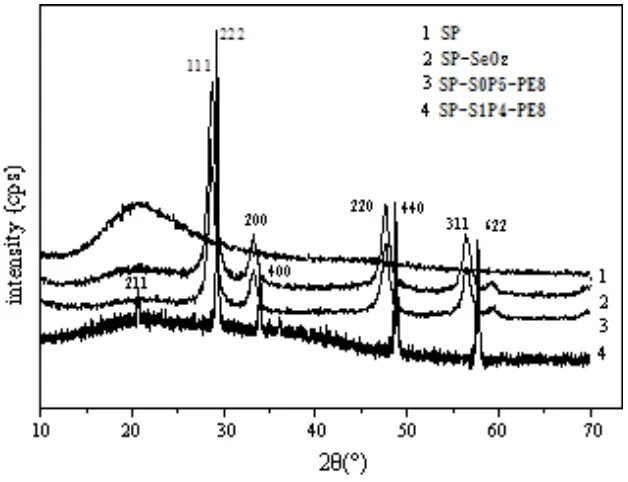
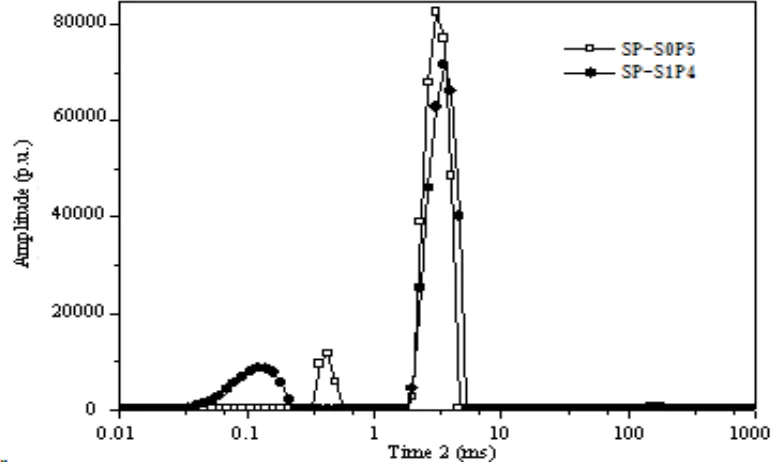
[image:7.596.100.486.233.466.2]The LF - NMR water probe method, and through the CPMG on attenuation curve fitting and optimization calculation, get dual doped film sample of T2 relaxation time and nuclear magnetic signal of A curve as shown in figure 4, the abscissa is logarithmic, ordinate is numeric.
Figure 4. T2 relaxation time of double-doped film samples and nuclear magnetic signals of A-curve
The SP-S0P5 sample has three T2 distribution regions: 0.33-0.50, 2.01-4.04 and 132.19-200.92 ms. SP-S1P4 sample has two T2 distribution regions: 0.01-0.22 and 2.01-4.64 ms. For the same SP85 matrix, the molar ratio of different levels of membranes is different for internal water molecules binding, and the membrane's water content and water storage capacity is different. The larger the T2 distribution area, the smaller the value is, which indicates that the larger the storage capacity in the film sample. A numerical value, water content indicates higher water content in the membrane sample. Therefore, SP-S0P5 film sample have higher moisture content and storage capacity than SP-S1P4 sample. It is possible that the molar ratio of SeO2 to PWA is 1:1 or the relative content of PWA is
30 40 50 60 70 80 90 10-4
10-3
10-2
10-1
Con
du
ctivit
y (S/cm
)
)
Temperature (C)
SP SP-S0P5 SP-S1P4
(a)
30 40 50 60 70 80 90 10-4
10-3
10-2 10-1
Temperature (C)
Con
du
ctivit
y (S/cm
)
)
SP SP-S1P9 SP-S2P8
(b)
30 40 50 60 70 80 90
10-4
10-3
10-2
10-1
Con
du
ctivit
y (S/cm
)
)
Temperature (C)
SP SP-S1P14 SP-S2P13
(c)
[image:8.596.172.407.85.706.2]
The molar ratio between SeO2 and PWA with the specific value of 2:1 or PWA content is
relatively low. The dual doping within membrane molecular inter-atomic forces than 1:1 ratio of mixed within the film or the film sample PWA dominant relatively weak absorption, which makes water molecules relatively easy to lose. So that, the dual doped membrane samples exhibit weak ability towardsinternal water molecules storage.
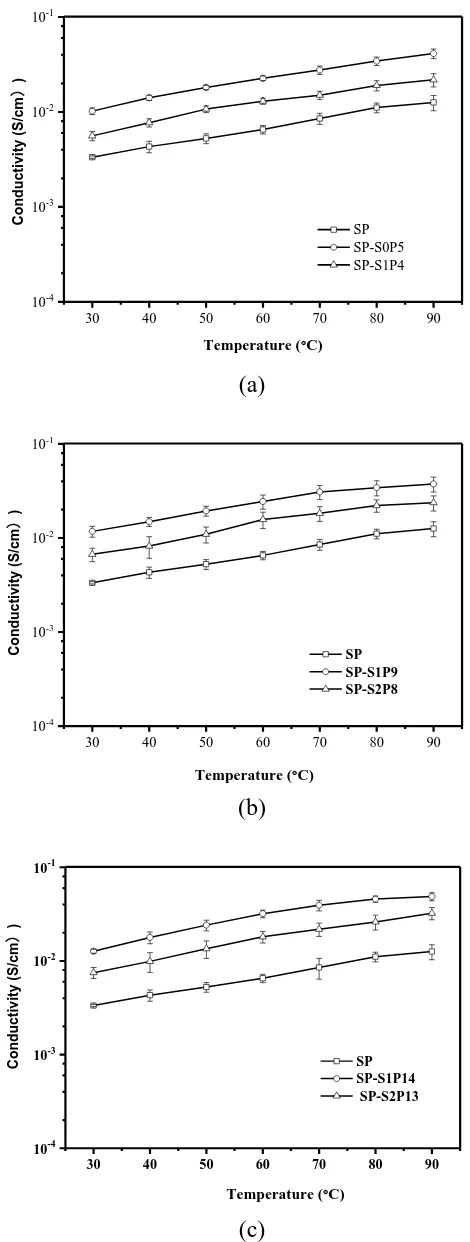
Testing the protonation of film sample get doped film in 30-90℃ when the conductivity versus temperature is shown in Figure 5.
The conductivity of membrane is greater than that of the proton conductivity corresponding to the membrane. Compared with the increase slightly in conductivity of the SP membrane, the conductivity of the doping membrane increases obviously. It is well-known that film sample test to reduce the impact of protons on membrane samples, and to increase the number of protons, is conducive to the proton conduction in the film. The same doping amount of doping film doped with SeO2 and PWA in a molar ratio of 1:1, the conductivity is higher than that of the 2:1 film sample, and
the same as the film sample. The protonation indicates the performance of the film sample directed to the proton, more about the environment within the membrane for proton jumps, the large storage capacity of membrane samples (Figure 5), and higher proton conversion efficiency in the membrane. It can be seen that the conductivity of PWA doped SeO2 doped membrane is expected to decrease
[22-23]. However, doping molar ratios and the same amounts were 5 wt.%, 10 wt.% and 15 wt.% of dual doped membrane conductivity only slightly increase, may PWA doped quantity to increase, or nano rare earth oxide SeO2 and PWA and caused by the interaction of sulfonic acid group.
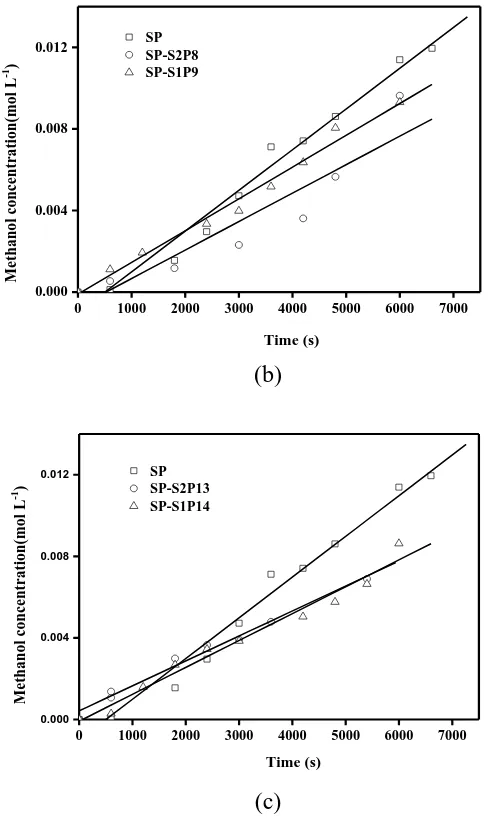
GC9800 type gas chromatograph was used to detect pure SP film sample and its dual doped film, and the relationship between the concentration of ionized water and the methanol concentration at room temperature of the film sample was obtained as shown in figure 6.
0 1000 2000 3000 4000 5000 6000 7000
0.000 0.004 0.008
0.012 SP
SP-S1P4 SP-S0P5
Me
than
ol
conce
ntration
(mol
L
-1)
Time (s)
0 1000 2000 3000 4000 5000 6000 7000
0.000 0.004 0.008 0.012
Time (s)
Me
than
ol
conce
ntration
(mol
L
-1 )
SP SP-S2P8 SP-S1P9
(b)
0 1000 2000 3000 4000 5000 6000 7000
0.000 0.004 0.008 0.012
Me
than
ol
conce
ntration
(mol
L
-1)
Time (s)
SP SP-S2P13 SP-S1P14
(c)
Figure 6. The relationship of methanol diffusion concentration of membrane specimens vs. time at room temperature: (a) 5wt.%, (b) 10wt.% and (c) 15wt.% content
In Figure 6(a), the line slope of SP sample is larger than SP-S0P5 membrane, but the sample of the SP-S1P4 membrane is slightly smaller than the SP membrane. Figure 6(b) and 6(c), SP-S2P8 and SP-S1P9, SP-S2P13 and the sample of the straight slope SP-S1P14 membrane are very similar, both lower than SP. It is no doubt that methanol diffusion in the membrane sample concentration and diffusion time, but also directly related to dual dopant. The double doped film samples were made more compact by the interaction of SeO2 with PWA and sulfonic acid group to reduce methanol over
[image:10.596.164.408.90.500.2]
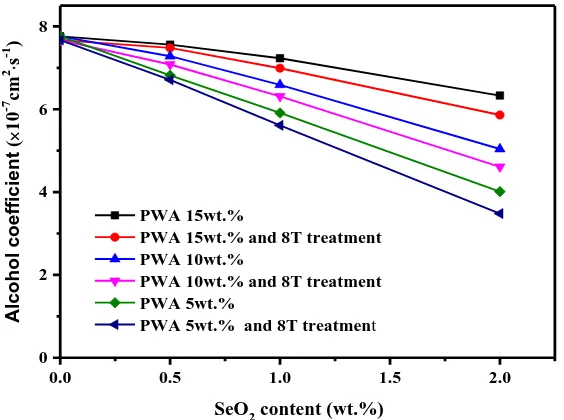
Dual-doped test film sample of magnetic field treatment have good quality, in order to obtain the alcohol coefficient of the doped film at different dopant content, their relationship curve were shown in Figure 7. The doping membrane is lower in methanol permeability than the pure film. When the content of SeO2 is the same, the higher the PWA content, the larger the alcohol coefficient through the
membrane. The higher PWA content corresponds to the smaller alcohol coefficient when the same content of SeO2 is same. SP, the penetration coefficient of methanol in the 8T vertical direction
magnetic field decreased slightly. However, the alcohol coefficient decreases accordingly with SeO2
content increaseing, such as SP-S0P5-PE8 sample has a coefficient of reduction methanol about 1×10⁻⁷
cm2/s, and SP-S2P8-PE8 sample has a large coefficient of reduction methanol of 3.48×10⁻⁷ cm2/s. Doped with SeO2 leads to the decrease of alcohol coefficient, while PWA doping increases the
conductivity of the membrane sample. The vertical direction of the supermagnetic treatment can improve the performance of the doping film to guide proton and can improve the resistivity of the doping membrane, so the modified SPEEK membrane with SeO2 and PWA is a good modified tactic
[24].
0.0 0.5 1.0 1.5 2.0
0 2 4 6 8
Alc
o
h
o
l co
e
ff
icie
n
t
(
10
-7 cm 2 s -1 )
SeO2 content (wt.%) PWA 15wt.%
PWA 15wt.% and 8T treatment PWA 10wt.%
PWA 10wt.% and 8T treatment PWA 5wt.%
PWA 5wt.% and 8T treatment
Figure 7. The relationship of methanol permeability vs. high magnetic field treatment and different dopant content
Within 90 h before the failure of PWA within 60 h, the quality of the doped film samples were basically stable (Figure 8). The wear rate of PWA doped films decreases with time, and the more the SeO2 doping amount, the lower the wear rate of the film samples.
[image:11.596.151.433.334.544.2]
coordination effect and hydrogen bonding effect. Under the action of strong magnetic field, the doping of thin films can not only reduce the PWA turnover rate, but also reduce the thin film samples through the alcohol coefficient to ensure high proton conductivity, indicating that the dual doping of SeO2 and
PWA can improve doping of doped films comprehensive performance [25].
30 60 90 120 150 180
0 1 2 3 4 5
Time (h)
Lo
ss
rate
(%)
[image:12.596.148.433.191.406.2]SP-S0P5 SP-S1P9 SP-S2P13
Figure 8. The dual doped film sample of PWA turnover rate with time
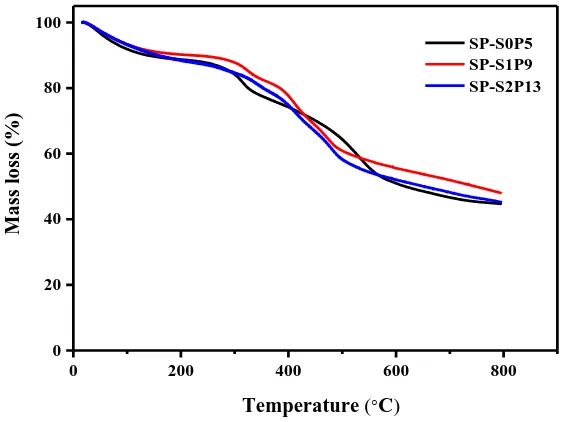
0 200 400 600 800
0 20 40 60 80 100
Ma
ss loss (
%)
Temperature (C)
SP-S0P5 SP-S1P9 SP-S2P13
[image:12.596.147.429.485.696.2]
The three membrane samples are in the same heat temperature zone (Figure 9). In the first stage within the 150℃, main adsorption of water film inside the sample and the evaporation of solvents and other small molecules or volatile substances gives rise to the quality shift. The second stage between 300-350℃, is mainly resulted from sulfonic decomposition and PWA crystallization of water dissociation. The third stage above 350℃ is mainly due to the thermal decomposition of SPEEK backbone. The above result indicates that film samples have good thermal stability. The dual membrane samples with same PWA doping amount and different SeO2 doping amount has a good
interaction between the molecules, leading to the fact that sulfonic acid group is not easy to disintegrate. Thereby increasing the thermal stability, not caused by changes in different SeO2 doping
amount.
4. CONCLUSIONS
SeO2 and PWA modified 85 wt% DS SPEEK proton exchange membrane show that SeO2
coordination with sulfonic acid groups and causes a change in chemical structure. When the SeO2
content is related with the conductivity of membrane, the water absorption rate and the swelling degree increases with increasing PWA doping level through alcohol coefficient. When the content of PWA is constant, with the increase of doped SeO2 content, the conductivity of membrane decreased slightly.
Through alcohol coefficient, the lower water absorption and swelling degree, the lower the turnover shows an increase in the PWA storage capacity. On the doped membrane after 120℃, its electrical conductivity increases about 1.9 times and the alcohol coefficient decreased slightly, bibulous rate is basically no change by 8T strong magnetic field vertical processing 10 h.
The sulfonic acid groups within membrane are easy bibulous to form small watershed, reducing the adjacent effective distance and facilitating the proton transfer. The proton movement is active inside the film due to the temperature increase, but the volatilization and micro-drainage area are narrow. All two different factors affect the conductivity. For pure SPEEK membranes, district heating in low temperature has a great effect on the activity of proton. The conductivity increased significantly. The effect of high temperature on moisture is greater, as the temperature increases, the lower the conductivity. For rare earth oxides doped membrane, the interaction between rare earth ions and sulfonic acid groups increase the storage capacity, reducing the volatilization of water, strengthening the proton activity and improving the conductivity.
Compared with other researchers' research, this paper focus on doping of SeO2 and PWA to
prepare DS 85% SPEEK composite membrane. The methanol resistance, swelling resistance, and proton conductivity of the proton exchange membrane were improved, and the initial experimental scenario was successfully implemented. The performance of the proton exchange membrane was optimized, and it was hoped that it would promote the development of the fuel cell.
ACKNOWLEDGEMENTS
Provincial Natural Science Foundation of China (LQ14E030004), Shaoxing 330 Talent Plan Foundation (ACX201424) for the support to this research.
References
1. Ö. Aras and M. Bayramoglu, Int. J. Electrochem. Sci., 10 (2015) 8103.
2. Y.W. Wang, Y.C. Leung, J. Xuan and H.Z. Wang, Renew. Sust. Energ. Rev., 75 (2017) 775. 3. A.C. Turkmen, S. Solmaz and C. Celik, Renew. Sust. Energ. Rev., 70 (2017) 1066.
4. T. Sutharssan, D. Montalvao, Y.K. Chen, W.C. Wang and H. Elemara, Renew. Sust. Energ. Rev., 75 (2017) 440.
5. S. Yi, B. Yang and Z.J. Zhao, J. Fuel. Chem. Tech., 44 (2016) 1266.
6. S. Seetharaman, S.C. Raghu and K.A. Mahabadi, J. Energ. Chem., 25 (2016) 77. 7. J.B. Ballengee and P.N. Pintauro, J. Membrane Sci., 442 (2013) 187.
8. G. Wang, Y.F. Yao, G.Y. Xiao and D.Y. Yan, J. Membrane Sci., 425-426 (2013) 200. 9. H. Ito, N. Miyazaki, M. Ishida, A. Nakano, Int. J. Hydrogen Energ. 41 (2016) 20439. 10.M.A. Hickner, H. Ghassemi and Y.S. Kim, Chem. Rev., 104 (2004) 4587.
11.Z.P. Zhao, Z.P. Zhou and M.Q. Zhong, Int. J. Electrochem. Sci., 9 (2014) 8120. 12.Z.P. Zhao, Z.P. Zhou and M.Q. Zhong, Int. J. Electrochem. Sci., 10 (2015) 5026.
13.Z.P. Zhao, J.J. Hu, Z.P. Zhou and M.Q. Zhong, Optoelectron. Adv. Mat., 10 (2016) 117. 14.L. Du, X.M. Yan, G.H. He, X.M. Wu, Z.W. Hu and Y.D. Wang, Int. J. Hydrogen Energ., 37
(2012) 11853.
15.M.M. Radhi, W.T. Tan, M.Z. Rahman and A.B. Kassim, Int. J. Electrochem. Sci., 5 (2010) 254. 16.N.N.Ramly, N.A. Aini, N. Sahli, S.F. Aminuddin and A.M.M. Ali, Int. J. Hydrogen Energ., 42
(2017) 9284.
17.A. Pokprasert, S. Chirachanchai, J. Membrane Sci., 524 (2017) 550.
18.Y.C. Yen, Y.S. Ye, C.C. Cheng, C.H. Lu and F.C. Chang, Polymer, 51 (2010) 84. 19.V.D. Noto, M. Piga, G.A. Giffin and G. Pace, J. Membrane Sci., 390 (2012) 58. 20.Y. Zhang, H. Zhang, C. Bi and X.B. Zhu, Electro. Acta, 53 (2008) 4096.
21.J. Jaafar, A.F. Ismail and T. Matsuura, J. Membrane Sci., 345 (2009) 119.
22.M. Gil, X.L. Ji, X.F. Li, H. Na, J.E. Hampsey and Y.F. Lu, J. Membrane Sci., 234 (2004) 75. 23.R. Naresh Muthu, S. Rajashabala and R. Kannan, Int. J. Hydrogen Energ., 34 (2009) 7919. 24.J. Okuda, Coord. Chem. Rev., 340 (2017) 2.
25.E. Drioli, A. Regina, M. Casciola, A. Oliveti, F. Trotta and t. Massari, J. Membrane Sci., 228 (2004) 139.