MIXING AND
MATCHING
RESEARCH AND
INNOVATION
POLICIES IN EU
COUNTRIES
REINHILDE VEUGELERS
Highlights
• The European Union has prioritised the pursuit of innovation-based growth and targeting of resources to promote research and development, but performance on innovation remains weak. With the lack of results comes fatigue, waning interest and mounting criticism about policy. Should the EU abandon its ambition to become the most innovative region in the world? We examine EU member state research and innovation policies. We assess whether the deployment of innovation policy instruments in EU countries matches their innovation capacity performance relative to other EU countries. We find a relative homogeneity of policy mixes in EU countries, despite the fairly wide and stable differences in their innovation capacities. Our analysis therefore provides a rationale for a more comprehensive review of innovation policy mixes to assess their adequacy in addressing country-specific innovation challenges.
Reinhilde Veugelers (reinhilde.veugelers@bruegel.org) is a Senior Fellow at Bruegel and a professor at KULeuven (Belgium). Research assistance from Diogo Machado, Afrola Plaku and Elena Vaccarino is gratefully acknowledged. The research for this paper was carried out in the framework of Bruegel’s partnership with the Bavarian Industry Association (Vereinigung der Bayerischen Wirtschaft e.V., vbw).
BRUE
GEL WORKING P
APER
Introduction
Europe has lofty ambitions for building a socially and environmentally sustainable future on the basis of growth and prosperity through innovation.
Already in its 2002 Lisbon Strategy, the European Union set out its ambition to become the most competitive knowledge-based economy in the world. An ambitious target was set to devote 3 percent of GDP to research and development by 2010. In its subsequent EU2020 strategy and Innovation Union Flagship, the EU set out a roadmap for smart sustainable and inclusive growth. The target of a 3 percent R&D-to-GDP ratio remained in place in the EU2020 strategy. In the 2015 Juncker investment plan, support for potential research and innovation projects has a prominent place in a bid to revive Europe’s growth1.
Despite these policies and pronouncements, Europe’s performance on innovation remains weak. Europe’s overall (public and private) R&D-to-GDP-ratio continues to stand at 2 percent, still far from the 3 percent target and significantly lower than the US, Japan, South Korea and Singapore. Furthermore, there are few signs of progress, in contrast to China, which is catching up fast and is already on par with the EU on the basis of this indicator.
With the lack of results comes fatigue, waning interest and mounting criticism about policy: not enough public funding dedicated to innovation; lack of governance; no real commitment beyond rhetoric; instruments being used ineffectively; effective instruments missing. Are these criticisms justified? Should Europe abandon its ambition to become the most innovative region in the world? We assess EU member state research and innovation policies. To be effective, the mix of innovation policy instruments should address all the relevant enablers of innovation-based growth, covering the entire innovation process and taking into account countries’ specific circumstances. We assess whether the deployment of EU countries' innovation policies matches with their innovation ranking within the EU. For this assessment, we use Eurostat’s data on government budget appropriations for R&D and Erawatch/TrendChart data on deployment of policy instruments. We find a relative homogeneity of policy mixes in EU countries, despite their fairly wide and stable differences in innovation capacity. Our
1 European Commission president Jean-Claude Junker’s investment plan, known as EFSI (European Fund for Strategic
analysis therefore provides a rationale for a more comprehensive review of innovation policy mixes to assess their adequacy in addressing country-specific innovation challenges.
Some introductory remarks on innovation policy
In order to be effective, innovation policy should be systematic, addressing all the relevant enablers for innovation-based growth. Innovation policies should therefore be a mix of instruments covering the entire innovation process, building on each country’s strengths, targeting weaknesses and reducing bottlenecks. We examine the research and innovation policies already in place in EU countries. We assess whether these policies match each country's innovation position. We do not aim to identify the best policy mixes. There is no one-size-fits-all prescription for optimal innovation policy. A country’s optimal innovation policy mix will depend on its level of innovation development and the presence of key enablers for innovation-based development. The optimal policies will dynamically evolve along each country's growth path. We should therefore expect varying innovation policies in different EU countries, and changes over time in innovation policies within countries. Our analysis also does not aim to reveal causal links between innovation policies and innovation performance. Innovation performance is the outcome of a large set of factors and policies, of which innovation policy is only one factor among many. There is an issue of correctly distinguishing the effects of a policy instrument from those of several other influencing factors. The impact of innovation policies is strongly shaped by framework conditions, and by the broader institutional environment. In addition, when evaluating the performance of innovation policies, long lead times need to be taken into account for effects to materialise. This implies a large window for other intervening forces.
This paper provides only a descriptive analysis, not allowing for any causal inferences and therefore evaluations of innovation policies. It aims to take stock of innovation policies, comparing the differences in innovation policy mixes in different countries to the differences in innovation capacity development, thus offering insights into how appropriate the innovation policy mixes in EU countries are for each country’s innovation position.
The rationale for innovation policy
The fundamental justification for government support for research is the classic market-failure argument: markets do not provide sufficient incentives for private investment in research because of the non-appropriable character of knowledge as a public good. Once invented, the new knowledge created from R&D is non-rival and only partially non-excludable. Others might learn and use the ideas, without necessarily paying for them. It is these ‘spillovers’ that lead to social rates of return above private rates of return, and therefore private investment levels that are below the socially optimal levels. This divergence between social and private rates of return calls for government intervention to stimulate private R&D investment so that it increases to the higher socially optimal level.
Beyond the spillover case, another market failure follows from the highly risky and uncertain nature of the outcomes of R&D. This uncertainty, coupled with asymmetries in information between capital markets and R&D investors, causes financial market imperfections, impeding access to finance for risky innovation projects.
In addition, public research is needed to meet specific needs of public interest, including ‘common goods’ which the market would not supply on its own, such as defence, public health and a clean environment.
Characterising innovation policies
We characterise innovation policies according to their objectives and the set of instruments deployed. In line with OECD (2010a) we distinguish (i) provision of public R&D infrastructure; (ii) support for private R&D and innovation capacity building in the corporate sector; (iii) strengthening the linkages between the various participants within the innovation system, especially between public R&D and the private sector; and (iv) enhancing the framework conditions for innovation.
The last category includes broader policies that target the efficient functioning of product, labour and financial markets, as well as macro-economic stability and institutional quality. As these are not strictly speaking innovation policy instruments, we do not discuss these. We do retain a few instruments on framework conditions that are mainstream innovation policy instruments, such as support for venture capital and support for intellectual property rights.
On support for investment, we need to distinguish between direct support for/provision of public R&D infrastructure at universities (higher education institutions, HEI) and public research organisations (PROs), versus support for private investment in R&D and innovation. On financial support for
investment, it matters not only how much support is provided and for how long, but also how it is
allocated: it can be provided through block funding or through competition, and in the form of grants, loans or tax credits.
Strengthening the linkages in the innovation system involves linking the users and producers of new ideas, often clients and suppliers in vertical chains, but also idea developers and financiers. This often happens through government support for networking. Such support often takes the form of place-based cluster policies, as geographic proximity is an important enabler for effectively linking people and organisations. Particular attention in policies is paid to the link between science, typically carried out at public research institutes, and development and innovation, typically done by private firms.
Positioning EU countries according to their innovation capacity
In order to assess a country's innovative capacity, defined as its ability to produce new ideas and to bring them to market and translate them into economic growth and prosperity, we need to explore a range of factors deemed important for effective innovation. Going beyond the availability of R&D inputs, R&D infrastructure and financing, this also includes the presence of incentives for innovation effort and the ability to capture value when introducing innovations (Furman et al, 2002).
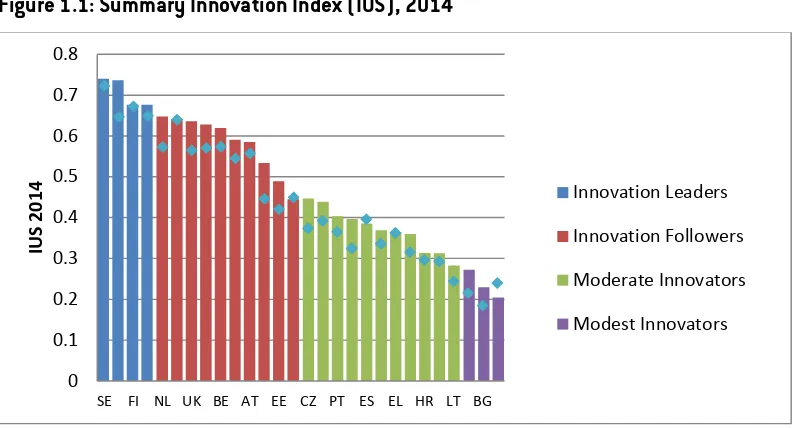
[image:6.595.73.471.367.581.2]A broad indicator for assessing a country’s innovation capacity is the Innovation Union Scoreboard indicator, developed by the European Commission in support of its Innovation Union Strategy. Its Summary Innovation Index (IUS) is a composite indicator capturing eight aspects of innovation: human resources, research systems, finance, firm investment, linkages, IPR, innovations, and economic effects (see http://ec.europa.eu/enterprise/policies/innovation/policy/innovation-scoreboard/index_en.htm).
Figure 1.1: Summary Innovation Index (IUS), 2014
Note: Blue diamond indicates summary Innovation Index 2007. 0
0.1 0.2 0.3 0.4 0.5 0.6 0.7 0.8
SE FI NL UK BE AT EE CZ PT ES EL HR LT BG
IU
S 2014
Innovation Leaders
Innovation Followers
Moderate Innovators
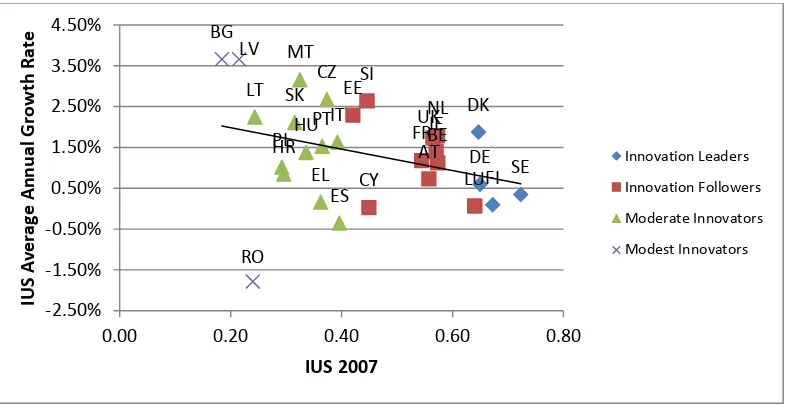
Figure 1.2: Summary Innovation Index (IUS) and innovation growth rates, 2007 IUS and average annual IUS growth rates, 2007-14
Source: Bruegel on the basis of Innovation Union Scoreboard 2014 Database.
Figure 1.1 shows how EU countries are performing according to the latest IUS scores. The best performing countries are Sweden, Denmark, Germany and Finland. Other countries above the EU average include the Benelux countries, the UK, France, Austria, Estonia, Slovenia and Ireland.
The bottom countries are Romania, Latvia and Bulgaria. Other EU countries below the EU average include Hungary, Poland, Slovakia and the Czech Republic. Italy, Spain, Portugal and Greece also score below the EU average, illustrating that the innovation divide between leaders and laggards is not a clear east-west divide, but also runs between the north and south of Europe. For the rest of this paper, we classify countries depending on their average IUS score over the total considered period: 2007-14:
• Innovation leaders: Sweden, Denmark, Germany and Finland.
• Innovation followers: Benelux, UK, Ireland, Austria, France, Slovenia, Estonia and Cyprus. • Moderate innovators: Italy, Spain, Portugal, Greece, Malta, Czech Republic, Hungary, Slovakia,
Croatia, Lithuania, Poland.
• Modest innovators: Romania, Latvia and Bulgaria.
As Figure 1.2 illustrates, there has been some catching-up and convergence in the EU in the period 2006-2013, with countries such as Estonia, Latvia, Portugal, Slovenia and Lithuania recording the largest growth rates in IUS, while Sweden and Denmark recorded the lowest. Overall, growth rates have
SE DK FI DE NL LU UKIEBE FR AT SI EE CY CZ IT PT MT ES HU EL SK HR PL LT LV BG RO -2.50% -1.50% -0.50% 0.50% 1.50% 2.50% 3.50% 4.50%
0.00 0.20 0.40 0.60 0.80
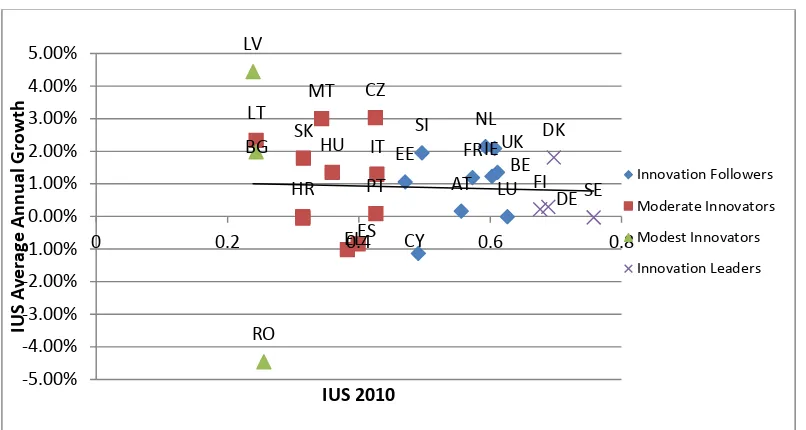
remained fairly low. It is worrying that the process of convergence seems to have come to an end after 2009, as a comparison between Figures 2.1 (2006-2009) and 2.2 (2010-2013) illustrates.
Figure 2.1: Summary Innovation Index and innovation growth rates, pre-financial crisis, 2007 IUS and average annual IUS growth rates, 2007-09
Figure 2.2: Summary Innovation Index and innovation growth rates, post-financial crisis, 2010 IUS and average annual IUS growth rates, 2010-14
Source: Bruegel on the basis of Innovation Union Scoreboard 2014 Database.
We use the ranking of countries on the IUS as well the IUS class to which they belong when analysing their innovation policy mixes.
AT CZ ES HR SE DK FIDE LU UKBEIE FR SI EE CY IT PT MT HU EL PL PL LT LV BG RO -1.00% 0.00% 1.00% 2.00% 3.00% 4.00% 5.00% 6.00% 7.00% 8.00% 9.00%
0 0.2 0.4 0.6 0.8
IU S Av era ge A nn ua l G ro w th IUS 2007 Innovation Followers Moderate Innovators Modest Innovators Innovation Leaders LU CZ IT PT MT ES HU EL SK HR LT LV BG SE DK FI DE NL UK IE BE FR AT SI EE CY RO -5.00% -4.00% -3.00% -2.00% -1.00% 0.00% 1.00% 2.00% 3.00% 4.00% 5.00%
0 0.2 0.4 0.6 0.8
[image:8.595.71.474.420.635.2]Characterising the innovation policy landscape in EU countries
We look at two important aspects of innovation policy:
• How much public funding is spent ;
• How it is spent, ie which instruments are deployed with which budgets in the innovation policy mix.
As a source of information for the mix of policy instruments we will use the EU’s TrendChart (TC) (http://ec.europa.eu/enterprise/policies/innovation/policy/innovation-scoreboard/index_en.htm.)
The TrendChart database includes programme-based research and innovation but not institutional funding. It therefore only captures active innovation policy, but not the regular funding of institutions, which also strongly affects innovation performance. The Government Budget Appropriations or Outlays for R&D (GBAORD) data cover all allocations to R&D in government budgets. For this reason, we switch to GBAORD rather than TrendChart for data on public expenditure, and only use the TC database when discussing policy instruments. A caveat of GBAORD data is that the series cover provisions, not actual expenditures. It also does not include tax incentives and loans. These instruments will only be included in the discussion on policy instruments with TrendChart.
The TrendChart and GBAORD databases are further clarified in the appendix.
Public spending on innovation in EU member states
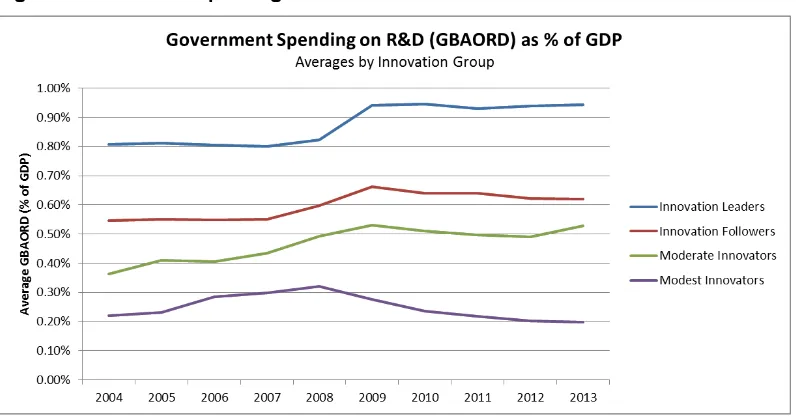
Figure 3: Government spending on R&D (GBAORD) as % of GDP
Source: Bruegel on the basis of Eurostat.
When looking at trends, all groups of countries saw an increase in R&D spending from 2008-2009, reflecting stimulus spending in response to the crisis. But this spending spike was only maintained in the leading countries, and not in the weaker countries, leaving a bigger divide in public spending on innovation in 2013 than in 2004 (see Veugelers, 2014, for more analysis on the increasing public R&D spending divide in Europe).
When looking at individual countries, Germany used to spend less than other innovation leading countries, but has increased its spending ratio. While Finland initially further expanded its already substantial public budget on innovation, since 2010 it has seen a drop in public funding as a share of GDP, though funding remains at a high level. Finland sits now at the same level as Denmark, which continued to increase its public spending over the whole period considered .
includes Italy and Spain, who spent in 2013 0.54 percent and 0.56 percent of their respective GDPs on public R&I, Portugal is a positive outlier: it expanded its GBOARD as a share of GDP in the pre-crisis period from 0.61 percent in 2004 to 1.04 percent in 2009, and has managed, despite its difficult fiscal consolidation position, to keep its share at a high level of 0.95 percent in 2013.
Beyond the changes to budgets, it also matters how budgets are spent. The next section will look deeper into how EU countries' public R&D resources are spent.
The mix of policy instruments for innovation in EU member states
When investigating which innovation policy instruments are deployed in EU member states, we use the Erawatch TrendChart database. The appendix describes the TrendChart database in more detail. For more analysis using the TrendChart data, see Itzak et al (2013).
Most important instrument
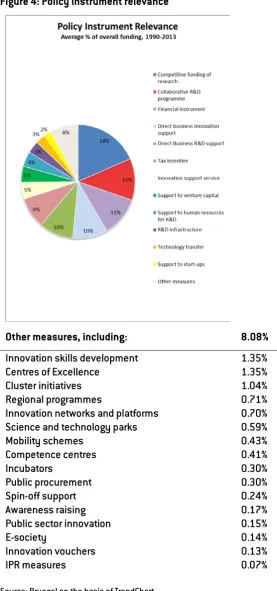
Among the 28 different policy measures identified in TrendChart, the main innovation policy measures implemented over the period (1990-2013) in EU member states, ie those which take up at least 5 percent of the overall reported budget, are the following:
• Funding for specific public research programmes allocated in a competitive manner to universities and public research organisations and referred to as ‘competitive public research’ in contrast to institutional funding of organisations.
• Funding for collaboration between public organisations and businesses on RDI programmes, referred to as ‘collaborative RDI programmes’.
• Financial instruments (loans). • Direct business innovation support. • Direct business R&D support. • Tax incentives.
Figure 4: Policy instrument relevance
Other measures, including: 8.08%
Innovation skills development 1.35%
Centres of Excellence 1.35%
Cluster initiatives 1.04%
Regional programmes 0.71%
Innovation networks and platforms 0.70% Science and technology parks 0.59%
Mobility schemes 0.43%
Competence centres 0.41%
Incubators 0.30%
Public procurement 0.30%
Spin-off support 0.24%
Awareness raising 0.17%
Public sector innovation 0.15%
E-society 0.14%
Innovation vouchers 0.13%
IPR measures 0.07%
Source: Bruegel on the basis of TrendChart.
This six-pack of innovation policy instruments take up the bulk of the R&D budget in all EU countries, irrespective of their innovation performance:
• 76 percent in the innovation leading countries; • 71 percent in the innovation following countries; • 64 percent in the moderate innovating countries; and • 70 percent in the modest innovating countries.
There is however more heterogeneity across countries when looking at the level of the individual measures within these six instruments. This holds particularly for tax incentives: in the four innovation-leading countries: Germany, Finland and Sweden do not use this instrument. Only Denmark uses it marginally (with 5 percent of the reported TrendChart budget). It is also not very popular among the moderate and modest innovators. Only in the group of innovation following countries is it more predominant, most notably in France, where it consumes more than half of the reported TC budget. In the Netherlands (35 percent) and the UK (29 percent) it is also the biggest instrument used (in terms of reported TC budget). In Austria, tax incentives (with 29 percent) come second to direct business R&D support (37 percent). Box 1 discusses in more detail the effectiveness of tax credits, while Box 2 discusses grants.
Box 1: Effectiveness of tax credits
R&D tax credits are thought to help finance R&D projects and help generate the socially optimal amount of R&D. A big virtue of R&D tax credits relative to R&D subsidies is that credits let the firms choose the projects and foot part of the bill. It is also a more predictable, reliable scheme, because all firms qualify for the criteria and can potentially use the credits, thus economising on bureaucratic decision making. A wide variety of R&D tax credit schemes abound, ranging from volume-based to increment-based, for R&D employment costs only, tax credits vs tax allowances (OECD, 2010). Although mostly hailed for its generality, tax credits can be specifically targeted towards sectors, firms (such as SMEs or young firms), and different types of R&D projects (eg R&D collaboration with universities).
they are not terribly effective in stimulating more R&D than the amount of tax revenues foregone.” The tax price elasticity is somewhat higher for incremental than for level-based R&D schemes. The power of the tax policy instrument seems therefore to lie more in stimulating new R&D projects and firms, rather than in supporting existing ones. The bias in favour of large persistent R&D firms, even if small firms are given higher rates of R&D tax credits, is further evidence that there is low additionality (Mohnen, 2013).
Box 2: Effectiveness of R&D subsidies for firms
A growing body of econometric work has been produced, evaluating the effects of R&D subsidies/loans on private R&D spending, correcting for other determining firm, industry and market characteristics affecting private R&D spending. The majority of the empirical literature focuses on the issue of whether public R&D spending is complementary, ie ‘additional’ to private R&D spending, or whether it substitutes for and tends to ‘crowd out’ private R&D. David, Hall and Toole (2000) conclude that “the findings overall are ambivalent”, although on average there is more evidence in favour of positive effects. At the same time David et al (2000) warn that “the existing literature as a whole is subject to severe methodological issues”. A major issue is the correction for the selection bias: positive effects associated with R&D subsidies are generated from better firms being selected for subsidies, rather than subsidies causing better performance. More recent studies have come up with better data and methodologies. Although the conclusions are still ambivalent, positive effects seem to prevail more often. Research done in the SIMPATIC project2 provides some cross-country comparisons of the
additionality effects from similar R&D grant schemes, and finds substantial heterogeneity across countries. This heterogeneity is not a result of the industry composition (types of sectors and firms), but reflects other characteristics important for the effectiveness of the schemes, such as the presence of framework conditions and the quality of the implementation in the country. For more on this, see Veugelers (2015).
Funding for collaborative R&D programmes is used by all EU countries irrespective of their innovation performance (with the exceptions of Romania, Bulgaria and Luxembourg). In the countries where it is used, it takes up a substantial part of the reported TC budget. This holds especially in the four innovation leading countries. In Germany, it is the most important instrument reported (46 percent of total spend), it is also the most important instrument in Finland (51 percent) and in Sweden (44 percent). In Denmark it represents about one quarter of the reported budget.
2 SIMPATIC is a FP7 funded research project coordinated by Bruegel on assessing the impact of R&D policies. For more
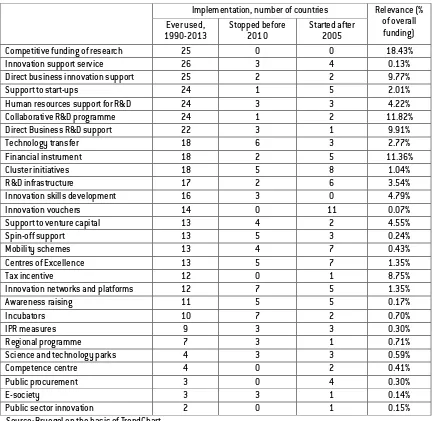
When looking beyond the ‘big six’, the most popular instruments (in terms of measures in place, not budget) are:
• support for start-ups • cluster initiatives
• innovation support services (for intermediaries) • technology transfer
[image:15.595.66.501.322.743.2]Cluster initiatives, support for innovation intermediaries and technology transfer are all instruments to improve the linkages within the innovation system.
Table 1: Policy instruments
Implementation, number of countries Relevance (% of overall funding) Ever used,
1990-2013 Stopped before 2010 Started after 2005
Competitive funding of research 25 0 0 18.43%
Innovation support service 26 3 4 0.13%
Direct business innovation support 25 2 2 9.77%
Support to start-ups 24 1 5 2.01%
Human resources support for R&D 24 3 3 4.22%
Collaborative R&D programme 24 1 2 11.82%
Direct Business R&D support 22 3 1 9.91%
Technology transfer 18 6 3 2.77%
Financial instrument 18 2 5 11.36%
Cluster initiatives 18 5 8 1.04%
R&D infrastructure 17 2 6 3.54%
Innovation skills development 16 3 0 4.79%
Innovation vouchers 14 0 11 0.07%
Support to venture capital 13 4 2 4.55%
Spin-off support 13 5 3 0.24%
Mobility schemes 13 4 7 0.43%
Centres of Excellence 13 5 7 1.35%
Tax incentive 12 0 1 8.75%
Innovation networks and platforms 12 7 5 1.35%
Awareness raising 11 5 5 0.17%
Incubators 10 7 2 0.70%
IPR measures 9 3 3 0.30%
Regional programme 7 3 1 0.71%
Science and technology parks 4 3 3 0.59%
Competence centre 4 0 2 0.41%
Public procurement 3 0 4 0.30%
E-society 3 3 1 0.14%
Public sector innovation 2 0 1 0.15%
Virtually all EU countries provide support for start-ups. While in most cases this is only a small part of the budget, it is a more substantial instrument in Finland and Germany. In Germany, support for start-ups takes up about 9 percent of the TC reported budget (second only to Finland with 13 percent).
Support for venture capital is an instrument which is relatively underused, certainly taking into
account that this is a weak spot in the innovation performance of the EU in general and in many EU member states. The UK scores the highest among EU member states on venture capital investment. It has support measures in place, but this is only marginal in terms of TC budget. Fourteen EU countries have no instruments in place supporting venture capital. Of the 12 countries with instruments in place, 9 spent less than 5 percent of their reported TC budget on this programme (Germany spends 2.65 percent). The outlier is Estonia, which introduced this instrument after 2006 and spends 44 percent of its reported TC budget on this programme. Bulgaria (35 percent), France (12.5 percent) and Ireland (15 percent) also spend substantial parts of their reported TC budgets on support for VC. For Ireland and Bulgaria, VC remains one of their weaker spots in the IUS scoreboard; Although France is not among the top scoring EU countries on this, it is one of the aspects on which France scores relatively well.
Box 3: effectiveness of public VC support
Many governments initially established their own VC funds, but these have been largely abandoned. Today government policy in support of VC typically takes the form of capital participation in which the state invests as a special limited partner in a VC fund managed by a commercial venture capitalist – so-called hybrid funds. A special focus for governments when sponsoring VC funds has been micro-funds, restricting investments to below a particular threshold.
Overall the evidence on the effectiveness of public VC support seems positive, but the size of the positive impact remains small. High quality deal flow and development of expertise at the funds is often lacking. Constraining funds by restricting their investments regionally, or preventing them from ‘following-on’ their investments in high potential portfolio companies has proved to be bad practice. This holds true particularly for hybrid micro funds (see Veugelers, 2011).
Less deployed instruments
Public procurement for innovation ranks among the least popular instruments. It is only used in three
percent of the TrendChart reported budget. Likewise public sector innovation is only used in Denmark and Estonia and even there only marginally in terms of budget. This is reminiscent of the common neglect in Europe of the role of public procurement agencies as drivers of demand for innovation. This is in contrast to the US, where government agencies such as DARPA (Defense Advanced Research Projects Agency) play an important role in stimulating innovation.
Support for IPR (direct support provided for patenting, trademarks, copyright and their commercial
exploitation, including provision of information and training) is also not a popular instrument. Only nine countries report in TrendChart that they have an instrument in place, but it is a new arrival in the innovation policy mix; seven out of the nine countries using the instrument introduced it after 2006. In any case, the share of the TrendChart budget allocated to this instrument is marginal, as it never goes above 1 percent.
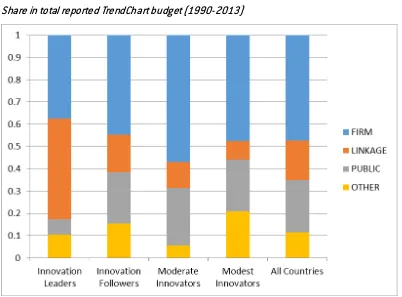
To compare the deployment of innovation policy instruments across EU countries according to their innovation capacity scoring, we group the set of 28 instruments identified in TrendChart in the following four areas.
• Support for Firm R&I investment: tax incentives, loans, innovation support services, support to start-ups, innovation networks and platforms, innovation vouchers, direct business R&D support, direct business innovation support.
• Public R&D: Public R&D infrastructure, competitive funding of research (HEI&PRO), centres of
excellence, public sector innovation.
• Linkage support: incubators, technology transfer, collaborative R&D programmes, mobility
schemes, science and technology parks, cluster initiatives, spin-off support, competence centres.
• Other: awareness raising, support for venture capital, e-society, IPR measures, public
procurement, regional programmes; Support for human resources for R&D; innovation skills development.
companies in R&I (with various instruments), followed by programmes to support public R&D (excluding institutional funding) and programmes to support linkages within the innovation system. The most notable differentiation is the greater share for programmes to support linkages in the innovation leading countries. Beyond this, there are limited differences in the average reported budget shares between innovation leaders and followers, and moderate and modest innovators.
Figure 5: TrendChart budget allocation to various areas, by IUS groups of countries
Share in total reported TrendChart budget (1990-2013)
Source: Bruegel on the basis of TrendChart.
New instruments
Table 1 also shows which of the instruments have been introduced since 2006. The most popular new instrument in EU countries is innovation vouchers.
The Netherlands is the leading country on innovation vouchers. It was one of the pioneering countries in introducing the scheme, and spends the largest amount on this programme compared to other EU countries (about 0.65 percent of its reported TC budget). It has also inspired other EU countries to introduce this instrument.
Limited evaluation evidence (see eg Cornet et al, 2006) suggests that benefits can be substantial: a large share of firms that are granted vouchers would not have undertaken the project without public support. However, the longer-term impact is more difficult to assess. On their own, innovation vouchers appear too small a tool to change the attitude of SMEs towards research organisations and vice versa. As long-term benefits are not obvious, a proper evaluation of the scheme should be done, in order to assess results. In view of the small amounts of money involved, the innovation voucher scheme is an ideal subject for random control trials (see eg Christensen et al, 2015, for Denmark).
Horizontal versus sector-specific instruments
On average, about 10 percent of the measures are reported to be targeted at specific sectors or technology areas, taking up 6 percent of the reported TC budget. This suggests that on average, the innovation policy mix remains fairly untargeted. There is also no discernible trend towards more targeting over the period examined. There are some countries that have a more targeted approach, the most notable being Sweden. While before 2006 Sweden's policy was untargeted, as of 2007 it became more targeted, allocating a major part of the budget to targeted instruments. This contrasts with the other three innovation leaders, Germany, Finland and Denmark, where targeting was, and remains, a small part of the reported TC budget. Another outlier country on targeting is Romania, one of the modest innovating countries.
Inspiration for innovation policy instruments
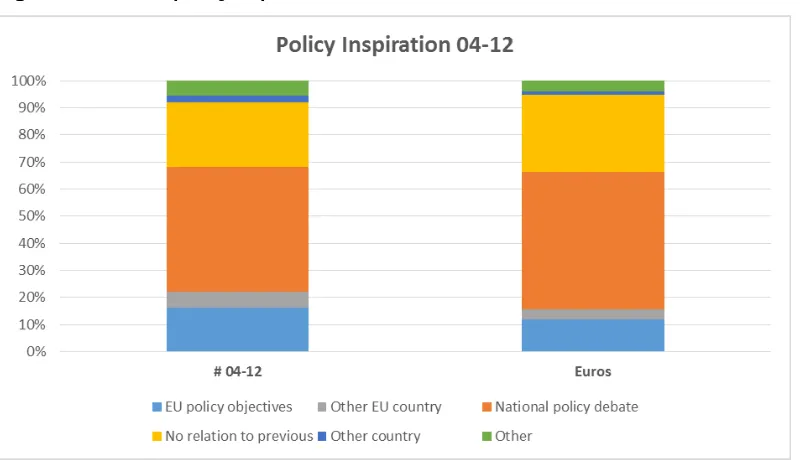
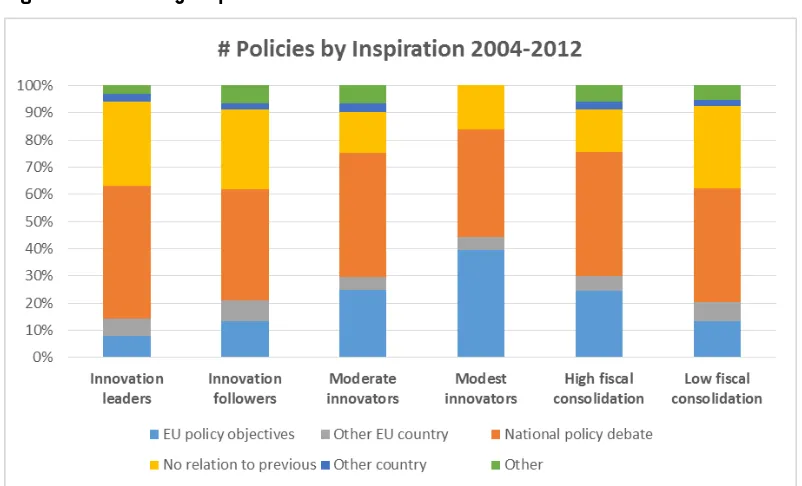
Overall the greatest part of instruments remains ‘inspired’ by national policy debates: 46 percent of instruments and 51 percent of the reported budget. Influence from the EU is sizeable, but not overwhelming. Overall, 17 percent of innovation instruments deployed by EU countries are inspired by ‘EU objectives’ and another 6 percent by learning from ‘other EU countries’. Nevertheless these EU inspired instruments take up only 12 percent, respectively 3.5 percent of the total reported budgets. There is also very little change over time. Overall, ‘national policy debates’ remain the most important inspiration for innovation policies in EU countries on average.
Figure 6: The EU as policy inspiration for member states
Source: Bruegel on the basis of TrendChart. Note: The left column shows the share of total number of TrendChart instruments; the right column shows the share of total TrendChart budget.
Figure 7: Policies by inspiration
Source: Bruegel based on TrendChart.
Summary and conclusions
Our analysis found the mix of innovation policies deployed in EU member states to be pretty standard across EU countries. Most member states appear to deploy similar combinations of instruments, irrespective of their innovation position and the challenges they face. All member states spend most of their programmed innovation budget on a six-pack of instruments that makes up 70 percent of the reported budget outlays. This six-pack includes competitive public research funding, collaborative RDI programmes, direct business support for R&D, direct support for innovation, loans for firms and tax incentives. Of this six-pack of instruments, only tax credits are used differently: for some countries, tax credits are one of the main innovation supports, while others make little use of tax credits. Perhaps most surprising is the large share of funding for collaborative R&D programmes. These are used by most EU countries regardless of their innovation performance and take up a substantial part of reported budgets, especially for the four innovation-leading countries (Sweden, Finland, Germany and Denmark).
The analysis shows that the policy mix pursued by each country has remained quite stable over the past decade. Changes only occur at the margins: relatively modest changes to budgets allocated to existing instruments or introduction of relatively few new instruments with low budgets. It confirms that changes to a policy mix require either a much longer time period or a more substantial ‘policy push’ if a country wants to reform its innovation system.
Some other characteristics of innovation policies deployed in EU countries:
• The innovation policy mix in EU countries remains fairly untargeted. On average, 90 percent of the policies do not focus on particular sectors or technological areas.
• While virtually all EU countries provide support for start-ups, in most cases this is only a very small part of the budget. Moreover, support for venture capital is an instrument which is relatively underused.
• An innovation policy instrument that all EU countries neglect is public procurement to drive demand for innovation (in the remainder listed as ‘public procurement for innovation’. This is remarkable, illustrating the relative weakness of the EU compared with the US, where the instrument is used more prominently.
• An important source of inspiration for policies in member states is the EU (through ‘EU objectives’ or ‘learning from other EU countries’), at least for the moderate and modest innovating countries, less so for the innovation-leading countries, signalling convergence on innovation policy design in the European Research Area.
The analysis shows a relative homogeneity of policy mixes in different countries despite their fairly wide and stable differences in innovation capacity.
The analysis therefore provides a rationale for a more comprehensive examination of policy mixes. The majority of EU country policy mixes need a careful review to assess their adequacy in addressing country-specific innovation challenges.
References
Christensen, T. A., J. Kuhn, C. Schneider and A. Sørensen (2015) ‘Science and Productivity – Evidence from a randomized natural experiment’, paper presented at the SIMPATIC final conference, Brussels, February
Izsák, K., P. Markianidou and S. Radoševic (2013) Lessons from a Decade of Innovation Policy, report for the European Commission, DG Enterprise
Cornet, M., B. Vroomen and M. Van der Steeg (2006) ‘Do innovation vouchers help SMEs to cross the bridge towards science?’ CPB Discussion Papers n. 58, CPB Netherlands Bureau for Economic Policy Analysis
David, P. A., B. H. Hall, and A. A. Toole (2000) ‘Is public R&D a complement or substitute for private R&D? A review of the econometric evidence’, Research Policy 29(4): 497-529
Furman, J. L., M. E. Porter and S. Stern (2002) ‘The determinants of national innovative capacity’, Research Policy 31(6): 899-933
Mohnen, P. (2013) ‘R&D tax incentives’, Policy Brief 2013 no. 25, i4g (Innovation For Growth), European Commission
OECD (2010a) The Innovation Policy Mix. OECD Science, Technology and Industry Outlook 2010, Organisation for Economic Cooperation and Development
OECD (2010b) R&D tax incentives: rationale, design, evaluation, Organisation for Economic Cooperation and Development
Veugelers R. and H. Schweiger (2015) ‘Innovation policies in transition countries’, Economic Change and Restructuring, forthcoming
Veugelers, R. (2011) ‘Mind Europe’s Early Stage Equity Gap’, Policy Contribution 2011/18, Bruegel
Veugelers, R. (2014) ‘Undercutting the future? European research spending in times of fiscal consolidation’, Policy Contribution 2014/06, Bruegel
Appendix: Methodology and database notes
TrendChart coverage and comparison to GBAORD3
The Erawatch/TrendChart inventory reports policy measures that have been launched at the national level across EU member States plus Norway and Switzerland, covering the period 1990-2013. For every policy measure, the inventory reports a starting and ending date, typology, and the allocated budget4.
The TrendChart database includes programme-based research and innovation, but not institutional funding; it captures active innovation policy but not the regular funding of institutions, which can be found in indicators such as GBAORD (Government budget appropriations or outlays for research and development).
In particular, support measures included in the Erawatch/TrendChart are defined as measures that mobilise resources (financial, human or organisational) through publicly (co-)financed research and innovation programmes or initiatives; and/or fund the generation or diffusion of information and knowledge (studies, road mapping, technology diffusion activities, advisory services, public-private partnerships etc) in support of research and innovation activities; and/or promote an institutional process (legal acts or regulatory rules) designed to explicitly influence the undertaking of research and innovation by organizations. In addition, a policy measure is normally implemented on an on-going (multi-annual) basis, rather than being a single project or one-off event.
GBAORD, which covers all appropriations (government spending) given to R&D in central (or federal) government budgets, is the statistic most comparable to TrendChart. Both measures are based on reports by R&D funders, include payment to performers beyond the national territory, and exclude payments from local (and sometimes provincial) governments; while the GBAORD covers only R&D financed by governments, TrendChart also includes co-financing schemes.
There are nevertheless notable differences between the two measures: TrendChart incorporates both R&D and more broadly defined innovation programmes, and hence has a wider coverage of funds
3 Source Lessons From A Decade of Innovation Policy, European Commission publication.
allocated to innovation-oriented activities; it does not include regular yearly funding, complex national operation programmes or policy governance, nor institutional funding for universities or other public research institutions; financing through Structural Funds is included in TrendChart and excluded from GBAORD (explaining the large TrendChart figures compared to GBAORD of Structural Funds dependent countries); loans, among other forms of funding, are included in TrendChart and do not appear in GBAORD.
The main reasons explaining the differences between GBAORD and TrendChart are:
• Financing through structural funds is included in TrendChart. In GBAORD pre-financing of projects financed by EU structural funds is excluded.
• Institutional funding to universities and research organisations is not covered in TrendChart’s support measures database. In GBAORD however the latter is included.
• Loans among other forms of funding are included in TrendChart, while this is not the case in GBAORD.
Policy instruments in TrendChart
• Support for human resources for R&D: measures that support the development of human resources for research (doctoral grants, supporting the professionalisation of research staff, post-doc programmes, supporting participation in international networks, etc).
• Innovation related skills education: support aimed at developing innovation and entrepreneurship skills, support for vocational training with innovation/research dimension, support for innovation management, trainings.
• Competitive funding of research: competitive grants for academic research institutions, universities and non-profit research institutions, focusing on basic research projects or research addressing societal challenges.
• Direct business R&D support: competitive grants provided to enterprises for the engagement in industrial research.
• R&D infrastructure: support to the development of national research infrastructure and to ESFRI – European Strategy for Research Infrastructure plans.
• Regional programmes: programmes aiming to develop innovation and research activities in specific regions.
• Direct business innovation support: support for innovation projects concerning product development, commercialisation, marketing, services innovation, innovation management. • Support for start-ups: support for the creation or early development of innovative enterprises,
including spin-offs from large firms and venture cup type competitions.
• Innovation networks and platforms: support fostering networking of enterprises, business associations, innovation platforms of businesses, universities and research institutions. • Innovation support services: support for innovation intermediaries or for the creation of
innovation advisory structures.
• Innovation vouchers: support for innovation voucher schemes. • Incubators: support for business incubators programmes.
• Collaborative R&D programmes: measures to support R&D projects conducted in some form of co-operation between public/academic/non-profit research institutions and enterprises. • Cluster programmes: policy initiatives specifically aimed at promoting cluster development
and supporting cluster management.
• Mobility between academia and business: encouraging the recruitment of researchers by enterprises and academic recruitment of skilled professionals.
• Technology transfer: measures that encourage the transfer of know-how and technology from research to business (technology transfer offices, SME-academia networks, research commercialisation support structures, etc).
• Competence centres: investments to foster the efficiency of the interaction between researchers, industry and the public sector in research topics that promote economic growth. • Spin off support programmes: measures that aim to facilitate the commercialisation of
research results.
• Science and technology parks: science and technology parks aim at establishing concentration of firms in a particular area, through high quality physical environment located close to universities or research institutes.
• Awareness raising: studies, surveys, dissemination to promote awareness of benefits from innovation.
• IPR measures: support provided for patenting, trademarks, copyright, design rights and their exploitation.
• Financial instruments (loans and guarantees): subsidized loans, guarantees, support to private equity, etc.
• Support for venture capital: public funding provided to private (or public-private) financial service providers aimed at increasing investment into innovation activities of enterprises. • Public procurement: contracting authorities acting as a launch customer for innovative goods
or services.
• Tax incentives: tax credits aimed at encouraging R&D investments, innovation or demand for innovation.
TrendChart: Policy instrument implementation by country
**Status: “New” if a policy instrument was implemented for the first time in 2006 or later; “Stopped” if a policy instrument was not implemented anymore after 2009.
Used 1990-2013 Status** Used 1990-2013 Status Used 1990-2013 Status Used 1990-2013 Status Used 1990-2013 Status Used 1990-2013 Status
Austria X X New X X X
Belgium X X X X
Bulgaria X New X Stopped X
Cyprus X New X
Czech Republic X New X X X
Denmark New X X X
Estonia Stopped X X New X X X
Finland X X Stopped X X X
France X New X X X
Germany X X X
Greece X Stopped X X
Hungary X New X Stopped X X X
Ireland X X New X X X
Italy Stopped Stopped X X
Latvia X X New X New X
Lithuania X New X X X
Luxembourg New X
Malta New X New X
Netherlands X Stopped X New X X
Poland Stopped X X
Portugal Stopped Stopped X New X X
Romania X Stopped X X
Slovakia X New X
Slovenia X Stopped X New X Stopped X Stopped X
Spain Stopped X New X New X X
Sweden X X X X
United Kingdom X X X New X
Competence centre
Country Awareness raising Centres of Excellence Cluster initiatives
Collaborative R&D programme
Used 1990-2013 Status Used 1990-2013 Status Used 1990-2013 Status Used 1990-2013 Status Used 1990-2013 Status Used 1990-2013 Status
Austria X X X Stopped Stopped
Belgium X X X X X
Bulgaria X X New X New New
Cyprus X Stopped X X X X
Czech Republic X X X
Denmark X X Stopped
Estonia X X X
Finland X New Stopped
France X X X X X
Germany X Stopped X
Greece Stopped X X Stopped X Stopped
Hungary X X X New X New Stopped
Ireland X X X
Italy X X X X
Latvia X X Stopped X X Stopped
Lithuania X X X New X
Luxembourg X
Malta X New X New New
Netherlands X X X
Poland X X X X New
Portugal X X X Stopped
Romania X X Stopped
Slovakia Stopped X X X Stopped
Slovenia X X Stopped X Stopped
Spain X X X X New X New
Sweden X X X X
United Kingdom X X Stopped X Stopped
Country
Direct Business R&D support
Direct business
innovation support E-society Financial instrument IPR measures Incubators
Used 1990-2013 Status Used 1990-2013 Status Used 1990-2013 Status Used 1990-2013 Status Used 1990-2013 Status Used 1990-2013 Status
Austria X X X X New X Stopped
Belgium X X X New X New
Bulgaria X
Cyprus X New X X New
Czech Republic Stopped X Stopped X X New
Denmark X X X New X X New
Estonia X X Stopped X New X New
Finland New X X X New
France X X X
Germany X Stopped X X X New New
Greece X X Stopped X New Stopped
Hungary Stopped X X X X
Ireland X X X New Stopped
Italy X X
Latvia X Stopped X New
Lithuania X Stopped X X X New
Luxembourg X
Malta X New Stopped X New
Netherlands X Stopped X X X X Stopped
Poland X New X X X New X New
Portugal Stopped Stopped X X New New
Romania X New
Slovakia X
Slovenia X X X X New
Spain Stopped X X New X
Sweden X X X
United Kingdom X X X X New
Innovation support service Country Innovation networks and platforms Innovation skills
Used 1990-2013 Status Used 1990-2013 Status Used 1990-2013 Status Used 1990-2013 Status Used 1990-2013 Status Used 1990-2013 Status
Austria X X X
Belgium Stopped X X
Bulgaria X X Stopped X
Cyprus Stopped
Czech Republic X X Stopped X
Denmark X New X X
Estonia X X Stopped X X
Finland X X
France X New X X
Germany X X
Greece Stopped Stopped Stopped
Hungary X X X New X
Ireland X New
Italy X X Stopped
Latvia X
Lithuania X New X
Luxembourg
Malta X New Stopped New
Netherlands X X X
Poland X New Stopped X New New
Portugal Stopped
Romania X New X New X Stopped New
Slovakia X X Stopped
Slovenia X X
Spain X X X New X
Sweden X New X
United Kingdom X X Stopped Stopped
Regional programme
Science and
technology parks Spin-off support
Support to human resources for R&D Country
Public sector
innovation R&D infrastructure
Used 1990-2013 Status Used 1990-2013 Status Used 1990-2013 Status Used 1990-2013 Status
Austria X X Stopped
Belgium X X X X
Bulgaria X New X New New
Cyprus X
Czech Republic X X
Denmark Stopped X X
Estonia X New X New Stopped
Finland X X X Stopped
France X X X X
Germany X X X New
Greece X Stopped Stopped
Hungary X X X
Ireland X X X X
Italy X X X
Latvia X X Stopped X
Lithuania X New
Luxembourg X
Malta X X X New
Netherlands X X X X
Poland New X X
Portugal X X Stopped
Romania X Stopped X
Slovakia X Stopped X
Slovenia X New X X Stopped
Spain X X X
Sweden X
United Kingdom X New X X X
Support to venture
capital Tax incentive Technology transfer
