The
ECONOMIC
Background
THE INTERNATIONAL ENVIRONMENT Overview
Prospects for the world economy are still extremely good. All the major regions of the world are expected to see significant growth during this year and next. The US continues to expand and drive the world economy. Forecasts for world economic growth estimate growth to be 4.5% in the year 2000. Emerging market economies, experiencing strong recovery due to the support from fast growing Western economies. In Japan performance is mixed with some encouraging signs of growth and recovery but there are still areas of concern. With the rapid expansion the US has experienced and the long recession in Japan there remains considerable concern over a stock market correction in the US. Further oil price volatility has been adding to inflationary pressures. It would perhaps be better for the world economy if the US slowed slighdy and that Japan and the emerging economies caught up to some degree. The forecasts for the main economic indicators are given in Table 1.
US
Growth in the US in 2000ql was 1.2% which was supported fully by consumption and investment. Stocks and net trade made a negative contribution to GDP growth the latter reflecting the strength of the dollar. The preliminary data for 2000q2 demonstrates that consumption has weakened slightly but there is strong investment growth resulting in quarterly GDP growth of 1.3%. Productivity growth slowed slightly in 2000ql. Industrial confidence fell in June for the fourth month running despite increased industrial production, rising retail sales and strong consumer confidence. Housing market data do show however that there has been a slight cooling here. The oudook for the US this year remains promising with growth of 4.8% being forecast and 3.3% in 2001. Short term interest rates are expected to rise
to 7.5% during 2001 and this should avoid overheating in the economy.
[image:1.522.290.491.320.521.2]Producer prices have risen slightly in the US with headline producer inflation rising by 4.3% in the year to June 2000. The core index (excludes food and energy) only rose by 1.3% for the same period. Headline inflation in the US has been affected by the recent rise in oil prices. For the year to June core and headline consumer rose to 2.4% and 3.7% respectively. The OECD has revised its forecasts of inflation for 2000 in the US to 2.1%, up 0.2%. Employment growth for 2000q2 in the US has slowed by about half of that seen in the first quarter of the year. Unemployment however remained at 0.4% in June, which is close to its average for the year. Labour cost pressures remain subdued as average hourly earnings grew by 3.6% in the year to June and the growth rate of the Employment cost Index was unchanged from 2000ql.
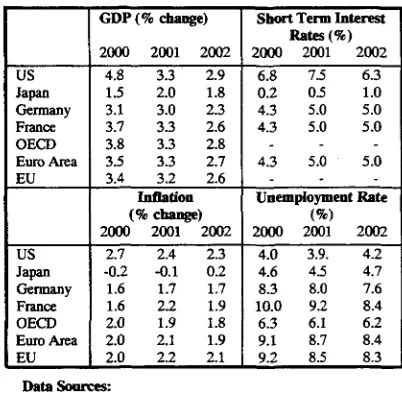
Table 1: Forecasts of International Main Economic Indicators; 2000-2002.
US Japan Gennany France OECD Euro Area EU
US Japan Gennany France OECD EuioArea EU
GDP (% change)
2000 2001 2002 4.8 3.3 2.9 1.5 2.0 1.8 3.1 3.0 2.3 3.7 3.3 2.6 3.8 3.3 2.8 3.5 3.3 2.7 3.4 3.2 2.6
Inflation (% change)
2000 2001 2002 2.7 2.4 2.3 -0.2 -0.1 0.2
1.6 1.7 1.7 1.6 2.2 1.9 2.0 1.9 1.8 2.0 2.1 1.9 2.0 2.2 2.1
Short Term Interest Rates (%)
2000 2001 2002 6.8 7.5 6.3 0.2 05 1.0 4.3 5.0 5.0 4.3 5.0 5.0
4.3 5.0 5.0
Unemployment Rate
(%)
2000 2001 2002 4.0 3.9. 4.2 4.6 4.5 4.7 8.3 8.0 7.6 10.0 9.2 8.4 6.3 6.1 6.2 9.1 8.7 8.4 9.2 8.5 8.3
Data Sources:
Fraser of Allander Institute, Bank of England Quarterly Economic Bulletin, Barclays Economic Review, Financial Times, IMF World Economy, National Institute Economic Review, OECD Economic Outlook, and various others.
Europe
with the weakness of the Euro. The outlook for GDP growth for the Euro Area remains favourable especially with both Italy and Germany now growing in line with the Euro Area average, which is 3.4% this year and 3.2% in the following year.
In the year to May producer prices rose by 6.5% from 5.7% in the year to April. Consumer price inflation in the year to June rose by 0.5% taking it to 2.4%, which is 0.4% above the upper limit. Core inflation was 1.2% in June, an increase of 0.2% on the previous month. HJCP inflation was highest in Ireland (4.0%) and lowest in France (0.2%). The OECD forecast for inflation in the Euro Area is 1.5% for 2000 and 1.9% for 2001. While employment continues to rise in the Euro Area participation rates are still lower than in the US, (66% as opposed to 78% for 1999). Unemployment was 9.2% in May and this compares favourably with 10% a year ago. Labour costs increased in the Euro Area for 2000ql by 3.5% after a rise of 2.4% in 1999q4. This may reflect a tighter labour market due to skills, and geographical mismatches even though unemployment remains relatively high.
Japan and Asia
GDP growth was 2.4% for 2000qlin Japan but the critical factor here however, is that this was supported by private spending and investment. Net trade also made a positive contribution to GDP growth. Further increases in incomes and bonuses could yet increase spending again in the second quarter. Data does suggest that investment spending has peaked but there could be further additions to investment through retained earnings. The Tankan Survey indicates that business confidence is growing. The wholesale Price Index fell by 0.6% in the year to June. Headline consumer prices were 0.7% lower than they were in June a year ago. This is mainly due to lower import prices, which reflects the recent appreciation of the Yen. The fall in the prices of goods has decelerated partly due to the rise in the oil price (and associated petroleum product prices). Employment in Japan has not yet picked up despite reasonable output growth. In June the unemployment rate was 4.7%, which is close the average rate of 1999. GDP growth is forecast to be 1.5% this year and 2.0% in 2001, with inflation remaining close to zero.
UK MACROECONOMIC TRENDS
In the second quarter of 2000, the estimate of GDP at market prices - 'money' GDP - rose by 0.9%. After allowing for inflation, GDP at constant 1995
market prices also grew by 0.9%, compared with
0.5% in the first quarter, 0.7% in the fourth quarter of 1999,1% in the third quarter, 0.8% in the second quarter, and 0.3% in the first quarter. Over the year
to the second quarter, 'real' GDP at constant
market prices is estimated to have risen by 3.1%.
CIHIBIW prtcganwl growth n*—-on • • • n q M i t ^ In i w l u u p j w GDP at market prices
3
1 i
2
0 4 , , , , i . , 1 , 1 1 , . . r
1997 1996 1999 2000 SMtfOK O N S
Output of the production industries in the second
quarter rose by 1.4%, after falling by 0.8% in the first quarter, to a level 2.2% higher than the same period a year ago. Within production:
manufacturing output rose by 0.4%, after
contracting by 0.5% in the first quarter, output of the other energy and water supply industries rose by 6.2%, and mining & quarrying, including oil
& gas extraction rose by 5.3%. Manufacturing
output in the first second was 1.8% above the same period a year ago. The output of the service sector rose by 0.9% in the second quarter, compared to a 0.6% increase in the first quarter. Over the year to the second quarter, service sector output rose by 3.5%. The construction industry experienced a decrease in output in the second quarter of 0.7%, with output in the industry rising by 3.5% over the year.
In the second quarter of 2000, real households'
expenditure (which is consumers' expenditure minus expenditure by non-profit making
institutions serving households) rose by 0.8%. This compares, on revised data, with a 0.6% increase in the first quarter, a 1.5% rise in the fourth quarter 1999, a 0.8% rise in the third quarter, a 1% rise in the second quarter, and a 1.7% rise in the first quarter. Spending during the second quarter rose by 3.7% on the same period a year earner. In the second quarter, households' expenditure again provided the main positive contribution to GDP. The contribution to the GDP growth rate of 0.90% was 0.51%. The official seasonally adjusted estimate of retail sales volume for the three months to August indicates an increase of 1.1% over the preceding three months and a rise of 4.2% over the same period a year earlier. The seasonally adjusted household saving ratio fell to 3.8% in the first quarter from, on revised figures, 5% in the fourth quarter 1999, 4.1% in the third quarter, 6.6% in the second quarter and 4.4% in the first quarter. The fall in the saving ratio smoothed out the effect on household expenditure of the fall in Real
household disposable income (RHDI) in the first
than in the first quarter 1999. The reported underlying increase in average weekly earnings for the three months to June 2000 compared with the same period a year ago was 4.1%, compared to an increase of 4.6% in the year to the three months ending in April and 5.1% in the year to March. In the three months to June, private sector earnings grew by 4.2% over the year, while earnings in the public sector grew by 3.7%. On these data earnings growth continues to slow.
General government final consumption rose by
1.9% in the second quarter. This can be compared, on revised figures, to a decrease of 0.7% in the first quarter, an increase of 0.3% in the fourth quarter 1999, an increase of 0.2% in the third quarter, no change in the second quarter, and a 1.8% rise in the first quarter. Government consumption in the second three months of the year was 1.7% higher than in the corresponding quarter of 1999, making a positive contribution of 0.34% points to overall GDP growth of 0.90% in the second quarter.
Real gross fixed investment or Gross fixed capital
formation rose by 0.25% in the second quarter to a level 0.8% higher than in the second quarter of 1999. Investment made a contribution of 0.05% points to overall GDP growth in the second quarter.
Inventory investment made a zero contribution to
growth in the second quarter after positive contributions in the three preceding quarters.
Turning now to the balance of payments. The
current account for the first quarter 2000
registered, after seasonal adjustment, a deficit of
£4.0bn. This follows deficits of £1.5bn in the fourth quarter 1999, £2.7bn in the third quarter, £2.7bn in the second quarter, and £4.1bn in the first quarter. For trade in goods and services the deficit improved slightly to £4.0bn in the first quarter from £4.6bn in fourth quarter, £2.6bn in the third quarter, £3.1bn in the second quarter and £4.9bn in the first quarter. For income and current
transfers the surplus fell to less than £0.1bn from
£3.1bn in the fourth quarter 1999, a deficit of £0.1bn in the third quarter, a surplus of £0.5bn in the second quarter, and a surplus of £0.8bn in the first quarter. In the second quarter of 2000, net exports made a small negative contribution of -0.03% points to overall GDP growth of 0.90%. Both exports (2.62%) and imports (2.34%) grew strongly during the quarter.
Crjnatart prfcaanfHrtojawthnrtaa-on aama Quarter In prairlousyi Gross fixed capital formation
UK LABOUR MARKET
Employment and Unemployment
Under the ILO definition, the level of UK unemployment for the quarter to July stands at
1,580,000. This is an absolute reduction of 104,000 (6.2%) over the previous quarter and 166,000 (9.5%) over the previous year. The aggregate unemployment rate for the quarter is 5.3%. This rate is slightly higher for men, at 5.8%, than for women at 4.8%. The aggregate unemployment rate has been falling consistently over the past 2 years, a situation broadly reflected in the figures for the separated male and female rates. The UK ILO unemployment rate remains well below the EU average rate, which is 8.3%, though six EU countries, Austria, Denmark, Ireland, Luxembourg, Netherlands and Portugal have lower rates of unemployment, as do the USA and Japan. The August claimant count definition of UK unemployment shows a lower absolute level (1,051,300) and rate (3.6%) than the ILO definition. However, the two measures are qualitatively similar in identifying the consistently falling unemployment that has occurred over the past year.
continues inexorably. Total employment in the quarter from May to July numbered 27,966,000 and this represents an employment rate of 74.7% of the population of working age. The UK employment rate is at present above every other country in the EU except Denmark. This total employment level represents an increase of 93,000 (0.3%) on the figure for the previous quarter and 354,000 (1.3%) on the figure for the previous year. However, the employment experience in the different sectors of the UK economy varied markedly. Data exist for workforce jobs broken down by industrial sector. The jobs figures differ from the number employed as one person can have more than one job. They are available up to June and show a fall in the number of manufacturing jobs by 0.8% in the quarter and by 2.3% in the year. The only other sector that is revealed as experiencing job losses over the previous year is Energy and Water, whose employment is down 0.7% in the quarter and 3.3% over the year. The highest absolute and proportionate change in employment is found in Construction, with a 3.5% increase for the quarter and 4.2% over the year. However, the two sectors Finance and Business Services and Public Administration, Education and Health also have persistent employment growth over similar time periods.
Whilst the total employment and unemployment figures change in a rather consistent manner, the level of vacancies notified at Job Centres seems to fluctuate around a relatively stable level. The notified vacancy figure for August is actually 0.6% lower than the figure for August 1998, and whilst there has been an increase in the number of vacancies over the previous quarter of 8.7%, the movement for individual months is erratic.
Earnings and Productivity
The GB headline (3 months average) annual increase in whole-economy earnings stood at 3.9% in July. This figure had been rising from the middle of 1999 to early 2000 to reach a peak of 6% but has fallen consistently since February. There is a significant variation in wage increases between sectors. The headline figure in the private sector, at 4.0%, is somewhat above the increase in the public sector, which stood at 3.4%. This is a consistent trend that has been very marked over the previous two years where earnings increases in the private sector have, in general, far outstripped those in the public sector. Again, the headline rate of increase in earnings to July in manufacturing is 4.7% whilst in both private and public services it stands at 3.5%.
In the first quarter of 2000, the annual rate of growth of labour productivity in the whole
economy was 2.1%, up from 2.0% in the previous quarter and 1.2% in the first quarter of 1999. The figures for manufacturing productivity change are higher, with the annual increase registering the value 3.0% for the year to July. However, this manufacturing figure has been falling consistently since its recent peak of 5.6% in December 1999. Given the productivity and wage change figures, we observe an annual increase in the whole-economy unit labour costs to the first quarter of 2000 of 2.9%. The corresponding increase in manufacturing to July is 1.4%.
UK OUTLOOK
The growth of UK GDP picked up in the second quarter after the slowdown in the first three months of the year. In expenditure terms, the main explanation for the pickup was a revival in the growth of total domestic expenditure, which was almost stagnant in the first quarter. A stronger growth of household expenditures in the second quarter accounted, in part, for the revival but the biggest change in domestic expenditures during the second quarter occurred in government consumption. Spending by government, which contracted by nearly 1% in the first quarter, grew by almost 2% in the second three months of the year, contributing 0.34% points to overall GDP growth of 0.9%. To be balanced against this was the weaker performance of net exports, which made a small negative contribution to growth after the strong positive contribution in the first quarter. Nevertheless, the growth of export volumes was stronger in the second quarter compared to the first three months, although imports grew even more strongly. In addition, the investment component of domestic demand remains worryingly weak, with almost no growth evident in the second quarter after the sharp deterioration between January and March.
At the sectoral level, the pickup in domestic demand and overall GDP growth was reflected in the output of both the production and service industries. Quarterly service sector growth rose from 0.6% to 0.9%, while manufacturing output rose by 0.4% after the 0.5% contraction in the first quarter. The energy sectors were also buoyant in the second quarter, which is, in part, a reflection of increases in the price of oil. The strengthening of export demand will have helped manufacturing to weather the continuing effects of the strong pound, despite recent falls, while the revival in domestic demand will also have cushioned the sector as well as fuelling the growth of imports.
about 2.1% per annum, with the Bank of England forecasting that the indicator will, on the balance of probabilities, remain under the 2.5% official target for the remainder of this year. However, there is the prospect of the target being exceeded later next year. Underlying average earnings growth has continued to fall, while pressures in the housing market have subsided. Despite the effects of rising oil prices, annual producer price inflation slowed to 2.5% in August from its June peak of 2.9%. However, the rise in oil prices is adding to the pressure on costs.