Int. J. Electrochem. Sci., 12 (2017) 1970 – 1982, doi: 10.20964/2017.03.31
International Journal of
ELECTROCHEMICAL
SCIENCE
www.electrochemsci.org
Design and Implementation of Tester for Thermoelectric
Parameter of Lithium Ion Battery and Its Electrode Materials
Yifeng Liu1, Liubin Song2,*, Jie Shen1, Jiao Liu2, Zhongliang Xiao2
1
Department of Art Design, Hunan Women’s University, Hunan Changsha 410004, PR China.
2
School of Chemistry and Biological Engineering, Changsha University of Science and Technology, Hunan Changsha 410004, PR China.
*
E-mail: [email protected]
Received: 12 December 2016 / Accepted: 9 January 2017 / Published: 12 February 2017
Thermal issues of lithium ion battery are key factors affecting the safety, operational performance, life and cost of lithium ion battery. Effective assessment on thermoelectric performance of lithium ion battery and its electrode materials is an important measure to improve the safety of lithium ion battery. In this paper, the tester for thermoelectric parameter of lithium ion battery was developed based on our previous thermo-electrochemical studies of LiFePO4 and LiMn2O4 materials for lithium ion battery
[1-2]. The methods of electrochemical calorimetry, the visual identification system design, and the technological structure optimization and upgrading were applied to the appearance design, modular design, technological structure optimization, and application promotion for laboratory-used battery thermoelectric performance tester. The tester was used to study thermal and electric performance on LiNi0.5Co0.2Mn0.3O2 cathode materials at different ambient temperatures and charge-discharge rates.
The results showed that the tester was of high intelligence and easy to operate. It was designed for measuring the capacity, the density of energy and the cycle life of lithium ion battery. The discharge specific capacity decreased with the increasing of charge-discharge rates and ambient temperatures. At low rate (0.2 C) heat flow of battery increased slowly and appeared a plurality of exothermic peaks, but at high rates (0.5 C, 1.0 C, 2.0 C) heat flow increased rapidly and only an exothermic peak appeared at the charge and discharge stage respectively. Through the study of thermo-electrochemistry, a series of thermodynamic parameters of lithium ion batteries during charge-discharge process were achieved. These works will contribute to the battery structure optimization and thermal management design.
1. INTRODUCTION
With the rapid growth of the battery industry, the utilization of performance-tester during battery manufacture becomes increasingly crucial. Testing battery status parameters during battery production is the key to good battery quality. Current battery performance-tester monitors only the temperature of the battery cell during the charge-discharge cycle, but it cannot assess its safety performance. Therefore, an accurate assessment of battery safety performance and evaluation of its electrical performance should be urgently resolved. Since the success of their commercialization in 1990, lithium-ion (Li-ion) batteries have become the secondary chemical power sources that have exhibited remarkable performance. Li-ion batteries are increasingly used in the military and aerospace fields and have been gradually used in energy storage and electric automobile industries. However, the performance of the Li-ion battery is considerably affected by temperature. Excessively high temperature and uneven temperature distribution may accelerate the degradation of battery performance, shorten battery service life, and result in thermal runaway, thereby leading to safety issues [3-5]. Safety issues concerning Li-ion batteries are attributed to heat production and dissipation of battery. Thermal-related issues correlate with charge-discharge performance and cycle life of the battery and its electrode material. The battery material affects the heat generation amount and heat release rate. Conventionally, charge-discharge capacity, cycle performance, rate performance, and other parameters are used to evaluate the performance of the electrode material, but they cannot reflect the heat production characteristics of the battery. Consequently, an exploration of the effective evaluation methods for thermoelectric performance of the Li-ion battery and its electrode material under complex conditions exhibits considerable significance in addressing the safety issues of the Li-ion battery.
battery or half-battery system as the object of study. In addition, the thermal behavior within operational limits is mainly studied so the thermal data obtained are mainly about the overall heat effect of the Li-ion battery [11-15]. However, the reaction heat effect generated on the positive or negative electrode may be different or even completely opposite. During the reaction process, a significant difference exists between the heat release on the positive electrode and that released on the negative electrode of the battery. Thus, the difference in heat effect among different positions must be considered when making the thermal design of the Li-ion battery, particularly the large-capacity Li-ion battery pile system. Such consideration helps optimize the thermal design of the battery system and effectively reflects the thermal-electrochemical properties of battery materials. Therefore, the heat effect of a single electrode should be investigated.
On the basis of the aforementioned reasons, this study designs a device to test the thermoelectric properties of single electrode of ion battery according to the requirements of the Li-ion battery test, characteristic test, and evaluatLi-ion. The device could be used to test the reactLi-ion heat effect generated on a single electrode of Li-ion battery, acquire accurate thermoelectric parameters, and accordingly evaluate the thermoelectric properties of the electrode material in a considerably objective manner. In this paper, the electrochemical and thermodynamic performances of LiNi0.5Co0.2Mn0.3O2 cathode materials were studied by using this tester. The effect of charge-discharge
rate and ambient temperature on thermal and electrical parameters was observed.
2. EXPERIMENTAL
2.1. Preparation of LiNi0.5Mn0.2Co0.3O2 cathode material
LiNi0.5Mn0.2Co0.3O2 powders was prepared by mixing the prepared Ni0.5Co0.2Mn0.3(OH)2
precursor with Li2CO3 at a molar ratio of (Li:M=1.05:1, M=Ni, Co, Mn) manual grinding about 40 min
and was first calcined at 500 ℃ for 5 hours in air, then heated to 960 ℃ for 10 hours in air with heating rate of 5 ℃ min-1
and cooling of the sample to obtain LiNi0.5Mn0.2Co0.3O2 cathode material.
2.2. Operating principle of tester
Consequently, the under-test battery undergoes the process of charging or discharging. Voltage, current, and other parameters during the process are collected by the multichannel electric signal processing module. The digital signals converted by the first A/D converter are recorded by analyzer and stored as a data file. An ampoule bottle is used, and the heat released by the under-test battery because of electrochemical reaction is converted by the thermopile inside the calorimeter into a heat flow signal, which is subsequently processed by the heat flow signal processing module. The signal is recorded by the analyzer and stored as a data file after conversion by the second A/D converter.
Figure 1. Operating principle diagram of thermoelectric performance testing on lithium ion battery: the charge-discharge setting module of the battery (1); thermal conductivity calorimetric measurement module (2); the battery holder and connector (3); signal processing module (4); the calorimeter (5); the ampoule bottle plug (6); the ampoule bottle (7); electric signal processing module (8); the first A/D converter (9); the analyzer (10); the second A/D converter (11); the heat flow signal processing module (12).
[image:4.596.135.477.217.468.2]
0 ( )
t
i t dt Q
n
F F
(1) 10 ( )
t ch
q
h t dt (2) 20 ( )
t disch
q
h t dt (3)total ch disch
q q q (4)
, ,
0 /
( ( ) ) /
total r m r m ch r m disch total t
q
H H H q n
i t dt F
(5)2 ch disch r m q q S nT
(6)
r r m
q T S (7)
rGm rHm T rSm
(8)
Where n(mol) is the amount of substance. Q(C) is the quantity of electricity in the reaction. F(C mol-1) is the Faradic constant. i(t) (mA) is the current at time t. t(s) is the reaciton time. qtotal(mJ) is the total heat for the chemical reaction, qch(mJ) and qdisch(mJ) are the heat of charge and discharge for the chemical reaction, respectively. t1(s) and t2(s) are the reaction times in the charge and discharge processes, respectively. h(t)(mW) is the heat flow at time t. qr(mJ) is Peltier heat, which produced in the reversible reaction. T(K) is the operation temperature. △rHm(kJ mol-1), △rHm,ch(kJ mol-1),
△rHm,disch(kJ mol-1) are the enthalpy change for the chemical reaction in the charge, discharge, and total recycle processes, respectively. △rSm(J mol-1 K-1) and △rGm(kJ mol-1) are the entropy change and the Gibbs free energy change for the chemical reaction, respectively.
Battery capacity, specific capacity, internal resistance, and other characteristic parameters of the under-test battery can also be determined by the analyzer according to the electric signal. The aforementioned test signal and calculation results are all displayed on the analyzer screen. The analyzer can import other data files in advance. The data are the average values of the experimental data obtained from the batteries of different media, different rates, and different sizes or made of different materials. A model is established through Support Vector Machines (SVMs) and artificial intelligence methods. The model could evaluate the battery performance efficiently and assess whether the under-test battery is eligible.
2.3. Thermo-electrochemical performance test
The tester for thermoelectric performance was shown in Fig. 2. Heat flow of LiNi0.5Mn0.2Co0.3O2 cathode material for lithium ion battery at different temperature (30 ℃, 40 ℃, 50
℃) was measured during different charge-discharge rates (0.2 C, 0.5 C, 1.0 C, 2.0 C) setting voltage range of 2.7-4.6 V. Cyclic voltammetry test of LiNi0.5Mn0.2Co0.3O2 battery was carried out at a scan
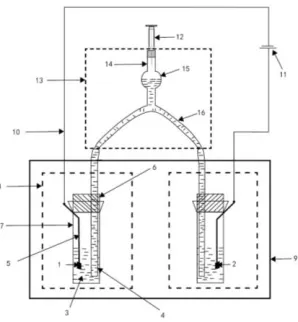
Figure 2. Schematic diagram of tester for thermoelectric performance: cathode material (1); anode material (2); electrolyte (3); polytetrafluoroethylene tube (4); stainless steel net (5); the rubber stopper (6); the ampoule bottle (7); the measurement channel (8); the isothermal calorimeter (9); the copper wire (10); the battery testing system (11); an injector (12); an inverted Y-type glass tube (13); the upper branch of an inverted Y-type glass tube (14); the spherical or ellipsoidal protrusion of an inverted Y-type glass tube (15); the lower arc-shaped branch of an inverted Y-type glass tube (16).
3. RESULTS AND DISCUSSION
3.1. Structure optimization design of tester
[image:6.596.225.374.71.232.2]
reaction. The under-test battery consists of two identical lithium electrodes, one of which is fixed in the copper mold and in the calorimeter, and the other is placed outside the calorimeter. An electrolyte-filled plastic pipe is used to connect both electrodes. The tester allows the reversible heat effect research to focus on the positive and negative electrodes of the Li-ion battery system. However, some limitations are observed. The two under-test electrodes are placed inside and outside the calorimeter. A relatively long distance exists between both electrodes, so the plastic pipe is considerably long. In this case, bubbles may be generated in the electrolyte and may be difficult to remove. Consequently, the internal resistance increases, thereby affecting the accuracy of test results. As the current collector of the Li-ion battery, copper is not fully compatible with the electrolyte system, and the electrolyte is corrosive to the Li-ion battery. When copper is corroded or dissolved, the electrode material fixed at the copper mold falls off, which hinders the electronic transmission and directly undermines the performance and safety of the Li-ion battery. The present study developed a new single electrode testing device for thermal-chemical research by improving the functions to overcome the aforementioned limitations (Fig. 2) and efficiently determine the reaction heat effect on the single electrode inside the Li-ion battery. The device is composed of an isothermal calorimeter, measurement channel, copper wire, battery testing system, and an inverted Y-type glass tube. This glass tube is composed of upper branches and lower arc-shaped branches. All these branches are interconnected. A spherical or ellipsoidal protrusion is present among the upper branches. An injector is placed at the opening of the upper branches to pump out air and remove bubbles from the electrolyte to decrease internal resistance. The two openings of lower arc-shaped branches are connected to the opening of two polytetrafluoroethylene tubes, and the joints are sealed. The testing device features a simple structure and easy operation; it could evaluate the safety performance of the battery and assess the thermoelectric properties of the electrode material simultaneously. This device also boosts test accuracy and helps optimize the thermal design of the battery system.
battery and single electrodes and the heat amount generated in the charge-discharge process according to the constants specified on the isothermal calorimeter can be obtained. The integral area determined on the basis of time and current data in the electric signal is the electrical amount of the different charge and discharge processes. Furthermore, the chemical reaction enthalpy change during the charge-discharge process of the battery and single electrode could be determined according to the total amount of reaction heat and the number of moles reacted. The reversible heat effect of electrode reaction, chemical reaction entropy change, and chemical reaction Gibbs free energy fluctuation during the charge-discharge process can be obtained according to fundamental thermodynamic equations (1)-(8).
The equipment developed in this study features a T-branch design that enables the removal of bubbles from the electrolyte, thereby reducing the effect of internal resistance on the measured results and enhancing data accuracy. The T-branch pipe is made of polytetrafluoroethylene, which features high corrosive resistance. The upper branch of the T-branch pipe is 8-10 cm long, and the liquid is kept at 1/3-1/2 height of the upper branch. The polytetrafluoroethylene tubes connecting the lower left and lower right branches are all 25-30 cm in length. The location of an ampoule bottle in the test channel is also considered in the design. Consequently, the traveling distance of the electrolyte is shortened, bubbles are avoided, and the internal resistance generated during the electrode reaction process is reduced. The stainless steel net in the device is the current collector used to wrap the positive or negative electrode; its compatibility with the electrolyte system is superior to that of copper, and it is mainly used to transmit ions. The stainless steel net is made of martensitic grade stainless steel, which exhibits high thermal conductivity and strong corrosive resistance; its oxidation resistance is also higher than that of copper. The stainless steel net is L-shaped. The vertical part could be used as a tab that protrudes through the gap between the rubber stopper and ampoule bottle, and connects with the copper wire. The horizontal size matches the electrode size. The electrode can be wrapped well after folding, which helps improve the cycle performance of the battery. The developed equipment could also be used to explore the reaction heat effect on the single electrode of battery under complex conditions and obtain the electric and thermal parameters of different single electrodes.
3.2. Electrochemical performance of LiNi0.5Mn0.2Co0.3O2
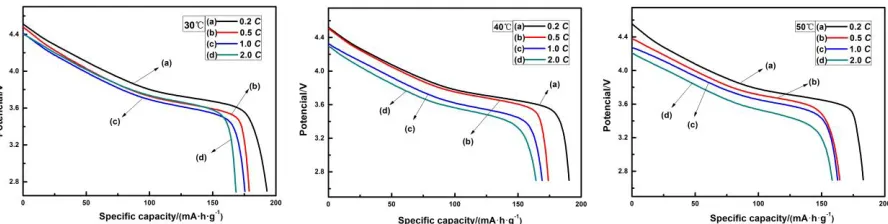
The initial discharge curves of LiNi0.5Mn0.2Co0.3O2 at different temperature are shown in Fig. 3.
With the increase of rate and temperature, the specific capacity decreased. The battery had a smaller polarization and better reversibility during low range charge-discharge process. However, a noticeable decrease in the plateau voltage at high discharge rates (0.5 C, 1.0 C, and 2.0 C) existed, resembling the change of discharge specific capacity. When the discharge rate was elevated from 0.1 C to 2.0 C at the targeted temperature, battery capacity loss increased gradually. The structure and morphology of the cathode material was partially destroyed in the discharge process with high current density. The diffusivity of lithium ions within the LiNi0.5Mn0.2Co0.3O2 cathode and the related polarization of the
LiNi0.5Mn0.2Co0.3O2 electrode decreased. Thus, the discharge capacity of the battery was reduced with
Figure 3. Initial discharge curves of LiNi0.5Co0.2Mn0.3O2 at different rates (0.2 C, 0.5 C, 1.0 C, 2.0 C)
and different temperature (30℃, 40 ℃, 50 ℃)
Table 1. Discharge capacity of LiNi0.5Co0.2Mn0.3O2 at different rates (0.2 C, 0.5 C, 1.0 C, 2.0 C) and
different temperature (30℃, 40 ℃, 50 ℃)
Discharge specific capacity mAh g-1
Temperature
30 ℃ 40 ℃ 50 ℃
0.2 C 192.9 190.4 182.9
0.5 C 178.8 174.0 164.3
1.0 C 175.5 169.0 162.7
2.0 C 168.5 164.2 155.2
3.3. Thermodynamic performance of LiNi0.5Mn0.2Co0.3O2
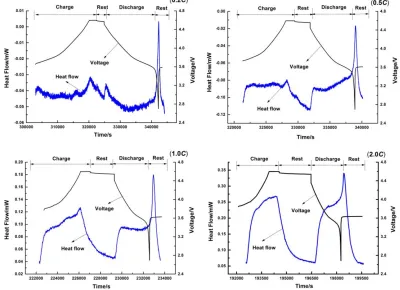
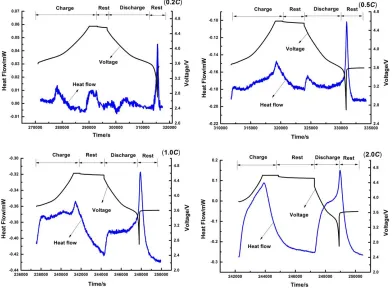
Figs. 4-6 show the variation in the heat flow of LiNi0.5Mn0.2Co0.3O2 at different temperature (30
℃, 40 ℃, 50 ℃), as a function of time at different charge-discharge rates (0.2 C, 0.5 C, 1.0 C, 2.0 C). It can be shown from these figures that two obvious exothermic peaks appeared during the charge-discharge process at high rates (0.5 C, 1.0 C, 2.0 C). But at low rate (0.2 C), the obvious exothermic peaks exceeded two. The heat flow slowly increased at the initial stage of charge-discharge process at low rate (0.2 C), but increased rapidly at high rates (0.5 C, 1.0 C, 2.0 C). The heat flow increased during the charge-discharge process with increasing rate because the irreversible heat production rate of the battery increased with the increase of the discharge rate [27-28]. The whole charge-discharge stage of the LiNi0.5Mn0.2Co0.3O2 was accompanied by exothermic process and endothermic
Figure 4. Change curves of heat flow-voltage with time of LiNi0.5Co0.2Mn0.3O2 at different charge-
discharge rates (0.2 C, 0.5 C, 1.0 C, 2.0 C) at 30℃
Figure 5. Change curves of heat flow-voltage with time of LiNi0.5Co0.2Mn0.3O2 at different charge-
[image:10.596.98.498.385.675.2]
Figure 6. Change curves of heat flow-voltage with time of LiNi0.5Co0.2Mn0.3O2 at different charge-
discharge rates (0.2 C, 0.5 C, 1.0 C, 2.0 C) at 50℃
Table 2. Thermodynamic parameters for LiNi0.5Co0.2Mn0.3O2 at different rates (0.2 C, 0.5 C, 1.0 C,
2.0 C) and different temperature (30℃, 40 ℃, 50 ℃)
Temperature
℃
Rate C
qch
(mJ)
nch
(10-5 mol)
△rHm(ch)
(kJ mol-1)
qdis
(mJ)
ndis
(10-5 mol)
△rHm(dis)
(kJ mol-1) 30
0.2 -53.40 1.84 -2.90 -92.50 1.78 -5.19
0.5 -149.69 2.10 -7.13 -127.65 1.90 -6.72
1.0 -209.03 1.92 -10.85 -166.24 1.73 -9.61
2.0 -308.16 1.65 -18.63 -266.01 1.45 -18.35
40
0.2 -159.55 1.93 -8.26 -96.74 1.82 -5.32
0.5 -178.34 1.75 -10.19 -195.36 1.71 -11.46
1.0 -291.08 1.93 -15.06 -212.82 1.72 -12.38
2.0 -404.81 1.94 -20.87 -362.38 1.71 -21.20
50
0.2 -170.69 1.70 -10.06 -132.11 1.62 -5.31
0.5 -144.45 1.62 -8.91 -224.38 1.60 -6.72
1.0 -229.10 2.13 -14.07 -299.54 1.87 -6.61
2.0 -465.48 2.30 -20.26 -502.58 1.94 -25.91
[image:11.596.58.536.474.671.2]
the cell originated mainly from irreversible heat, which was produced by overcoming the cell internal resistance.
A series of electrochemical and thermodynamic parameters were obtained based on equations (1)-(8), the corresponding values were list as shown in Table 2. As shown in Table 2, the enthalpy changes were increased with the increasing of charge-discharge rate. The possible reason is that the battery polarization effect would be increased with the increasing of current in the battery. The smaller the rate, the lesser the total heat for the chemical reaction, the lesser the total enthalpy change in the reaction, and the higher the safety performance of the battery.
4. CONCLUSIONS
In this paper, we optimized the multidisciplinary advantages of the university to combine industrial design and Research and development ideas on products and electrochemical-calorimetric technique to develop a simple and easily operated testing device for thermoelectric properties of the single-electrode battery. This equipment can evaluate the safety performance of the battery and assess the thermoelectric properties of electrode materials simultaneously by measuring the thermal and electric parameters. The equipment features a T-branch design that allows the removal of bubbles from the electrolyte, reduce the effect of internal resistance on measured results, and enhance data accuracy. The results of thermo-electrochemical properties on LiNi0.5Co0.2Mn0.3O2 cathode materials by using
the tester showed that charge-discharge rate and ambient temperature are the key factors affecting the lithium-ion batteries. With the increasing of rate and temperature, heat production and enthalpy change of cathode materials increased and discharge capacity decreased. The greater the entropy value was, the greater the confusion degree and reversible worse were. With the thermoelectric and chemical parameters, artificial intelligent and structural features of the tested lithium battery, and its positive and negative electrodes, the exploration of the new multidisciplinary development of the product based on the improvements to the existing battery performance-tester can satisfy the requirements of the charge-discharge test of the Li-ion battery, characteristic test, and safety test. Data to support the battery test and evaluation can be obtained subsequently.
ACKNOWLEDGEMENTS
This work was financially supported by the National Natural Science Foundation of China (21501015), the Hunan Provincial Natural Science Foundation of China (2016JJ3007), the Hunan Provincial Philosophy and Social Science Foundation of China (15YBA215).
References
1. L. B. Song, X. H. Li, Z. X. Wang, H. J. Guo, Z. L. Xiao, F. Zhang, S. J. Peng, Electrochim. Acta, 90 (2013) 461.
2. L. B. Song, Z. L. Xiao, L. J. Li, Q. Q. Zhou, J. Solid. State Electrochem., 19 (2015) 2167. 3. L. G. Lu, X. B. Han, J. Q. Li, J. F. Hua, M. G. Ouyang, J. Power Sources, 226 (2013) 272.
210.
5. D. Lisbona, T. Snee, Process Saf. Environ. Prot., 89 (2011) 434.
6. X. P. Qiu, P. Xiao, W. T. Zhu, Chinese J. Power Sources, 30 (2006) 953. 7. Y. Saito, J. Power Sources, 146 (2005) 770.
8. W. Q. Lu, H. Yang, J. Prakash, Electrochim. Acta, 51 (2006) 1322.
9. L. J. Krause, L. D. Jensen, J. R. Dahn, J. Electrochem. Soc., 159 (2012) 937.
10.P. Ping, Q. S. Wang, P. F. Huang, J. H. Sun, C. H. Chen, Appl. Energy, 129 (2014) 261. 11.Y. Saito, K. Kanari, K. Takano, T. Masuda, Thermochim. Acta, 296 (1997) 75.
12.H. Maleki, S. A. Hallaj, J. R. Selman, R. B. Dinwiddie, H. Wang, J. Electrochem. Soc., 146 (1999) 947.
13.H. F. Jin, Z. Liu, J. Power Sources, 189 (2009) 445.
14.Z. Jiang, J. Zhang, L. Dong, J. Zhuang, J. Electroana. Chem., 469 (1999) 1.
15.Y. Kobayashi, H. Miyashiro, K. Kumai, S. Uchida, J. Electrochem. Soc., 149 (2002) 978. 16.W. Jiang, Packaging Eng., 31 (2010) 130.
17.V. Segarra, L. Duenas, R. Torres, D. Falla, G. Jull, E. Lluch, Manual Ther., 20 (2015) 570. 18.A. Jaafar, C. Turpin, X. Roboam, E. Bru, O. Rallieres, Math. Comput. Simulat., 131 (2017) 21. 19.T. Dagger, C. Lurenbaum, F. M. Schappacher, M. Winter, J. Power Sources, 342 (2017) 266. 20.B. Severino, F. Gana, R. Palma-Behnke, P. A. Estevez, J. Power Sources, 267 (2014) 288. 21.W. U. Tareen, S. Mekhilef, Energy, 109 (2016) 525.
22.F. Xiao, L. Han, X. P. Chu, J. F. Xue, Q. B. Chen, M. Lei, L. X. Zhang, Appl. Mech. Mater., 148-149 (2011) 67.
23.L. B. Song, Z. L. Xiao, Y. Zhou, Electrochim. Acta, 114 (2013) 611. 24.X. D. Xu, H. W. Liu, G. H. Feng, Meas. Ctrl. Tech., 29 (2010) 39. 25.Q. S. Jin, B. W. Wang, Chinese J. Power Sources, 1 (2005) 7. 26.H. Qian, M. M. Yan, Z. Y. Jiang, J. Power Sources, 156 (2006) 541. 27.W. Q. Lu, H. Yang, J. Prakash, Electrochim. Acta, 7 (2006) 1322.
28.V. V. Viswanathan, D. W. Choi, D. H. Wang, W. Xu, S. Towne, R. E. Williford, J. G. Zhang, J. Liu, Z. G. Yang, J. Power Sources, 195 (2010) 3720.