Int. J. Electrochem. Sci., 12 (2017) 1463 – 1473, doi: 10.20964/2017.02.53
International Journal of
ELECTROCHEMICAL
SCIENCE
www.electrochemsci.org
A Study of the Electrochemical Performance of Strip
Supercapacitors under Static and Dynamic Mechanical Tests
Ruirong Zhang*, Yanmeng Xu*, David Harrison and John Fyson
Cleaner Electronics Group, College of Engineering, Design and Physical Sciences, Brunel University London, Uxbridge, UK
*
E-mail: [email protected], [email protected]
Received: 1 September 2016 / Accepted: 20 December 2016 / Published: 30 December 2016
Flexible and stretchable supercapacitors have a big potential of being used in portable and wearable electronics because of their high power density, high reversibility, fast charge/discharge rates and long life cycles. In this study, strip supercapacitors were fabricated by a blade coating process using low-cost materials. The electrochemical performance of the strip supercapacitors was studied under both static and dynamic tensile stress conditions in order to evaluate their suitability for use in wearable textiles. The results showed strip supercapacitors under static and dynamic mechanical tensile process worked well: the capacitance and specific capacitance for this strip supercapacitor sample with the static loading of 100 N or 200 N was bigger than that of this sample without loading, with an increase of 22% and 9%, respectively. The mechanical compression was applied vertically from the top of the strip supercapacitor sample to further investigate the reason for the capacitance increase under loading conditions.
Keywords: Flexible supercapacitors · Static and dynamic mechanical test · Mechanical pressure · Electrochemical performance
1. INTRODUCTION
Supercapacitors can provide high power as compared to rechargeable batteries, and store larger amounts of energy than conventional capacitors, and are considered to bridge the gap between them [10, 11]. Many commercial supercapacitors are still too bulky and rigid as the power sources for portable and stretchable electronics [5, 12]. It is a critical to make thinner, lighter, flexible and stretchable supercapacitors to meet the demand of portable and stretchable electronics. Recently, some attempts have been made in this area [12-18]. For example, Fu et al. [16] developed a flexible fibre supercapacitor using pen ink as the active material for the first time. This fibre supercapacitor showed good flexibility and the electrochemical performance changed slightly in a bending test. Pushparaj et al. [12] designed and fabricated flexible energy storage devices based on carbon nanotubes-cellulose-room temperature ionic liquid nanocomposite sheet, and they showed good electrochemical performance and the ability to function over large ranges of mechanical deformation. Chen and co-workers [6] fabricated smart supercapacitors by depositing polyaniline onto aligned carbon nanotube sheet electrodes. Because of this continuous, aligned structure in the composite electrode, these kind of smart capacitors are stretchable and flexible with a high stability. Most of the research on flexible and stretchable supercapacitors concentrated on the development of novel electrode materials, but only a few studies were focused on the property and electrochemical performance during the dynamic and static mechanical process of stretching and flexing supercapacitors [19, 20]. In this work, thin strip supercapacitors using commercial activated carbon (AC) as the electrode material were designed and fabricated. The electrochemical performances of the strip supercapacitors under static and dynamic mechanical tensile testing processes were studied. Furthermore, the effects of a mechanical compression test on the electrochemical performance of the strip supercapacitors were also investigated.
2. EXPERIMENTAL
2.1 Materials
AISI 316L (Fe/Cr18/Ni10/Mo3) stainless steel foil with a thickness of 0.05 mm was used as the current collector. AC was used as the active materials of electrodes and was mixed with a binder (carboxymethyl cellulose, CMC). Filter paper (thickness is 130 ± 1 µm) was used as the separator. Tetrabutylammonium tetrafluoroborate (C16H36BF4N, 99%) was dissolved into propylene carbonate
(C4H6O3) to prepare the electrolyte. All the materials above were commercially available and used
without further treatment.
2.2 Design and Manufacture of the strip supercapacitors
electrode materials were dried to eliminate the water, then the organic electrolyte (1 mol/L) was dropped on the surface of active materials and the separator. Two electrodes fully wetted with the electrolyte were held apart by the separator, and then assembled to fabricate a strip supercapacitor with a sandwich like structure. Finally, a laminator was used to seal the strip supercapacitor to keep the electrolyte from evaporating. More details or this fabrication process can be found in previous work published [21].
2.3 Experimental conditions
2.3.1 Mechanical tensile test method and conditions for the strip supercapacitors tested
All strip supercapacitors fabricated identically for the mechanical tensile tests have the structure as follows: the thickness of the activated materials was 375 μm, the binder content was 5% (based on the total weight of solids), and the electrolyte concentration was 1.0 mol/L. The electrode size of the samples for the mechanical tensile test was 2 mm × 100 mm.
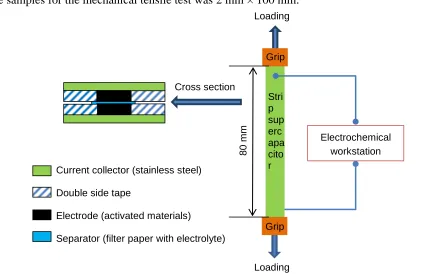
Figure 1. Schematic diagram of a cross-section of a typical strip EDLC sample (left side) and mechanical tensile test methods on this strip EDLC sample (right side)
Mechanical tensile stress tests were performed with an Instron machine (Model 2580-106/105924). The length between the two grips, where the tensile loading was applied, is 80 mm. The configuration of the test is also shown in Fig. 1. A VersaSTAT 3 electrochemical workstation was connected with the sample during the testing process. The cyclic voltammetry (CV) curves of the sample were recorded using this electrochemical workstation when the sample was stretched at a static loading of 0 N, 100 N, 200 N, and at the dynamic loading process from 0 to 100 N as well as 0 to 200 N. In order to obtain a complete CV curve at the scan rate of 0.020 V/s, the increasing rate of loading
80
m
m
Grip
Grip Stri p sup erc apa cito r Loading
Loading
Electrochemical workstation
Current collector (stainless steel)
Double side tape
Electrode (activated materials)
[image:3.596.96.517.317.591.2]
was fixed at 25 N/min for the dynamic loading process of 100 N, and 50 N/m for the process of 0-200 N.
2.3.2 Mechanical pressure test method and conditions
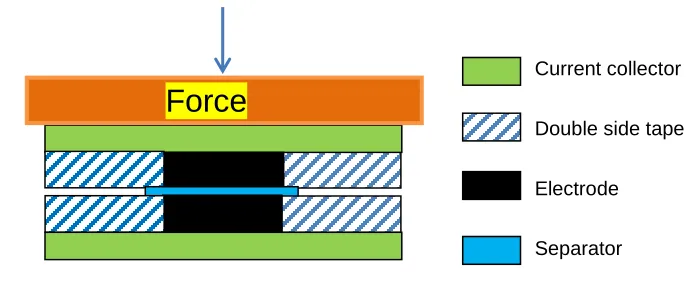
A series of experiments for the strip supercapacitors under mechanical pressure condition were also carried out in order to find the correlation between the compression and the electrochemical performance. Fig. 2 shows the configuration of the compression tests. Force plates with different weights (7.2 N and 8.9 N) were put on the surface of the current collector vertically, and electrochemical performances of the sample under the different forces were measured and characterised by electrochemical workstation.
[image:4.596.128.471.355.497.2]The strip supercapacitor used in the mechanical compression test has the same thickness of the activated materials (375 μm), binder content (5% of the total weight of solids) and electrolyte concentration (1.0 mol/L) as the sample used in the mechanical tensile testing. Electrode size of the sample for the mechanical compression test was 5 mm × 100 mm in order to fit the experimental rig properly.
Figure 2. Schematic of the mechanical compression test methods
2.4 Measurement of the electrochemical performance
The electrochemical performance of the EDLCs developed was measured using a VersaSTAT 3 electrochemical workstation. CV and galvanostatic charge-discharge (GCD) tests were carried out to obtain the capacitance, and the electrochemical impedance spectroscopy (EIS) was used to detect the impedance of the sample as a function of frequency.
Based on the CV curve, the capacitance, C1, can be calculated by the equation [1]:
(1)
where Qtotal is the supercapacitor’s charge in coulombs at maximum voltage, which is measured
by the CV curve. ΔV is the voltage between the device’s terminals in volts (V).
Based on the GCD curve, the capacitance, C2, can be directly calculated by using the following
equation:
Force
Current collector
Double side tape
Electrode
(2)
where i is the discharge current in amperes (A); Δt is the discharging time in seconds (s), and ΔV is the voltage of the discharge (V).
The specific capacitance can be calculated as follows:
(3)
Where Cs is the specific capacitance of the electrode, C is the capacitance, and m is the average
mass of AC in each electrode.
3. RESULTS AND DISCUSSION
3.1 Mechanical tensile tests of the strip supercapacitor
As shown in Fig. 3, five CV curves were recorded when the sample was stretched at a static loading of 0 N, 100 N, 200 N, and at the dynamic loading process from 0 to 100 N and 0 to 200 N at the scan rate of 0.020 V/s, respectively. The area of the CV curve for this strip supercapacitor under the static tensile condition of 100 N or 200 N is bigger than the sample without loading. It shows that the capacitance increased when there was a tensile stress of 100 N or 200 N applied to the sample. When the dynamic loading applied from 0 to 100 N at the increasing rate of 25 N/min, the area of the CV curve is quite close to the CV curve of the sample under the static loading of 100 N, which is also bigger than that of the sample without any loading. Similarly, the area of the CV curve for this sample in the dynamic loading process of 0-200 N is close to the CV curve of the sample under the static loading of 200 N, which is also bigger than that of the sample without any loading. All the capacitances for the sample under the different conditions calculated from the CV curves (C1) by
[image:6.596.178.416.73.250.2]
0.0 0.5 1.0 1.5 2.0 2.5 -0.006 -0.004 -0.002 0.000 0.002 0.004 0.006 0.008 C urr en t, A Potential, V 0 N 0-100 N 100 N 0-200 N 200 N
[image:6.596.39.554.378.491.2]Figure 3. CV curves on the static loading of 0 N, 100 N, 200 N, and in the dynamic loading changing process of 0-100 N and 0-200 N at the scan rate of 0.020 V/s
Table 1. Capacitances and specific capacitances based on the CV curves recorded on the static tensile loading of 0 N, 100 N, 200 N, in the dynamic loading increasing process of 0-100 N and 0-200 N at the scan rate of 0.020 V/s
Performance Condition
Capacitance, F Specific Capacitance, F/g
Increase, % (compared with
original value)
0 N 0.135 (original) 31.3 (original) 0
0-100 N (dynamic) 0.169 39.3 25
100 N (static) 0.165 38.3 22
0-200 N (dynamic) 0.149 34.4 10
200 N (static) 0.147 34.0 9
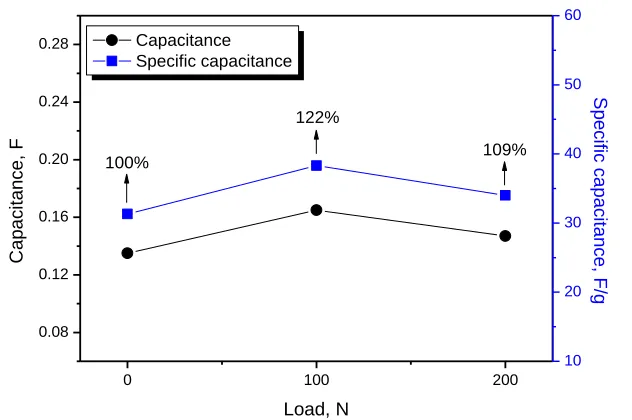
0 100 200
[image:6.596.146.462.515.725.2]0.08 0.12 0.16 0.20 0.24 0.28 109% 122% Capacitance Specific capacitance Load, N C ap aci tan ce, F 100% 10 20 30 40 50 60 S pe ci fic cap aci tan ce, F/g
It is also noticed that the capacitance for the sample with the loading of 200 N is smaller than that of the sample with 100 N. It is probably because the tensile loading of 200 N results in distortion of the structure reducing the AC porosity of the strip supercapacitor, which has a negative effect on its electrochemical performance.
3.2 Mechanical pressure tests of the strip supercapacitor
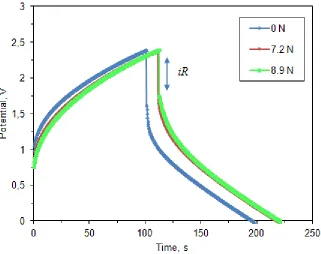
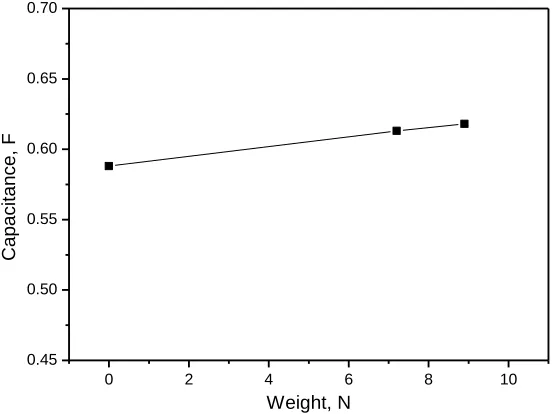
[image:7.596.138.459.470.724.2]Further study of the electrochemical performance of the strip supercapacitors was carried out under the static compression conditions where the force was applied vertically on the top surface of the supercapacitors (see Fig. 2). It has been proved that the values of the capacitance calculated from CV curve and GCD curve to be very similar [23], thus in this experiment the GCD test was used to measure the capacitance of the sample. Fig. 5 shows the GCD curves of the strip supercapacitor sample under different weights. It is obvious that the charge and discharge times are extended when the force was applied on the sample. It is also found that the iR drop of the GCD curve for the sample with force decreased compared with that of the original sample suggesting that the resistance had decreased. The capacitances based on the GCD curves were calculated by Equation (2). The capacitance of the strip supercapacitor with the force of 7.2 N is 0.613 F, which increased 4.3% compared with the capacitance of the sample without any force. When the force increased slightly from 7.2 to 8.9 N, the capacitance increased from 0.613 to 0.618 F, and the capacitance increased 5.1%. This result is consistent with the tests when the supercapacitor was under the tensile conditions. Under the compression conditions, the contact of the layers in the supercapacitor became better which may result in a resistance decrease.
[image:8.596.51.540.354.724.2]
EIS was used to further study the capacitance of supercapacitors along with the intrinsic property change of resistance under the force. Fig. 6 showed the Nyquist plots of the strip supercapacitor under different force conditions (0 N, 7.2 N and 8.9 N) using a 4 mV AC modulation in a frequency range of 100 kHz to 0.01 Hz. Table 2 gives the capacitances calculated from Fig. 5 and impedance information obtained from Fig. 6. At high frequency, the equivalent series resistance (ESR) values of the strip supercapacitor under different load conditions are 3.8 Ω for 0 N, 4.0 Ω for 7.2 N and 4.0 Ω for 8.9 N, respectively. The ESR values of this strip supercapacitor changed slightly under different force. Generally, ESR value is mainly determined by the electrolyte resistance and the contact resistance at the interface between active material and current collector [23, 24]. The strip supercapacitors used in this study were sealed properly with a laminator which protects the structure and avoids the electrolyte evaporating, so the electrolyte resistance and the contact resistance at the active material/current collector will not change remarkably under moderate force, which results in the a slight change of the ESR values.
Table 2. Capacitances based on the GCD curves, ESRs and CTRs for the sample under the pressure of 0 N, 7.2 N and 8.9 N
Performance Condition
Capacitance, F
Increase, % (compared with
original value)
ESR, Ω CTR, Ω
0 N 0.588 (original) 3.8 115
7.2 N 0.613 4.3 4.0 59
[image:8.596.154.450.451.722.2]8.9 N 0.618 5.1 4.0 52
Moreover, the semicircle at high frequencies corresponds to the charge transfer limiting process, and the semicircle diameter represents the charge transfer resistance (CTR) [24, 25]. When the force increased from 0 to 7.2 N, the diameter of the semicircle decreased approximately from 115 to 59 Ω, illustrating the CTR of the strip supercapacitor decreased about 56 Ω. When the force increased from 7.2 to 8.9 N, the diameter of the semicircle decreased slightly from 59 to 52 Ω.
Fig. 7 shows the effect of the force on the capacitance of the strip supercapacitors, and Fig. 8 shows the corresponding ESRs and CTRs of this sample under different force. It was clear that the capacitance increases when the force increases. When the force increases, although the value of ESR changes slightly, the CTR drops dramatically. This is considered as the reason in which the capacitance for this kind of strip supercapacitors increased when the force is added.
0 2 4 6 8 10
0.45 0.50 0.55 0.60 0.65 0.70
C
ap
aci
tan
ce,
F
[image:9.596.157.434.260.467.2]Weight, N
Figure 7. Effect of the force on the capacitance of the strip supercapacitor.
0 2 4 6 8 10
0 2 4 6 8
ESR CTR
Weight, N
E
S
R
,
0 20 40 60 80 100 120 140
C
TR
,
[image:9.596.151.445.520.726.2]
4. CONCLUSIONS
In this study, strip EDLCs were successfully fabricated by blade coating using low-cost materials. The strip supercapacitors under static and dynamic mechanical tensile process worked well: the capacitance and specific capacitance for this supercapacitor sample with the static loading of 100 N or 200 N was bigger than that of this sample without loading, with an increase of 22% and 9%, respectively. Furthermore, it was found that the capacitance increased when the sample was in the mechanical pressure conditions. The reason was believed to be that the mechanical force was beneficial to the contact of each part in the strip supercapacitor which resulted in a low charge transfer resistance.
ACKNOWLEDGEMENTS
This work was supported by the European Union Seventh Framework Programme (FP7/2007-2013) under grant agreement no. 281063.
References
1. S. Park, S. Jayaraman, Mrs. Bull., 28 (2003) 585-591.
2. L.B. Hu, F.L. Mantia, L.F. Cui, S. Jeong, H.D. Deshazer, J.W. Choi, S,M Han, Y. Cui, Nano Lett., 10 (2010) 708-714.
3. D. Kim, N. Lu, R. Ma, Y.S. Kim, R.H. Kim, S. Wang, J. Wu, S.M. Won, H. Tao, A. Islam, K.J. Yu, T. Kim, R. Chowdhury, M. Ying, L. Xu, M. Li, H.J. Chung, H. Keum, M. McCormick, P. Liu, Y.W. Zhang, F.G. Omenetto, Y. Huang, T. Coleman, J.A. Rogers, Science, 333 (2011) 838-840. 4. J.Y. Sun, C. Keplinger, G.M. Whitesides, Z.G. Suo, Adv. Mater., 26 (2014) 7608-7614.
5. J. Bae, M.K. Song, Y.J. Park, J.M. Kim, M.L. Liu, Z.L. Wang, Angew. Chemie. - Int. Ed., 50 (2011) 1683-1687.
6. X.L. Chen, H.J. Lin, P.N. Chen, G.Z. Guan, J. Deng, H.S. Peng, Adv. Mater., 26 (2014) 4444-4449.
7. H,Y, Jin, L.M. Zhou, C.L. Mak, H.T. Huang, W.M. Tang, H.L.W. Chan, Nano Energy, 11 (2015) 11, 662-670.
8. S. Xu, Y. Zhang, J. Cho, J. Lee, X. Huang, L. Jia, J.A. Fan, Y.W. Su, J. Su, H.G. Zhang, H.Y. Cheng, B.W. Lu, C.J. Yu, C. Chuang, T. Kim, T. Song, K. Shigeta, S. Kang, C. Dagdeviren, I. Petrov, P.W. Braun, Y.G. Huang, U. Paik, J.A. Rogers, Nat. Commun., 4 (2013) 1543-1548. 9. D.J. Lipomi, B.C.K. Tee, M. Vosgueritchian, Z. Bao, Adv. Mater., 15 (2011) 1771-1775. 10.R. Kötz, M. Carlen, Electrochim. Acta, 15-16 (2000) 2483-2489.
11.J.R. Miller, P. Simon, Science, 321 (2008) 651-652.
12.V.L. Pushparaj, M.M. Shaijumon, A. Kumar, S, Murugesan, L.J. Ci, R. Vajtai, R.J. Linhardt, O. Nalamasu, M. Ajayan, Proc. Natl. Acad. Sci. USA, 104 (2007) 13574-13577.
13.K. Wang, W.J. Zou, B.G. Quan, A.F. Yu, H.P. Wu, P. Jiang, Z.X Wei, Adv. Energy Mater., 1 (2011) 1068-1072.
14.G. Milczarek, A. Ciszewski, I. Stepniak, J. Power Sources, 196 (2011) 7882-7885.
15.X.Y. Zhang, X.Y. Wang, L.L. Jiang, H. Wu, C. Wu, J.C. Su, J. Power Sources, 216 (2012) 290-296.
16.Y.P. Fu, X. Cai, H.W. Wu, Z.B Lv, S.C. Hou, M. Peng, X. Yu, D.C. Zou, Adc. Mater., 24 (2012) 5713-5718.
18.J. Bae, Y.J. Park, J.C Yang, H.W Kim, D.Y. Kim, J. Solid State Electrochem., 19 (2015) 211-219. 19.X. Li, T.L. Gu, B.Q. Wei, Nano Lett., 12 (2012) 6366-6371.
20.X.B. Zang, M. Zhu, X.M. Li, Z. Zhen, J.C. Lao, K.L. Wang, F.Y. Kang, B.Q. Wei, H.W. Zhu, Nano Energy, 15 (2015) 83-91.
21.R. Zhang, Y. Xu, D. Harrison, J. Fyson, D. Southee, Int. J. Electrochem. Sci., 11 (2016) 675-684. 22.X. Huang, M. Zhong, Y. Huang, M.S. Zhu, Z.X. Pei, Z.F. Wang, Q. Xue, X.M. Xie, C.Y. Zhi, Nat.
Commun., 6 (2015) 1-8.
23.R. Zhang, D. Harrison, J. Fyson, F. Qiu, D. Southee, Int. J. Autom. Comput., 12 (2015) 43-49. 24.W.H. Cai, T. Lai, W.L. Dai, J.S. Ye, J. Power Sources, 255 (2014) 170-178.
25.B.G. Choi, J. Hong, W.H. Hong, P.T. Hammond, H, Park, ACS Nano, 5 (2011) 7205-7213.