ARTICLE
OPEN
Parsimonious Gene Correlation Network Analysis (PGCNA):
a tool to de
fi
ne modular gene co-expression for re
fi
ned
molecular strati
fi
cation in cancer
Matthew A. Care 1,2, David R. Westhead2and Reuben M. Tooze 1
Cancers converge onto shared patterns that arise from constraints placed by the biology of the originating cell lineage and
microenvironment on programs driven by oncogenic events. Here we define consistent expression modules reflecting this structure
in colon and breast cancer by exploiting expression data resources and a new computationally efficient approach that we validate
against other comparable methods. This approach, Parsimonious Gene Correlation Network Analysis (PGCNA), allows comparison of
network structures between these cancer types identifying shared modules of gene co-expression reflecting: cancer hallmarks,
functional and structural gene batteries, copy number variation and biology of originating lineage. These networks along with the mapping of outcome data at gene and module level provide an interactive resource that generates context for relationships between genes within and between such modules. Assigning module expression values (MEVs) provides a tool to summarize
network level gene expression in individual cases illustrating potential utility in classification and allowing analysis of linkage
between module expression and mutational state. Exploiting TCGA data thus defines both recurrent patterns of association
between module expression and mutation at data-set level, and exemplifies the polarization of mutation patterns with the leading
edge of module expression at individual case level. We illustrate the scalable nature of the approach within immune response related modules, which in the context of breast cancer demonstrates the selective association of immune subsets, in particular mast cells, with the underlying mutational pattern. Together our analyses provide evidence for a generalizable framework to enhance
molecular stratification in cancer.
npj Systems Biology and Applications (2019) 5:13 ; https://doi.org/10.1038/s41540-019-0090-7
INTRODUCTION
A primary driver in tumor classification is enhanced precision
through molecular characterization. Such analysis provides an
increasingly complex view of individual tumor biology,1resulting
in the concept of combinatorial characterization using multiple
platforms. An extension is provided by pan-cancer classification
where cases associated with key molecular features are combined
potentially across the boundaries of conventional classification.2
Gene expression-based classifications have defined both
prog-nostically and pathogenetically distinct cancer subtypes,3–6which
have preferential association with mutational and cytogenetic
profiles.7 Use of reduced sets of genes allows recognition of
subtypes in applied classifications.8,9 The cancer hallmark
para-digm postulates that aberrantly regulated features assemble in
modular fashion to promote malignancy.10 Thus, an integrated
assessment of these features might also take a modular approach within individual cancers.
With multiple data-sets the pattern of correlation between individual pairs of genes can be used to determine intrinsic
modules of gene co-expression.11 Exemplifying how modular
patterns of co-expression can be identified within the overall
profile of a tumor, gene expression allows inference of tumor
infiltrating immune populations.12,13Existing expression data-sets
provide an extensive resource for individual types of cancer, which
sit alongside multiparameter analysis across diverse cancer types in resources such as TCGA. We considered that a network analysis of cancer expression data could provide added value by generating a visual structure that contextualizes patterns of gene co-expression across large data-sets, but given the complexity of
expression data this would depend on efficient reduction in the
number of edges connecting genes in the network. A test for such a data-led approach lies in the ability to resolve modules of co-expressed genes associated with known meaningful biology within and between cancer types. We reasoned that by addressing these goals using an unsupervised method, without prior assumptions, we would be able to assess the resulting networks against pre-existing paradigms and as a platform for molecular
stratification of cancer. In the latter context we envisaged
mapping the discovered modules onto gene expression
data-sets to generate module ‘fingerprints’ per sample/patient and
using these derived‘fingerprints’to study relationships between
module biology and external factors such as gene mutation state. Providing a conceptual framework for this study, previous successful methods for network analysis have generated
sig-nificant insights in model systems and clinical data.14–17However,
such approaches are not intrinsically designed to generate networks across multiple data-sets. Furthermore, a common challenge in extracting meaning from network-based analysis is
Received: 4 September 2018 Accepted: 18 March 2019 1
Section of Experimental Haematology, Leeds Institute of Medical Research, University of Leeds, Leeds LS9 7TF, UK and2
Bioinformatics Group, School of Molecular and Cellular Biology, University of Leeds, Leeds LS2 9JT, UK
the potentially very high density of connectivity. Although this can be successfully negotiated using approaches that focus onto
modular patterns of gene expression.18
Here we test a conceptually simple, parsimonious approach to the problem of connectivity reduction as a means of deriving modular expression networks across the gene expression data resource for breast and colon cancer. We test the utility of the resulting networks as a platform to explore multi-parameter data such as TCGA.
RESULTS
Parsimony enhances gene expression network clustering A challenge in analyzing gene co-expression patterns is how to exploit multiple data-sets, with potentially very large numbers of genes and correlations, to derive an integrated and tractable visualization of gene co-expression patterns, while also generating modules of gene co-expression that can be used in downstream analyses of related data. We reasoned that a parsimonious
approach in which only a restricted number of the most significant
correlations (edges) per gene (node) are retained might provide a focusing effect in network analysis. To address this, we developed a method in which the correlation patterns of gene co-expression
are integrated across multiple data-sets, by first deriving a
per-data-set correlation matrix, and then combing these to generate a merged correlation matrix based on the median correlations and
p-values across different data-sets. A particular challenge lies in
the high degree of connectivity of these data, resulting in difficulty
interpreting the relationships between nodes. To address this issue, we conceived of a simple approach in which for each gene
only the edges reflecting the most highly correlated genes are
retained (Edge Per Gene: EPG; where EPG3=retaining 3 edges per
gene). These are assembled into a matrix in which a gene may retain additional correlations if it represents a common partner of other genes in the matrix (Supplemental Fig. 1 for methods outline and Supplemental Methods for further details; both in Supplemental Materials). We applied this approach to expression
data-sets for breast cancer (BRCA,n=26 expression data-sets) and
colorectal cancer (CRC,n=11 expression data-sets). Applying the
radical edge reduction thresholds of EPG3—EPG10 resulted in a
linear relationship with total edges in the network, reducing edges by a factor of between 250 (EPG10) to 900-fold (EPG3) (Supplemental Table 1). The resulting parsimonious correlation matrices were tested in network generation.
Clusters of gene co-expression were derived from correlation matrices using three approaches: hierarchical clustering, K-means
clustering or a computationally efficient network tool, fast
unfolding of communities in large networks (FastUnfold).19 In
each instance clusters were generated from matrices in which
genes retained all edges (edges withp-value >0.05 set to zero and
thus removed) or parsimonious matrices (EPG3—EPG10;
Supple-mental Table 1). To compare the resulting partitioning of the data, the clusters of co-expression (subsequently referred to as modules, Supplemental Table 2) were then tested for the separation of known biology, based on enrichment of ontology and signature terms. This was assessed using a scaled cluster
enrichment score (SCES), which takes into account the significance
of enrichment of ontology and signature terms within a module, the extent to which the enrichment of signature or ontology term
is specific to an individual module rather than being shared across
multiple modules, and the balance of gene number associated with individual modules. Strikingly, when using EPG parsimonious matrices, the network method (FastUnfold) provided the most
significant enrichment and segregation of ontology terms. This
was a particular feature of the combination of FastUnfold with parsimonious matrices as applying FastUnfold to the total correlation matrix without parsimonious edge reduction resulted
in poor separation of the data (Fig. 1a). For each cancer type,
decreasing the retained edge per gene (minimum EPG3) led to an increasing number of resolved modules (Supplemental Fig. 2a). This corresponded to an improved segregation of biology
between modules across both cancers (Fig. 1a). Indeed, there
was no significant benefit to retaining more than 3 edges per
gene (EPG3), while at this level of edge reduction the number of modules remained manageable for downstream analysis (Supple-mental Fig. 2a). Notably the use of parsimonious matrices in conjunction with FastUnfold outperformed both hierarchical and k-means clustering of the data even where all edges were
retained. While parsimonious matrices did not confer benefit to
the separation of data when using these other clustering methods. For the EPG3/FastUnfold combination robustness was tested for the best 100 clusterings, showing that for each cancer type modules retained a high proportion of the same genes across different clustering runs (Supplemental Fig. 2b, c). Network solutions generated with the combination of FastUnfold and parsimonious matrices were scale-free across all the EPG thresh-olds tested (Supplemental Fig. 2d). This is not the case for application of FastUnfold to the total untrimmed correlation data
(filtered by hard threshold; Supplemental Fig. 2e) which also failed
to generate effective resolution of biology between modules. Thus, we concluded that a combination of edge reduction with the FastUnfold approach enhanced the resulting network solution in gene correlation data.
Next to assess whether EPG edge reduction with FastUnfold provides a particular advantage we compared different edge
refinement methods. This compared the EPG3 approach against
iPCC,20a power function or the sigmoid functions of the Weighted
Gene Correlation Network Analysis package (WGCNA),15as input
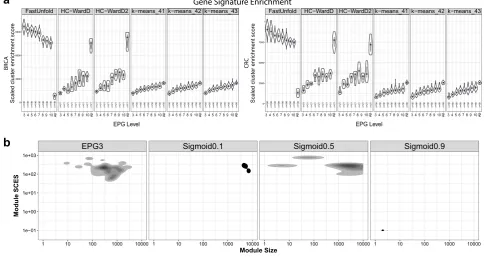
into FastUnfold. Because WGCNA is mainly aimed at single data-set analysis we evaluated these four approaches using represen-tative large expression data-sets for BRCA and CRC. The results were compared in terms of the retained edge number (edges <0.01 removed; providing an indication of the degree of edge reduction), the total number of modules resolved in the data, the
number of modules with >5 genes per module (as a reflection of
balanced module size), the median module SCES as indicator of separation of biology between modules, the median sum of SCES as an indicator of the total enrichment of biology across the network, and the percentage of genes connected in the network. Overall when compared against the other methods the combina-tion of EPG3 with FastUnfold provided both a suitable module number and size for downstream evaluation and the greatest sum of biological signature enrichments across the network. Neither iPCC or power function produced a substantial edge reduction and when used in combination with FastUnfold this resulted in
separation of the data into 2–4 modules, which provides
insufficient resolution of underlying biology (Supplemental Figs
3 and 4). In contrast, the Sigmoid function at higherμthresholds
effectively reduced edge number (Fig. 1b, c, and Supplemental
Figs 3 and 4) but did so at the expense of generating large numbers of very small modules with less than 5 gene members per module, as well as a progressive increase in the percentage of orphan genes unconnected to the network. The median sum SCES
increased for the Sigmoid function at higherμlevels yet remained
below that of the EPG3 network, with the latter also retaining 100% gene connectivity as compared to 32/61% for the highest
Sigmoidμin BRCA/CRC respectively. We therefore conclude that
the combination of EPG3 matrices clustered with FastUnfold provides added value, and refer to this combination as Parsimonious Gene Correlation Network Analysis (PGCNA).
In order to provide a further assessment of the potential value of this approach we tested its relative performance against the WGCNA package as a whole, which has been shown to provide a
very effective tool for clustering diverse data types,15 and was
used for comparison for this reason. Since WGCNA is primarily 2
1234567
intended for analyzing single sets of expression data and has not
been specifically designed to handle a correlation matrix of the
type generated by merging multiple data-sets as applied here, we
again performed this comparative analysis using single
representative expression data-sets. WGCNA uses the concept of scale-free networks to aid parameter selection. As noted above, PGCNA generated scale-free topologies across all EPG thresholds tested (Supplemental Fig. 2d). Comparing gene ontology and
Edge Method Median ModuleNum Median FiltModNum Edge Number Median Sum SCES Median Module SCES % ConnectedGenes
EPG3 31 30 46,776 6754 177 100
Sigmoid0.1 3 3 141,229,221 705 261 100
Sigmoid0.5 7 6 20,928,302 1948 275 100
Sigmoid0.9 280.5 38 189,401 5044 113 32
EPG3 Sigmoid0.1 Sigmoid0.5 Sigmoid0.9
1 10 100 1000 10000 1 10 100 1000 10000 1 10 100 1000 10000 1 10 100 1000 10000 1e−01
1e+00 1e+01 1e+02 1e+03
Module Size
Module SCES
Edge Method Median ModuleNum Median FiltModNum Edge Number Median Sum SCES Median Module SCES % ConnectedGenes
EPG3 39 35 45,726 8440 188 100
Sigmoid0.1 3.5 4 141,229,221 593 170 100
Sigmoid0.5 10 10 46,170,298 2642 186 100
Sigmoid0.9 263 33 298,088 4728 119 61
EPG3 Sigmoid0.1 Sigmoid0.5 Sigmoid0.9
1 10 100 1000 10000 1 10 100 1000 10000 1 10 100 1000 10000 1 10 100 1000 10000 1e−01
1e+00 1e+01 1e+02 1e+03
Module Size
Module SCES
c
a
Gene Signature EnrichmentEPG Level
Scaled cluster enrichment score
BRCA
HC−WardD HC−WardD2 k−means_41 k−means_42 k−means_43 FastUnfold
Scaled cluster enrichment score
CRC
EPG Level
HC−WardD HC−WardD2 k−means_41 k−means_42 k−means_43 FastUnfold
b
Fig. 1 Radical edge reduction enhances the resolution of biology in gene co-expression modules. aEnrichment of gene ontology and signatures was assessed using a scaled cluster enrichment score (SCES) and compared between data clustering generated with FastUnfold, Hierarchical clustering or k-means clustering using either the total correlation data (All) or parsimonious matrices with edges per gene (EPG)
thresholds between 3 and 10. Violin plots display the distribution along with median (blue square) and the IQR.b,cdensity plots of the
module size (gene-number;x-axis) vs module SCES (Scaled Cluster Enrichment Score; see methods;y-axis) across the 100 best clustering for
EPG3 (Edge Per Gene 3) or the WGCNA sigmoid adjacency function varying the shift (μ, 0.1, 0.5 and 0.9).bBRCA data andcCRC data. Beneath
the graph the results are displayed in tabular form, showing the median module number, median modular number with gene membership
>5, edge number retained afterfiltering (edges <0.01 removed), median sum of module SCES, median module SCES, and the percentage of
connected genes (afterfiltering; edges <0.01 removed)
[image:3.595.50.535.66.326.2]signature enrichment using the SCES, indicated a greater enrichment for the PGCNA solutions relative to WGCNA (Supple-mental Fig. 5). Considering the stability of module gene member-ship across soft threshold levels employed in WGCNA and EPG levels in PGCNA, the PGCNA method demonstrated a higher
degree of stability for gene membership (Supplemental Figs 6–9).
Of note, in performing the technical comparison of the clustering approaches the EPG/FastUnfold combination (PGCNA) was also
highly efficient in terms of computational time and memory usage
(Supplemental Methods). Thus the combination of parsimonious edge reduction and FastUnfold analysis in addition to providing enhanced resolution of biology between network modules, can
provide benefits in terms of computational efficiency.
Biology of network modules and mapping to expression-based
cancer classifications
The above analysis established that PGCNA provided an effective tool for analysis of gene co-expression providing advantages relative to pre-existing methods; producing tractable networks that allow contextualization of all nodes and edges used in network generation and that clusters these into a small number (<50) of biologically distinct modules. To further evaluate the utility of this approach the optimum PGCNA clustering based on SCES was taken forward for detailed downstream analysis for each cancer type.
Initially the networks were visualized as an interactive
web-based resource (Fig.2a, b). To enhance network utility additional
factors were overlaid providing inter-related visualizations of the
data viewed through the networks (Supplemental Fig. 10 &http://
pgcna.gets-it.net/). Indeed, one of the impacts of radical edge reduction is the generation of sparser and visually navigable networks, in which nonetheless all genes remain connected and all edges used in network generation can be visualized. This is particularly the case when viewed as an interactive resource, which provides a context for assessing the relationships of gene co-expression, for example, in relation to genes linked to existing
expression-based cancer classification schemes.
Detection of BRCA intrinsic sub-classes has been refined into
expression-based tools such as the PAM50 classifier.4,5,8Mapping
genes linked to these intrinsic classes onto the network identifies
BRCA_M6 as the luminal module (Fig. 2a [i], Supplemental Fig.
10a–c, online). Genes associated with ERBB2 amplified breast
cancer map on to BRC_M5 (Fig.2a [ii]), epithelial genes defining
basal breast cancer overlap with those linked to normal-like breast
cancers and map onto module BRCA_M14 (Fig. 2a [iii]). While
genes linked to cell proliferation which provide a shared feature of Luminal B and Basal type breast cancers map onto BRCA_M7 (Fig.
2a [iv]). An example here of the networks providing context for
patterns of gene expression is the close linkage within the network between BRCA_M14 and BRCA_M7, which together
encompass genes that define basal type breast in the PAM50
classification.
The CRC consensus molecular subtype classification recognizes
four subtypes6: CMS2 containing genes linked to canonical
enterocyte-like differentiation maps onto module CRC_M3 (Fig.
2b [i]); CMS3 reflects goblet-cell and metabolic differentiation and
maps onto CRC_M7 (Fig. 2b [ii]); CMS1 identifies microsatellite
unstable cancers through interferon response genes and maps
onto CRC_M32 (Fig.2b [iii]); and CMS4 encompassing
mesench-ymal dominant CRC maps onto CRC_M8 (Fig. 2b [iv])
(Supple-mental Fig. 10d–f, online). Again, in this network the context of
gene expression relationships between enterocyte and goblet cell differentiation is illustrated by the proximity of these modules in the network, and their distinct separation from the mesenchymal module. Therefore, the PGCNA networks successfully place current
paradigms of expression-based classification in BRCA and CRC in
the context of wider expression patterns for each cancer. Assessment of network clustering success was based on the enrichment and segregation of gene signatures between the resulting modules. These enrichments (Supplemental Table 3 (BRCA) & 4 (CRC)) were summarized to illustrate the most
significantly enriched ontology and signature terms between
modules using heatmaps. The purity of segregated biology was
reflected in the separation of enriched signatures between
individual modules (Fig. 3a, b & Supplemental Fig. 11a, b). A
summary designation was assigned to each module based on a selectively enriched term.
We next tested whether recurrent features of cancer biology
could be identified in the comparison of modules between the
cancer types. Pairwise comparison demonstrated a high degree of
similarity at the level of module gene membership (Fig. 3c,
Supplemental Fig. 11c). In this gene level comparison, the majority of modules viewed from either cancer perspective had one
primary corresponding module, as assessed by the maximal z
-score for overlap of gene membership, and the majority of modules overall had at least one module with very highly
significant overlap. Where a module in one cancer type such as
CRC_M17 had multiple highly significantly corresponding
mod-ules in BRCA (BRCA_M3, M16, M28, M39, M37), the BRCA modmod-ules
BRCA
a
CRC
b
i
ii
iii
iv
i
ii
iii
iv
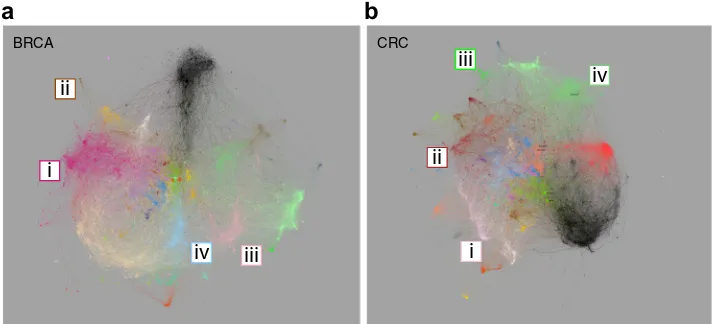
Fig. 2 Network visualization for BRCA and CRC.aBRCA network with modules color-coded, modules overlapping significantly with those in
CRC share a common color. Modules corresponding to intrinsic BRCA classification (i) luminal (BRCA_M6), (ii) ERBB2/HER2 (BRCA_M5), (iii)
basal/normal (BRCA_M14) and (iv) cell cycle (BRCA_M7).bCRC network, highlighted modules correspond to consensus molecular subtypes of
CRC (i) CMS2-enterocyte (CRC_M3), (ii) CMS3-metabolic/goblet (CRC_M7), (iii) CMS1-hypermutated (CRC_M32) and (iv) CMS4-mesenchymal
(CRC_M8). Fully annotated versions in Supplemental Fig. 10, andhttp://pgcna.gets-it.net/
[image:4.595.124.482.60.222.2]a
c
-7 0 15
Z-Score
BRCA
M19 M8 M9 M14 M31 M18 M20 M29 M34 M2 M12 M16 M17 M1 M40 M10 M3 M37 M6 M42 M21 M30 M7 M15 M23 M22 M33 M38 M28 M39 M4 M32 M24 M41 M13 M5 M11 M26 M27 M25 M35 M36
Gene Sig
n
atur
es
CRC
M2 M24 M13 M5 M9 M12 M15 M4 M20 M17 M18 M10 M27 M33 M6 M35 M19 M28 M16 M29 M36 M3 M7 M25 M11 M1 M14 M22 M31 M37 M23 M34 M21 M8 M26 M30 M32
Gene Sig
n
atur
es
Module Signature Overlap
M4 M8 M26 M30 M3 M7 M2 M15 M18 M5 M27 M20 M19 M17 M6 M33 M23 M10 M13 M28 M16 M9 M25 M37 M24 M29 M36 M21 M32 M34 M35 M12 M1 M14 M11 M22 M31
Module Class
Max -Log10
BRCA
CRC
Module Gene Overlap
M4 M8 M26 M30 M3 M7 M2 M15 M18 M5 M27 M20 M19 M17 M6 M33 M23 M10 M13 M28 M16 M9 M25 M37 M24 M29 M36 M21 M32 M34 M35 M12 M1 M14 M11 M22 M31
Module Class
BRCA
CRC
Max -Log10
-Log p-value
Unassigned Structural Gene Battery Functional Gene Battery
Chromosome Region Cell of origin
Cancer Hallmark
Module Class
10 15 20 25 30 35 40 45 50 3
d
b
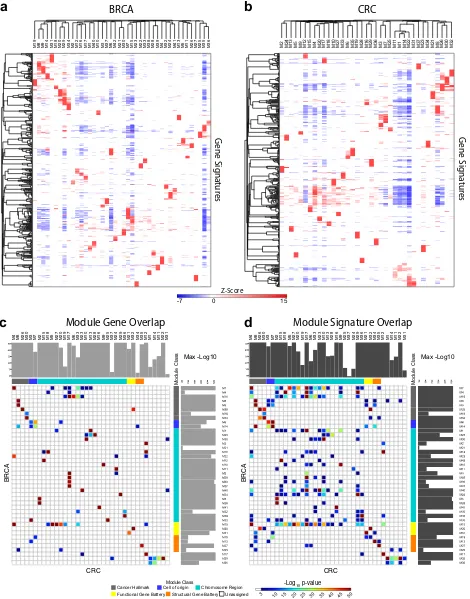
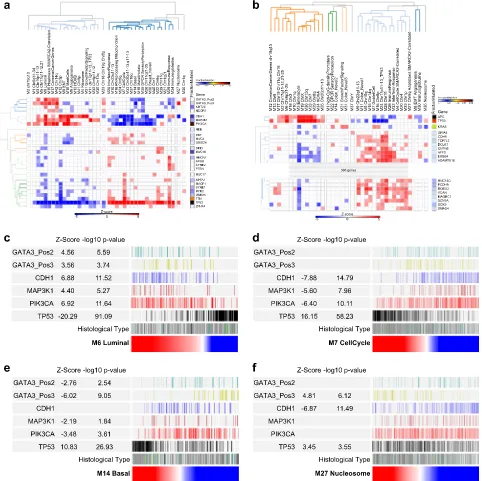
Fig. 3 Module biology and between cancer analysis identifies principles of gene co-expression. Heatmaps of gene signature enrichment
between modulesaBRCA,bCRC. Significant enrichment or depletion illustrated on red/blue scale,x-axis (modules) andy-axis (signatures).
Hierarchical clustering according to gene signature enrichment (using top 15 signatures per module; FDR <0.05). Scalable version in
Supplemental Fig. 11a, b.c,dModule relationship between cancers analyzed using hypergeometric test displayed as pairwise comparison
matrix. Significance of overlap displayed asp-values on indicated color scale (p-values <0.001); overlap bycmodule gene membership,d
enriched gene signatures. Gray side bars illustrate maximal significance for module match. Module class Cancer-Hallmark: gray, Cell-of-origin:
blue, Chromosome-Region: cyan, Functional-Gene-Battery: yellow, Structural-Gene-Battery: orange and Unassigned: white (Scalable version in Supplemental Fig. 11c, d)
[image:5.595.60.530.60.659.2]reciprocally had the CRC module, in this case CRC_M17, as their primary corresponding module. Thus, the modules in the alternate
cancer types in some instance reflected a separation into more
refined structure. By contrast very few modules generated in
either cancer type lacked a significant corresponding module.
Given that the network modules are derived in an agnostic fashion from multiple data-sets of entirely disparate cancer types, the level of overlap in gene membership generated by this approach is notable. This supports the argument that these modules of gene expression identify recurrent and stable clusters of gene co-expression.
We next extended the analysis to consider the overlap of biology associated with network modules comparing the enrich-ment of ontologies and signatures associated with each module irrespective of the genes driving that enrichment. This generated a similar but more diverse pattern than that seen at gene level
(Fig.3d, Supplemental Fig. 11d). While most modules retained one
or two primary corresponding modules in the alternate cancer type, overall the extent of overlap between modules was both
more dispersed and more diverse. The result in part reflects the
diversity of gene members in many ontology and signature terms, but additionally points to the fact that while the network modules
derived from CRC and BRCA share highly significant core gene
membership, they at the same time reflect a greater diversity
between the cancer types in terms of the precise patterns of co-expression of genes related to cell function and differentiation.
Considering cancer hallmarks, recurrent modules could be
identified relating to pathways linked to cell cycle, immune
response, EMT/stroma and angiogenesis. Additional recurrent modules were linked to co-regulated gene batteries such as the IFN-response or growth factor signaling pathways, or structural gene clusters such as Histone, HOX and immunoglobulin genes. Moreover, these modules exhibited shared enrichments for signatures of transcription factor motifs linked to gene promoters
(Supplemental Table 5).21 In BRCA the impact of chromosomal
copy number variation on gene expression in cis has been
extensively analyzed.22Such patterns of gene co-expression were
recovered in the networks and proved highly reproducible between BRCA and CRC, with the majority of BRCA modules
linked to specific chromosomal region having a direct counterpart
in CRC (Fig.3c, d, Supplemental Fig. 11c, d).
Hence, the comparison between cancer types identified
principle determinants of gene co-expression patterns. These
reflect the impact of cancer hallmarks, functional and structural
gene batteries, and copy number variation, which are overlaid on
modules linked to the specific biology of the originating cell type.
Module neighborhoods link to epithelial differentiation pathways Within the individual modules, the network sub-structure
identi-fies genes with the highest degrees of correlation. To resolve
whether these patterns linked to discrete cell states we re-ran the clustering and signature enrichment analysis for module genes
independently. We defined the resulting sub-structure as module
neighborhoods (Fig.4, Supplemental Fig. 12, Supplemental Table
6 & online), which illustrates another valuable feature of PGCNA, the scalable nature of the approach.
In CRC features of epithelial differentiation are encompassed in CRC_M3 (enterocyte) and CRC_M7 (goblet cell). The enterocyte module encompassed neighborhoods enriched for genes linked to the WNT-signaling pathway (neighborhood 9, CRC_M3.n9),
includingLGR5,23through to neighborhood CRC_M3.n1 enriched
for genes characteristic of the mature enterocyte state (CA1, CA4,
CD177, MS4A12 and SLC26A3), recapitulating co-expression
observed in single cell analysis of colonic epithelium (Fig. 4a,
Supplemental Fig. 12a),24and again illustrating how the
applica-tion of the network can provide context in complex gene co-expression data. The goblet cell module divides into 11
neighborhoods of which 5 could be assigned to known ontology associations, for example CRC_M7.n10 linked to glycolysis and glucose metabolism and CRC_M7.n11 linked to defense responses
(Fig. 4b, Supplemental Fig. 12b). Neighborhood CRC_M7.n8,
lacking enrichment of established ontology terms, included the
hub genesFCGBP andST6GALNAC1as well asSPINK4andMUC2,
that are characteristic goblet cell markers linked to CMS3 CRC.6,24
The closely linked neighborhood CRC_M7.n1 included hub genes
REG4,AGR2andAGR3(Fig.4b, online). Notably, REG4 has recently
identified as a marker of deep crypt secretory cells.25Using the
resolution of the superficial enterocyte cluster in CRC_M3.n1 as
reference, this might suggest that genes linked to REG4 in CRC_M7.n1 identify a deep crypt secretory cell program, as opposed to the more generic goblet cell markers in neighborhood CRC_M7.n8.
In BRCA the luminal module (BRCA_M6) divides into nine neighborhoods. Of these BRCA_M6.n8 is enriched for core ESR1
target genes and encompassesGATA3andESR1as hub nodes (Fig.
4d, Supplemental Figure 12c, Supplemental Table 6, online).26,27
Genes that contribute to a basal-like classification and to epithelial
biology fall in BRCA_M14. BRCA_M14.n8 includes the hub gene
SFRP1as well asEGFRandFOXC1, PAM50 classifier genes used to
define basal breast cancer (Fig. 4c, Supplemental Figure 12d,
Supplemental Table 6, online). A subset of basal breast cancer
classifier genes are connected to the cytokeratin gene KRT17 in
BRCA_M14.n7 encompassing genes associated with epithelial and epidermal differentiation and linked to normal-like breast cancer
classification (Fig.4c, Supplemental Table 6). Thus, the structure of
gene neighborhoods in the epithelial modules reflects patterns of
gene expression observed in differentiation, in both CRC and BRCA.
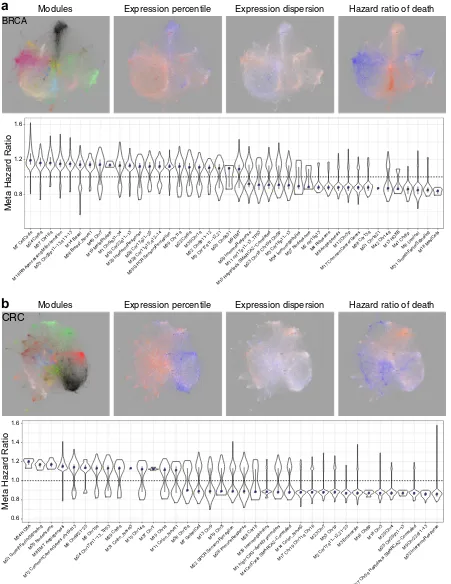
Networks as multi-layered tools to explore survival associations To provide resources that explore associations of expression with survival, we overlaid meta-information including association of
gene expression with hazard ratio (HR) of death (Fig. 5,
Supplemental Fig. 13, online). The integration of multiple data sources retained the ability to detect robust HR associations. In the BRCA network, considered without histological subdivision, this recovered the separation of good and adverse outcome between luminal (BRCA_M6) and basal type (BRCA_M14) gene expression
(Fig. 5a, Supplemental Fig. 13a). At a module level cell cycle
(BRCA_M7) showed the strongest adverse outcome association,
which was also evident for modules linked to amplified
chromosomal regions that cluster with the cell cycle module (such as BRCA_M24 & M37). Heterogeneity in HR association of module genes, as shown by spread in the violin plot across the neutral line, is a particular feature of the stem cell/EMT (BRCA_M9) and immune response modules (BRCA_M29).
In CRC, the enterocyte (CRC_M3) and interferon response modules (CRC_M32) were linked to good outcome, while adverse outcome associations centered on the EMT/angiogenesis module
(CRC_M8) and modules linked to specific chromosomal regions
(Fig.5b, Supplemental Fig. 13b). The three modules with strongest
adverse outcome association were HOXA (CRC_M34), growth factor signaling (CRC_M21) (Supplemental Fig. 13c) and nucleo-some (CRC_M35). In CRC the immune response module (CRC_M26) also showed a heterogenous pattern, distinct from the near homogenous good outcome association of the IFN module. Thus, mapping of meta-hazard ratios both rediscovers outcome associations linked to the primary modules that map
onto existing molecular classification and points to less well
regulated by one of the most important pathways in this cancer type.
Network modules provide a platform for molecular stratification
Having validated PGCNA as a tool to interrogate the integrated training data-sets, we next tested the modules as a platform to
explore TCGA data.7,28To do this we wished to generate values
that would summarize the expression level of a given network module, which could be applied across the entire data-set and on a case by case basis. We used the 25 most representative genes (nodes) of each module to generate module expression values (MEV). The genes contributing to these MEVs were selected from the genes with the highest network connectivity, which provided an indicator of the extent to which a gene was correlated and thus representative of other genes in the network, and focused on genes that are variant across patients, thus most likely to discriminate between patient subsets, but invariant across data-sets, thus least likely to be affected by biases within data-sets.
Using these MEVs wefirst tested the pattern of module expression
in the TCGA RNA-seq data by hierarchical clustering at data-set level. In both BRCA and CRC the overall pattern of module co-expression in RNA-seq data was closely related to that in array derived training data-sets (Supplemental Fig. 14). This supported
the use of MEVs as a platform to summarize network level gene expression in the TCGA data.
Next applying the MEVs at case/sample level in hierarchical clustering segregated BRCA, initially without considering histolo-gical type, into branches according to expression of basal, luminal and mesenchymal related modules. In the latter this distinguished subsets of mesenchymal from mixed mesenchymal/angiogenic BRCA, with the latter including the majority of lobular breast cancers (Supplemental Fig. 15a). Within these major branches further heterogeneity was evident across other network modules, sub-dividing the primary branches according to wider patterns of modular gene expression. Such subdivision was also evident
within cases first divided by histological type and then by
hierarchical clustering of MEVs (Supplemental Fig. 16a). This for example illustrated a distinctive pattern of MEV expression in mucinous carcinomas with strong luminal and nucleosomal gene expression in the absence of cell cycle, EMT, angiogenesis or immune response signals.
Extending this approach to CRC the clustering divided into
three main branches (Supplemental Fig. 15b). The first was
characterized by low cell cycle and related chromosomal regional module expression, accompanied by mixed immune and EMT/ angiogenesis module expression and subdivision into enterocyte and goblet cell branches; the second enriched for highly mutated cases was characterized by expression of the goblet cell and cell
BRCA M6
d
n8
b
CRC M7 n1
n8
CRC M3
a
n1
n9
BRCA M14
c
n7 n8
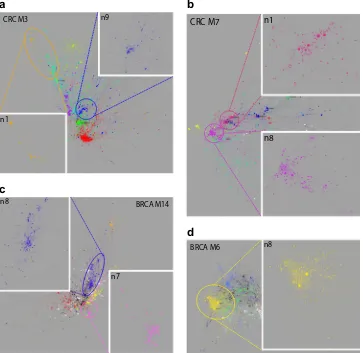
Fig. 4 Module neighborhoods providefine-grained resolution. Neighborhoods within modules are displayed by color code, interactive
version online.aCRC_M3, enterocyte module, expanded: CRC_M3.n9, WNT-signaling (blue), and CRC_M3.n1, superficial enterocyte (orange).b
CRC_M7, goblet metabolic module, expanded: CRC_M7.n8, classical goblet cell and CMS3 genes (purple), and CRC_M7.n1 putative deep
secretory cell neighborhood (dark pink).cBRCA_M14, basal/normal module, expanded: BRCA_M14.n8 (blue), basal classifier genes, and
BRCA_M14.n7 (pink), epithelial/epidermal differentiation. d BRCA_M6, luminal module, expanded: BRCA_M6.n8, GATA3 and ESR1
neighborhood (yellow). Related GSE results in Supplemental Fig. 12
[image:7.595.113.476.61.414.2]BRCA
Expression percentile Expression dispersion Hazard ratio of death
Modules
0.8 1.2 1.6
M1 Chr9q31−34
M2 chr19q13 M3 Chr16p11−13
M4 Ribosome M5 Chr17q11−12,21
M6 Luminal M7 CellCycle
M8 Angiogenesis M9 EMT
M10 Chr22q11−13
M11 chr17p11−13_TP53
M12 Chr3p M13 H OXB M14 Basal
M15 Haptotaxis SMARCA2−Correlated M16 RNAprocessing Mitochond
rion
M17 CommonCancerGenes
M18 MastCells M19 Metalthiolate
M20 Inter
feronResponse M21 Chr1q21
M22 Chr6q
M23 Chr18 Chr19p Chr5p M24 Chr8q
M25 Chr5q31
M26 Chr17q21−25 M27 Nucleosome M28 Chr11p15,q12−14 M29 Im
muneResponse M30 Chr1q
M31 Gr owthF
actorSignaling M32 Chr8p11−12
M33 Chr20p11−13,q11−13
M34 Imm unoglo
bulins
M35 GPCR Senso ryP
erception
M36 Breast_N ovel1
M37 Chr16q M40 Chr7 M39 Chr11q M38 Chr13qM42 Chr14q M41 Chr8p
Meta Hazard Ratio
a
b
0.6 0.8 1.0 1.2 1.4 1.6
M1 high−CpG−density promoters
M2 Chr17q11−12,21−25 M3 Enterocyte
M4 CellCycle SMARCA2−Correlated M5 Chr15q
M6 Chr6p21−25 M7 Gob letCell
M8 EMT Angiogenesis
M9 Chr22q11−13 M10 Chr1q
M11 Colon_No vel1
M12 CommonCancerGenes chr19q13
M13 Chr9
M14 Colon_N ovel2
M15 Chr14q M16 Chr8p
M17 Chr19 Chr11q Chr16
M18 Chr3
M19 ChrX M20 Chr4
M21 Gr owth
FactorSignaling
M22 GPCR Senso
ryPerception M23 Chr7
M24 Chr17p11−13_TP53
M25 Chr20p11−13 M26 Im
muneResponse
M27 Chr5q Haptotaxis SMARCA2−Correlated M28 Chr18
M29 Chr8q
M30 Im munoglob
ulins
M31 Colon_No vel3
M32 Inter feronResponse M33 Chr1p
M34 HO XA
M35 Nucleosome
M36 Chr13q M37 ChrY
Meta Hazard Ratio
CRC
Expression percentile Expression dispersion Hazard ratio of death
Modules
Fig. 5 Networks as multilayered tools to explore survival association. BRCA (a) and CRC (b) meta-information overlay. Left to right: module
color code, median expression percentile (relative intensity of expression) across data-sets, median expression dispersion (Quartile coefficient
of dispersion, variation between samples/patients) within data-sets, and association of gene expression with meta-analysis Hazard Ratio (HR)
of death. Color scales: expression dispersion and variance blue (least) to red (most); outcome blue (low HR—good outcome) to red (high HR—
poor outcome). Lower panels ranked module level association with meta HR of death. Distribution of HR associations for module genes with
HRp-value <0.05, along with median (blue square) and IQR
[image:8.595.79.530.61.645.2]cycle and related modules; the third branch was characterized primarily by high enterocyte module expression. This corresponds broadly to the primary features of the consensus molecular subtypes. However, the expression patterns of the extended network modules illustrated how heterogeneity within these primary branches could be mapped using MEVs to summarize other characteristics of the CRC coexpression network. Such heterogeneity was also evident after separation by mutational load, notably extending to the highly mutated tumor group to
identify a subset relatively deficient in immune and EMT/
angiogenesis module expression (Supplemental Fig. 16b). Further-more, differential association of left and right sided tumors with distinct patterns of gene expression was supported by the modular analysis with right sided origin linked to goblet module expression amongst both hypermutated and non-hypermutated subsets, and left sided origin linked to enterocyte module expression irrespective of associated EMT or immune module expression (Supplemental Fig. 16b).
Thus, while the clustering of BRCA and CRC samples based on MEVs reinforces the validity of key features that drive existing
paradigms of classifications, the analyses also illustrates that
considerable biological heterogeneity is present within such clusters. As a potential solution to assess this heterogeneity the derivation of the PGCNA network and the application of the resulting MEVs can provide a method for summarizing the overall expression state of a cancer sample taking into account key representative genes from across a full network of gene coexpression.
Data-led network modules have distinctive mutational associations
To integrate module expression with gene mutation we first
considered BRCA as a single entity. The MEVs provided a summary of module level gene expression across the network which we correlated across the data-set with the presence or absence of mutations in the TCGA data. For BCRA as a whole this
demonstrated a primary division of enrichment or
anti-enrichment ofTP53versusCDH1,PIK3CA,GATA3,MAP3K1,KMT2C
andNCOR1mutation (Fig.6a).TP53mutation positively correlated with the cell cycle and basal modules, and some chromosomal regional modules. In addition to the cell cycle module the immune response and IFN modules were distinguished by additional positive association with diverse mutational targets. The luminal,
EMT, angiogenesis and related modules were significantly
anti-correlated with TP53 mutation and positively associated with
combinations of mutations in CDH1, PIK3CA, GATA3, MAP3K1,
KMT2CandNCOR1.
GATA3 mutations can be subdivided between DNA-binding domain or carboxy-terminus, with the latter including frameshift mutations. The potential value of MEVs as a tool for assessing selective patterns of association between gene expression and
mutation is illustrated by the observation that GATA3mutations
affecting the carboxy-terminus are selectively associated with nucleosome module expression. Extending the analysis to BRCA after division by histological subtype, the general pattern observed in all BRCA irrespective of histological type was evident when considering ductal BRCA in isolation (Supplemental Fig.
17a). Lobular BRCA is more molecularly homogenous, reflected in
a sparse correlation pattern, nonetheless also retaining features observed in BRCA as a whole (Supplemental Fig. 17b).
For CRC, the pattern was impacted by the high overall mutation
load (Fig.6b, Supplemental Fig. 17c). Associations divided around
modules linked with bothTP53andAPCmutation and those that
correlated with a high mutation load across a wide range of target
genes and that were neutral or anti-correlated withTP53andAPC
mutation. This separated the enterocyte module, linked to TP53
and APC mutation, and the goblet cell module linked to high
mutation load and KRAS mutation, with KRAS mutation also
correlating with the growth factor signaling module. In CRC the
cell cycle module was not positively correlated with TP53
mutation, but instead was linked to the broad swathe of highly mutated target genes. The modules most strongly linked to
mutation load encompassed genes from the vicinity of theTP53
on chr17p, chr18 and components of the immune response and IFN signaling. Overall this reinforces the division of CRC into the
major molecular pathways of TP53 and APC mutation versus
hypermutational genomic instability and supports the broadly different patterns of molecular features linked to patterns of goblet cell or enterocyte module expression in CRC.
From the point of view of MEVs as a tool for summarizing gene expression across the wider network representative of CRC and BRCA, the pattern of associations observed in the TCGA data supports the validity of this approach. While identifying novel associations, which to our knowledge have not been previously reported such as the linkage between nucleosome gene expres-sion and GATA3 mutation type in BRCA, the analysis recovers many associations that are coherent with known tumor biology.
Tumor stereotypes with mutation patterns linked to module expression intensity
Next, we addressed the relationship between mutational profile
and module expression intensity. A notable feature of this analysis
particularly evident for BRCA is the statistically significant
association between the intensity of MEV expression and key mutations. Thus, luminal MEV intensity showed a strong positive
correlation withCDH1,MAP3K1,GATA3andPIK3CAmutations and
profound anti-correlation with TP53mutation (Fig. 6c). This was
paralleled by the opposite association of cell cycle (Fig.6d) and
basal (Fig.6e) MEV intensity with these mutations. In this context
when used as a ranking variable the selective positive correlation
of the nucleosome module with GATA3 3′-mutations, and
anti-correlation withCDH1mutation status, was emphasized (Fig.6f).
As part of this specific association, both nucleosome module
expression and GATA33′ mutations were enriched in mucinous
BRCA (p-value 0.0004). Thus, the use of MEVs as ranking variables
illustrates the principle that extremes of module expression associate with increasingly stereotyped tumors and more dis-tinctive patterns of associated mutations, particularly for modules
linked to existing expression-based classifications. The potential
co-variance of mutation detection and characteristic gene expression points both to stereotypical extremes and centrist cases that concurrently exhibiting less characteristic expression
and mutation profiles.
Selective association of immune neighborhoods with mutational
profile in BRCA
The interaction between host immune response and molecular subtypes in cancer is of considerable interest. A notable feature of the BRCA analysis was an apparent association of mutational pattern with a module comprised of genes characteristic of mast
cells (Fig.6a and Supplemental Fig. 17a, b). While an association of
mast cell infiltration with histological subtypes have been
previously described,29,30to our knowledge the selective
associa-tion of this immune cell subset with underlying mutaassocia-tional state has not been previously noted. Indeed, the discrete association of
this cell type specific module appears significantly different from
the patterns observed for the wider immune response module in
BRCA. To further test the apparent specificity of the mast cell
module, we reasoned that the mutational association should remain distinctive when considering the cancer immune response at a network neighborhood level. Focusing on BRCA we therefore integrated network modules linked to immune response features (M18, M20, M29 & M34) and performed a neighborhood analysis.
The resulting immune neighborhood network defined 14
modules/neighborhoods of immune response and associated
gene expression (Fig.7a). To test dominant lineage associations in
these modules we examined the relative enrichment of gene signatures used in the bioinformatic immune deconvolution
approaches, Cibersort and Immunoscore31,32 (Supplemental Fig.
18a). This demonstrated the segregation of neighborhoods representing core T-lineage and cytotoxic cell types (Immune_n1), monocytes, macrophage and neutrophils (Immune_n2), M1 macrophages and activated DCs which overlaps with IFN-response linked to MHC class I dependent antigen presentation
(Immune_n3), M0 macrophages (Immune_n7), plasma cells and B-cells (Immune_n8), and mast B-cells (Immune_n10). Thus, this
neighborhood analysis identified components of cell lineage
specific gene signatures, associated with Cibersort and
Immuno-score, that are sufficiently correlated to emerge as distinct
modules in BCRA expression data. The remaining network elements add to these lineage-associated neighborhoods to identify coregulated functional gene batteries (Supplemental Fig. 18b). These include the IFN-response, which is sub-divided into a module linked to MHC class-I antigen presentation (Immune_n3) Fig. 6 Network modules show distinctive patterns of mutational association. Correlations of MEV with mutation status of commonly mutated
genes in TCGA data (a) BRCA & (b) CRC. Significance of Spearman’s Rank correlation of MEV with mutation,z-score on blue to red scale;
fraction of mutated cases per gene, blue to black color scale. Hierarchical clustering for genes mutated in≥5% BRCA and≥10% CRC of TCGA
samples. For CRC the heatmap is truncated for display purposes (complete version Supplemental Fig. 17c).cBRCA_M6 Luminal,dBRCA_M7
cell cycle,eBRCA_M14 basal andfBRCA_M27 nucleosome, MEVs as ranking variables (red to blue color scale) for mutation distribution,z
-score and−log10p-value forGATA3with division into proximal (pos2; N-terminus) and distal (pos3; C-terminus),CDH1,MAP3K1,PIK3CAand
TP53. Histological: ductal (gray), lobular (white) lobular/ductal (dark blue), medullary (green), metaplastic (dark green), mucinous (black), not
reported (light blue)
[image:10.595.63.545.59.540.2]which is IFNγresponse biased and overlapping with signatures of M1 macrophages and activated DCs, and other classical
IFN-response genes, which are more IFNα response biased
(Immu-ne_n11). Other neighborhoods linked to gene batteries are those linked to MHC class-II genes (Immune_n13), a cluster of
glutathione-μgenes (Immune_n14), and a neighborhood enriched
for components of signal transduction pathways and cytoskeletal
reorganization (Immune_n9). Interrogating these immune
neighborhoods further illustrated the selective association of immune gene expression with associated mutations, either
considering BRCA as a whole or refined to consider ductal
carcinoma in isolation (Fig.7b). Indeed, this analysis confirmed the
selective association of mast cell related gene expression
Immune_n10 with CDH1,PIK3CA and MAP3K1 mutations across
BRCA (total data). While the association between mast cell gene
expression andCDH1mutation was as expected linked to lobular
d
TotalCDH1
MAP3K1
PIK3CA
TP53
Z-Score
-3.08
-2.93
13.21
n7
-log10 p-value
2.98
2.77
39.44
n7
CDH1
MAP3K1
PIK3CA
TP53
Z-Score
-3.20
12.22
n7
-log10 p-value
3.16
33.89
Ductal
e
n10
CDH1
MAP3K1
PIK3CA
TP53
Z-Score
7.86
5.18
6.19
-10.12
-log10 p-value
14.72
6.95
9.53
23.65
Total
n10
CDH1
MAP3K1
PIK3CA
TP53
Z-Score
5.56
5.60
-9.12
-log10 p-value
7.87
7.98
19.44
Ductal
a
b
FractionMutated
Z-score
-5 0 5
n5 n1 n3 n7 n2 n4 n9 n13 n6 n8 n12 n11 n10 n14
Ductal
n2 n3 n7 n11 n1 n4 n9 n13 n8 n5 n12 n6 n10 n14
Total
0.8 1.0 1.2
n1
n2 n5 n3 n4 n6
n7 n11 n12 n8 n9 n13 n10 n14
Neighbourhood
Meta Hazard Ratio
c
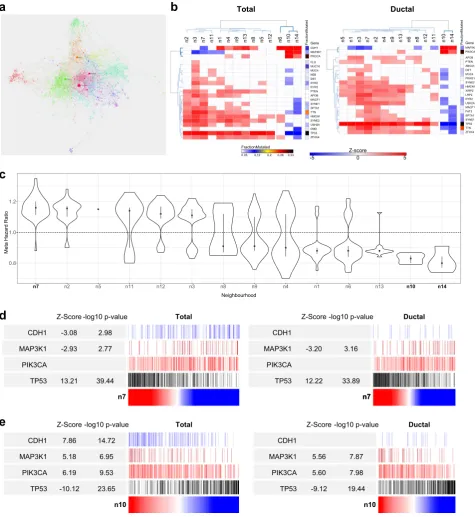
Fig. 7 Immune neighborhood analysis.aImmune neighborhood analysis for BRCA (across BRCA M18, M20, M29 & M34) displayed as network
summary.bSignificance of Spearman’s Rank correlation of MEV with mutation across immune neighborhoods for all BRCA left and ductal
BRCA right;z-score on blue to red scale; fraction of mutated cases per gene, blue to black color scale. Hierarchical clustering for genes
mutated in≥5% BRCA of TCGA samples.cRanked neighborhood level association with meta Hazard Ratio (HR) of death. Distribution of HR
associations for module genes with HR p-value <0.05, along with median (blue square) and IQR. d,e Use of immune neighborhoods
Immune_n7 (d) and Immune_n10 (e) MEVs as ranking variables (red to blue color scale) for mutation distribution,z-score and−log10p-value
forCDH1,MAP3K1,PIK3CAandTP53: all BRCA left, ductal BRCA right
[image:11.595.54.530.59.577.2]breast cancer, PIK3CA and MAP3K1 mutations were selectively associated with mast cell gene expression when considering only ductal carcinoma. Within this subset mast cell gene expression
was significantly anti-correlated withTP53mutation. This pattern
of associations was shared only with the small set of glutathione-μ
genes encompassed in Immune_n14. Other immune gene
neighborhoods generally showed positive correlations withTP53
mutation, and in the case of neighborhoods linked to monocytes and macrophages (n3, n7) as well as MHC class-I dependent antigen presentation (n3), additionally showed anti-correlation withMAP3K1mutation state.
Consistent with these mutational and histological associations
mast cell and glutathioneμgene expression provided predictors
of good outcome in meta-hazard ratio analysis, while adverse outcome was linked to monocyte and macrophage associated
modules (Fig.7c). Finally using mast cell, and macrophage related
neighborhood modules as ranking variables emphasized the trend toward stereotyped associations of expression and mutation
particularly forTP53andMAP3K1(Fig.7d, e). With the intensity of
the macrophage related neighborhood Immune_n7 positively
correlated with TP53and anti-correlated withMAP3K1, while the
intensity of mast cell related gene expression encompassed in
Immune_n10 was strongly positively correlated withMAP3K1and
PIK3CA and anti-correlated withTP53. Thus, this analysis confirms
the selective pattern of association that mast cell related gene expression shows with underlying mutational state in BRCA relative to other immune cell type related gene expression
profiles. Furthermore, the analysis illustrates how neighborhood
analysis using PGCNA can be used to home into consistent patterns of immune gene expression in cancer tissue in a fashion
that complements approaches based on pre-defined immune
subset signatures derived from purified cell subsets.
DISCUSSION
We set out to test whether the modular nature of gene co-expression could be used to derive co-expression codes summarizing diverse features of cancer biology, and whether this could be generated from a network level view of gene co-expression using BRCA and CRC as exemplars. These two common cancers were
selected as representative of well-defined pre-existing molecular
classifications and extensive expression resources. Amongst the
features we considered desirable to achieve, were that the networks should generate a structure that contextualizes patterns of gene co-expression across all genes used in module generation, and that the resolved modules of genes should identify mean-ingful biology within and between cancer types. Furthermore, we reasoned that by using an unsupervised approach we would be able to test the recovery of pre-existing paradigms, and that the resulting modules should provide the potential basis for summarizing gene expression across the network in individual samples.
A major challenge to achieving this aim lay in finding an
approach for edge reduction that would allow the highly complex gene co-expression data to be reduced in complexity while retaining information that allowed effective clustering. A striking
finding of the analysis was that the radical pruning of edges in
expression correlation matrices, retaining only the genes most
significantly correlated with any individual index gene, prior to
network analysis with the approach know as Fast Unfolding Communities in Large Networks (referred to in this work as
FastUnfold), allowed remarkably efficient recovery of biology. This
result was not intuitive, indeed a striking feature of the methodological development is that such edge reduction greatly enhances the performances of the FastUnfold algorithm, which
when working on the total data-set performs significantly less
well. Indeed, the EPG3 approach gave superior results to other
data filtering methods tested—iPCC, power function or the
sigmoid function of weighted gene correlation network analysis
(WGCNA)—as assessed by a combination of module number and
gene distribution, biological enrichment, and percentage of genes connected in the network. Interestingly, across the range of edge reduction thresholds tested, below ten edges per gene, the resultant parsimonious matrices yielded topologically scale-free networks. Furthermore, in comparison with WGCNA, the combina-tion of parsimonious correlacombina-tion matrices and FastUnfold pro-duced a greater consistency of module composition and a greater resolution of gene signatures and ontology terms. We note that WGCNA is widely used and a highly effective tool for analysis of expression data-sets but is not optimized to deal with correlation matrices derived from multiple merged expression data-sets. We would note in this context that PGCNA can also be used to effectively explore smaller sets of experimental data, and we have provided an example of this in a companion paper applying the method described here in experimental time course data related
to cellular differentiation.33
A further feature of the PGCNA approach is the computational
efficiency and scalable nature of the method. Firstly, this allows
effective network analysis with generally available computers without dependence on a high-performance computing cluster. Secondly the method can be scaled, both up to allow analysis of very large data-sets, and down to provide a focused analysis of subsets of genes within a wider network. The latter we refer to as a neighborhood analysis and allows resolution of a substructure such as patterns of gene co-expression within the luminal module of CRC, including resolution of gene co-expression clusters seen
previously in single-cell analysis of cellular sub-populations,24 or
on the other hand in the resolution of reproducible co-expressed
gene clusters of cancer associated immune responses.12,13,31,32
Thus, the network and its modular structure may be used at different levels to separate or coalesce cellular features.
CRC and BRCA show a remarkable communality in gene co-expression patterns consistent with a core set of principles that underpin patterns of co-expression in cancer. These can be summarized as (1) genes linked to cancer hallmark features; (2)
functional gene batteries linked to either specific pathways such
as the IFN-response or growth factor receptor signaling or to structural clusters of co-regulated genes; and (3) to co-expression related to copy number variation. In each case these shared drivers are associated in the networks with modules derived from the selective biology of the originating lineage. While this pattern is consistent with prevailing paradigms, both of the nature of cancer hallmarks and of the impact of cis-acting modules derived
from structural genomic abnormalities,22 an important feature
provided by PGCNA is the fact that such gene expression patterns are placed in context. One of the features we aimed for in the network analysis was that the process of edge reduction should both generate more visually accessible networks, and at the same time allow all elements of the expression data used in the module generation to be visualized. The importance of this is that the resulting networks provide context for how genes within and between modules are linked. The networks as an interactive resource summarize the co-expression patterns of genes and modules of genes as a searchable map rather than as disconnected lists or heatmap representations. While many genes retain only few edges in these networks, due to the nature of the edge reduction technique, all the data for each gene is provided as a fully accessible resource providing the correlation data for all gene pairs across the entire sets of expression data used for network generation.
As a platform from which to enrich molecular stratification, the
networks recover modules that map closely onto existing
classifications for both BRCA and CRC, and place these in a wider
context. Using hub genes to generate MEVs allowed the
integration of expression with mutation profiles in the TCGA
TCGA data from the perspective of the deep expression data available for BRCA and CRC. Together these provide evidence that
molecular classification may be enriched by using MEVs as a gene
expression barcode. The clustering of samples based on MEVs is consistent with the existing paradigms of expression-based
classifications for these cancers. However, the analyses illustrate
heterogeneity within clusters of cases that map onto these
classifications, when considering wider patterns of gene
expres-sion. In the context of molecular classification and precision
oncology there are competing goals of assigning patients to discrete classes versus characterizing bar codes of features that capture the wider genomic and expression features of an individual cancer. As a potential solution to this issue the derivation of the PGCNA network and the application of the resulting MEVs could provide a method for summarizing the overall expression state of a cancer sample. These MEVs take into account key representative genes from across the entire network of gene expression for that cancer type. Moreover, these are derived in a data-led agnostic fashion from across multiple openly accessible expression resources and allow comparison of informa-tive genes between cancer types. The MEVs while utilizing many more genes than are currently encompassed in most
expression-based classifiers, still remain within the range that could be
encompassed within focused gene expression platforms that meet regulatory standards.
In comparison to previous studies of TCGA consortium, and of the TCGA data by others, the primary difference lies in the application of PGCNA and the resulting network modules. In this context the rediscovery of particular associations between mutation state and expression as assessed with MEVs provides part of the validation of their utility. The analysis of TCGA data with MEVs illustrates how the summary of network level expression patterns at individual sample level can highlight heterogeneity of expression within clusters such as the expression variation within hypermutated CRC. Furthermore, the use of MEVs as ranking variables illustrates the occurrence of stereotypical associations of mutation and expression, this also illustrates the ability to identify previously unanticipated linkages, at least to our knowledge, such as that of nucleosome module expression with
GATA3mutation type in BRCA. Mast cell related gene expression in the immune neighborhood analysis provides another example,
the association particularly in the ductal subset withMAP3K1and
PIK3CA mutation and absence of TP53 mutation is distinctive relative to other immune cell types. This raises interesting questions as to why this particular immunological cell type should have such distinct associations with underlying molecular pathology.
The approach we describe here has both disease-specific and
general relevance. It provides an approach for extracting useful networks that can be applied effectively to diverse clinical and experimental data-sets, while also generating a mineable resource, and illustrates how resulting network modules might be used to
sit alongside existing expression-based classifications to enhance
molecular stratification.
METHODS
Method details
See Supplemental Fig. 1 for outline, will refer to numbers in thisfigure in the sections below. For a more detailed method discussion, along with the motivations for developing PGCNA, see the Supplemental Methods document (Supplemental Materials page 19 onwards), for details of software versions and data-sets see Table1.
Expression data-sets
See Supplemental Fig. 1 part 1
For the generation of the gene correlation networks 23 breast cancer (BRCA) and 12 colorectal cancer (CRC) gene expression data-sets were
downloaded from the Gene Expression Omnibus (BRCA, 7464 cases; 26 arrays)34–55and (CRC, 2399 cases; 11 arrays after merging of 2).56–65Three of the BRCA data-sets were on two different expression platforms (GSE3494, GSE36774 and GSE4922), these were analyzed independently, giving a total of 26 BRCA expression data-sets. In the case of CRC two related sets were merged (GSE17536), giving a total of 11 CRC data-sets.
TCGA data-sets. For independent assessment of the network modules two RNA-seq data-sets were downloaded from The Cancer Genome Atlas (BRCA/CRC data-sets were downloaded on 2017.11.15 from http:// cancergenome.nih.gov/) along with the corresponding simple nucleotide variation data (MuTect2 pipeline). The overlapping expression/mutation samples were used for downstream analyses.
Normalization and re-annotation of data. For each data-set the probes were re-annotated using the MyGene.info (http://mygene.info) API using all available references (e.g. NCBI Entrez, Ensembl etc.) and any ambiguous mappings manually assigned.66
Each data-set was quantile normalized using the R Limma package and the probes for each gene merged by taking the median value for probe sets with a Pearson correlation≥0.2 and the maximum value for those with a correlation <0.2.67
Network analysis
This discusses how the Parsimonious Gene Correlation Network Analysis (PGCNA) approach was developed.
Gene correlation calculation. See Supplemental Fig. 1 part 2 and 3 For each expression data-set the 80% most variant genes were used to calculate Spearman’s rank correlations for all gene pairs using the Python scipy.stats package. The resultantp-values and correlations matrices were merged across all data-sets for a given cancer by taking the median values (across the sets in which the gene pairs were contained) to give afinal median correlation matrix and its correspondingp-value matrix. Genes present in <9 data-sets for BRCA and <4 data-sets for CRC were removed from respective matrices. This gave afinal matrix size of 17,805 and 18,896 for BRCA and CRC, respectively. Finally, all correlations with ap-value >0.05 were set to 0 to reduce noise.
Edge reduction. See Supplemental Fig. 1 part 4
We tested a simple but aggressive edge reduction strategy as a way to improve module discovery and network visualization. For each gene (row) in a correlation matrix only theNmost correlated Edges Per Gene (EPG) were retained, withNranging from 3 to 10 (<3 gives orphan modules). The resulting matrixM, with entries written asM=(mij) was made symmetrical
by settingmij=mjifor all indicesiandjso thatM=MT(its transpose). For
EPG3 this reduced the nodes in BRCA from 43,231,589 to 49,199 and CRC from 42,142,502 to 52,257, in both cases >800-fold reduction (Supple-mental Table 1).
Data clustering. See Supplemental Fig. 1 part 5
The matrices from the edge reduction step alongside the Total matrices were clustered using three different approaches: hierarchical clustering using the R package fastcluster, k-means clustering using the R package kmeans and a network level clustering using the Fast unfolding of communities in large networks algorithm (version 0.3) referred to subsequently herein as FastUnfold.19,68FastUnfold was run 10,000 times at each EPG level and the 100 best (judged by the modularity score) were used for downstream analysis. The FastUnfold algorithm automatically converges on a module number and therefore does not require a user defined module number.
For the k-means clustering k was set to ±1 around the module number from the best FastUnfold solution (see Cluster selection) and for each k and EPG 50 iterations were run.
For hierarchical clustering eight different linkage methods (average, centroid, complete, Mcquitty, Median, Single, WardD and WardD2) were used and the resultant dendrograms cut at ±10 around the module number from the best FastUnfold solution giving 21 results for every input matrix (note: only the 2 best linkage methods, WardD/WardD2, are shown in Fig.1a).
Comparison of edge refinement approach. As well as edge-per-gene (EPG), three other edge refinement approaches were tested: iterative Pearson’s
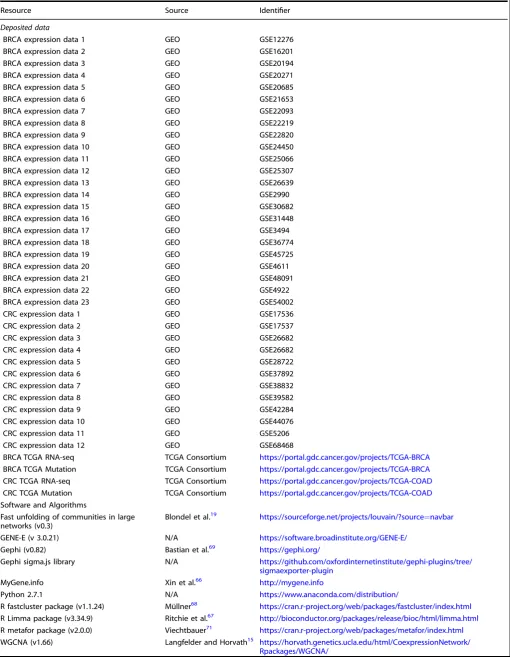
Table 1. Key resources table
Resource Source Identifier
Deposited data
BRCA expression data 1 GEO GSE12276 BRCA expression data 2 GEO GSE16201 BRCA expression data 3 GEO GSE20194 BRCA expression data 4 GEO GSE20271 BRCA expression data 5 GEO GSE20685 BRCA expression data 6 GEO GSE21653 BRCA expression data 7 GEO GSE22093 BRCA expression data 8 GEO GSE22219 BRCA expression data 9 GEO GSE22820 BRCA expression data 10 GEO GSE24450 BRCA expression data 11 GEO GSE25066 BRCA expression data 12 GEO GSE25307 BRCA expression data 13 GEO GSE26639 BRCA expression data 14 GEO GSE2990 BRCA expression data 15 GEO GSE30682 BRCA expression data 16 GEO GSE31448 BRCA expression data 17 GEO GSE3494 BRCA expression data 18 GEO GSE36774 BRCA expression data 19 GEO GSE45725 BRCA expression data 20 GEO GSE4611 BRCA expression data 21 GEO GSE48091 BRCA expression data 22 GEO GSE4922 BRCA expression data 23 GEO GSE54002 CRC expression data 1 GEO GSE17536 CRC expression data 2 GEO GSE17537 CRC expression data 3 GEO GSE26682 CRC expression data 4 GEO GSE26682 CRC expression data 5 GEO GSE28722 CRC expression data 6 GEO GSE37892 CRC expression data 7 GEO GSE38832 CRC expression data 8 GEO GSE39582 CRC expression data 9 GEO GSE42284 CRC expression data 10 GEO GSE44076 CRC expression data 11 GEO GSE5206 CRC expression data 12 GEO GSE68468
BRCA TCGA RNA-seq TCGA Consortium https://portal.gdc.cancer.gov/projects/TCGA-BRCA
BRCA TCGA Mutation TCGA Consortium https://portal.gdc.cancer.gov/projects/TCGA-BRCA
CRC TCGA RNA-seq TCGA Consortium https://portal.gdc.cancer.gov/projects/TCGA-COAD
CRC TCGA Mutation TCGA Consortium https://portal.gdc.cancer.gov/projects/TCGA-COAD
Software and Algorithms
Fast unfolding of communities in large networks (v0.3)
Blondel et al.19 https://sourceforge.net/projects/louvain/?source
=navbar
GENE-E (v 3.0.21) N/A https://software.broadinstitute.org/GENE-E/
Gephi (v0.82) Bastian et al.69 https://gephi.org/
Gephi sigma.js library N/A https://github.com/oxfordinternetinstitute/gephi-plugins/tree/ sigmaexporter-plugin
MyGene.info Xin et al.66 http://mygene.info
Python 2.7.1 N/A https://www.anaconda.com/distribution/
R fastcluster package (v1.1.24) Müllner68 https://cran.r-project.org/web/packages/fastcluster/index.html
R Limma package (v3.34.9) Ritchie et al.67 http://bioconductor.org/packages/release/bioc/html/limma.html
R metafor package (v2.0.0) Viechtbauer71 https://cran.r-project.org/web/packages/metafor/index.html
WGCNA (v1.66) Langfelder and Horvath15 https://horvath.genetics.ucla.edu/html/CoexpressionNetwork/ Rpackages/WGCNA/