This is a repository copy of
The Development of a Comprehensive Database for Accident
Analysis.
.
White Rose Research Online URL for this paper:
http://eprints.whiterose.ac.uk/2194/
Monograph:
Austin, K.P. (1992) The Development of a Comprehensive Database for Accident Analysis.
Working Paper. Institute of Transport Studies, University of Leeds , Leeds, UK.
Working Paper 378
[email protected] https://eprints.whiterose.ac.uk/ Reuse
Unless indicated otherwise, fulltext items are protected by copyright with all rights reserved. The copyright exception in section 29 of the Copyright, Designs and Patents Act 1988 allows the making of a single copy solely for the purpose of non-commercial research or private study within the limits of fair dealing. The publisher or other rights-holder may allow further reproduction and re-use of this version - refer to the White Rose Research Online record for this item. Where records identify the publisher as the copyright holder, users can verify any specific terms of use on the publisher’s website.
Takedown
If you consider content in White Rose Research Online to be in breach of UK law, please notify us by
White Rose Research Online
http://eprints.whiterose.ac.uk/
Institute of Transport Studies
University of Leeds
This is an ITS Working Paper produced and published by the University of
Leeds. ITS Working Papers are intended to provide information and encourage
discussion on a topic in advance of formal publication. They represent only the
views of the authors, and do not necessarily reflect the views or approval of the
sponsors.
White Rose Repository URL for this paper:
http://eprints.whiterose.ac.uk/
2194/
Published paper
Austin, K.P. (1992) The Development of a Comprehensive Database for Accident
Analysis. Institute of Transport Studies, University of Leeds. Working Paper 378
UNIVERSITY OF LEEDS
Institute for Transport Studies
ITS Working Paper 378 ISSN
0142-8942December 1992
THE DEVELOPMENT OF A COMPREHENSIVE
DATABASE FOR ACCIDENT ANALYSIS
KP Austin
This work was undertaken on a Research Studentship sponsored by the
Science and Engineering Research Council with the assistance of Humberside County
Council.
ITS Working Papers are intended to provide information and encourage discussion on a topic in advance of formal publication. They represent only the views of the authors, and do not necessarily reflect the views or approval of the sponsors.
Page
ABSTRACT
1.INTRODUCTION 1
2.THE USE OF ADDITIONAL DATA BY HIGHWAY AUTHORITIES 3
2.1The use of additional data by highway authority types 3
2.2The most important sources used 5
2.3The number of sources used 5
2.4Studies on under-reporting and errors in data collection 6
3.THE LINKING OF HOSPITAL AND POLICE RECORDS 7
4.INFORMATION ON NON REPORTED ACCIDENTS 9
5.THE USE OF THE ADDITIONAL INFORMATION FROM HOSPITAL DATA 10
5.1Injury location by passengers seating position 10
5.2Identification of a casualties home location 11
6.METHODS OF REDUCING THE LEVEL OF ERRORS 12
7.WAYS OF IMPROVING THE SELECTION OF HIGH ACCIDENT LOCATIONS 14
8.SUMMARY AND CONCLUSION 16
9.ACKNOWLEDGEMENTS 16
ABSTRACT
AUSTIN, KP (1992). The development of a comprehensive database for accident analysis.
ITS Working Paper378, Institute for Transport Studies, University of Leeds, Leeds.
The Road Safety Code of Good Practice states that highway authorities should consider
obtaining supplementary road safety data, to give a better assessment of the level of under-reporting and to improve the safety studies they undertake. This paper examines the extra sources of data that are available and used by highway authorities. It shows an improved system of linking police and hospital injury data and assesses the potential for the use of other such data.
A questionnaire survey of all highway authorities in Britain was undertaken which showed that data sources such as traffic flows were used regularly, whereas others such as hospital data were rarely used. It was also found that when attempts were made to combine data much of the work was done manually.
One of the most useful supplementary sources of information on accidents is hospital casualty data. A method of linking this with police reported casualty data by using, among other things, the name and address of the casualty has been shown to produce a considerably improved match than that in studies previously undertaken. This has thus been used to evaluate under-reporting and the nature of specific injuries to those involved in accidents.
This study looks at the possibilities of including other data sources which could be used to assist authorities in validating accident forms and aiding in the selection of accident sites suitable for remedial treatment.
KEY-WORDS: Accident analysis, road safetu, geographic information systems.
THE DEVELOPMENT OF A COMPREHENSIVE DATABASE FOR
ACCIDENT ANALYSIS
1.
INTRODUCTION
Many studies in the past have shown that not all injury accidents are reported to the Police. In addition, errors occur in the coding and transcription of the Police accident records, even after they have passed validation checks. Only a limited amount of information can be entered onto the accident (or STATS 19) record and so many factors relating to the accident would be omitted. The process of effectively selecting sites for remedial treatment can be time consuming and so less rigorous techniques have been developed which may not produce such reliable results.
The identification and design of safety improvement schemes relies on the accuracy and consistency of the data and the methods of analysing them. The existence of non-reporting and errors in the data coupled with inappropriate selection methods may lead to the implementation of schemes that are not optimal, either in casualty reduction or financial terms.
The use of a Geographic Information System (GIS) in accident analysis is a relatively new concept. A GIS is defined by the Department of Environment (1987) as:
"A system of collecting, storing, checking, manipulating, analysing and displaying data which are spatially referenced to the earth."
As a result of its ability to analyse and graphically represent data some Highway Authorities already use such a system for simple accident enquiries. An example of this is shown in Figure 1 which displays the accidents by severity occurring in the dark when the road surface is wet. This project takes the idea a step forward, in that it uses a GIS to. •Provide new information for safety studies by combining data sources.
•Validate STATS 19 records so as to obtain a more accurate data file.
•Improve the efficiency in selecting the areas and routes amenable to treatment.
The study area for this project was limited to a five kilometre square comprising North Hull which is shown in Figure 1. It was felt that if too large an area was covered the number of data sources would have been limited and so the potential of the system could not have been explored as fully as one would have liked. Even so, between 1987 and 1991 there were 1884 injury accidents occurring in the area chosen and so the quantity of accident data was considered to be adequate.
In addition, an effective method of linking hospital and Police data would allow the levels of under-reporting for various groups and the injuries sustained by the casualty to be assessed. This paper reports on the results of a questionnaire survey of all highway authorities in Britain as to the sources of data that are currently used and the level of errors and under-reporting that they consider to exist. It then shows how one of these sources, namely hospital data can be linked to the STATS 19 data to identify the levels of under-reporting and provide new information of use in numerous safety studies.
2
2.THE USE OF ADDITIONAL DATA BY HIGHWAY AUTHORITIES
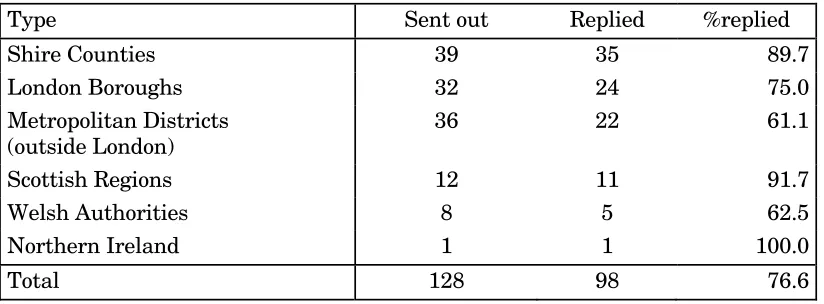
[image:7.595.72.484.309.461.2]A questionnaire was designed to establish what additional sources of data are used for safety studies by highway authorities. It was sent to all the highway authorities in Great Britain and Northern Ireland. The first distribution was achieved by the courtesy of the Standing Advisory Group on Accident Reduction (SAGAR). A reminder questionnaire was sent directly to the highway authorities who had not replied. Highway authorities were asked to complete the questionnaire rather than Joint Data Teams (who would handle the accident data for all authorities in a metropolitan area), because it would be these authorities who would undertake the safety schemes. The distribution of returns by authority type is shown in Table 1.
Table 1:Questionnaire replies by highway authority type
Type Sent out Replied %replied
Shire Counties 39 35 89.7
London Boroughs 32 24 75.0
Metropolitan Districts (outside London)
36 22 61.1
Scottish Regions 12 11 91.7
Welsh Authorities 8 5 62.5
Northern Ireland 1 1 100.0
Total 128 98 76.6
Of the 128 questionnaires sent out 98 were returned, an overall response rate of 76.6% Four questionnaires out of the ninety-eight were returned after the data was analysed and so they are not used in the study. For future analysis the Scottish, Welsh and Northern Irish Authorities were combined into one group, the Non-English Authorities to ensure confidentiality and enabling the results to be more useful.
2.1THE USE OF ADDITIONAL DATA BY HIGHWAY AUTHORITY TYPE
4
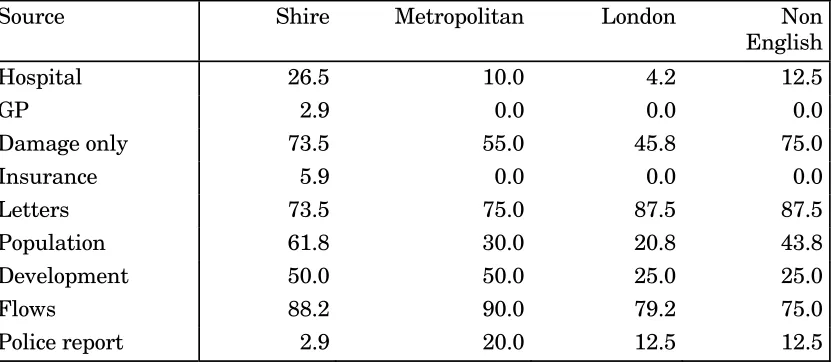
Table 2:The use of additional data sources by Highway Authority type as a
percentage of those received
Source Shire Metropolitan London Non
English
Hospital 26.5 10.0 4.2 12.5
GP 2.9 0.0 0.0 0.0
Damage only 73.5 55.0 45.8 75.0
Insurance 5.9 0.0 0.0 0.0
Letters 73.5 75.0 87.5 87.5
Population 61.8 30.0 20.8 43.8
Development 50.0 50.0 25.0 25.0
Flows 88.2 90.0 79.2 75.0
Police report 2.9 20.0 12.5 12.5
Shire counties use hospital data more than other authorities. This may be because they are larger in size and so the hospitals to which the accidents relate are within the same authority, whereas in the metropolitan districts and London boroughs casualties are more likely to be conveyed to hospitals in adjoining authorities. In general this source is used to investigate under-reporting, especially for pedestrians and cyclists.
Only one authority, a shire county, used general practitioner data. It was used occasionally in devising Education, Training and Publicity (ETP) campaigns. Two authorities, again shire counties, have obtained insurance data and one of them acquired it from the county insurer which detailed claims made against the council.
The shire counties and the non-English authorities use damage only accident statistics more than the metropolitan authorities and the London boroughs (X2 = 5.77 with 1 df,
p<0.05.) This is probably because these authorities would have a higher proportion of rural areas and so may need this to supplement the data when personal injury accident data is scarce. The use for this purpose is significantly greater in the shire counties and the non-English authorities than in the metropolitan districts and London boroughs (X2 =
4.42 with 1 df, p<0.05).
All authorities take account of letters and council minutes which reflects their role as public servants. This source tends to be used for identifying problem sites that may not have been selected by traditional measures. In addition most authorities use traffic flows, which are used to calculate accident rates.
The shire counties and the metropolitan authorities use information on highway and land developments more than the London boroughs and the non-English authorities (X2 = 5.98
with 1 df, p<0.05). This source is used to assess the effect of proposed new developments on accidents and is also used for safety audits.
Shire counties and the non-English authorities use population data more than the London boroughs and the metropolitan authorities (X2 = 9.27 with 1 df, p<0.05). This is used to
5
Other sources include police records for witness statements, garage reports, SCRIM data, pre-paid postcards, damage to street furniture and animal accidents.
2.2THE MOST IMPORTANT SOURCES USED
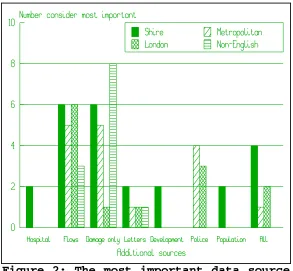
[image:10.595.70.363.217.488.2]In order to determine which sources should be concentrated upon when developing a comprehensive accident analysis system, the authorities were asked as to which of the additional sources of data are most important to them. The results are shown in Figure 2.
Figure 2: The most important data source
by highway authority type.
The most important additional sources of data are traffic flows and police reported damage only accidents, although in the London boroughs and the metropolitan authorities the police reports containing the witness statements are considered most useful. These items of data should be included in an accident analysis system.
2.3THE NUMBER OF SOURCES USED
The total number of sources were calculated for each authority and the distribution is shown in Figure 3.
6 system would be from the shire counties.
2.4STUDIES ON UNDER-REPORTING AND ERRORS IN DATA COLLECTION
Only twenty-two authorities claimed they had any evidence of under-reporting in their area. Of these only four provided any figures to substantiate this claim, of which only one authority obtained data from hospitals for all user groups. This was undertaken by the author and the results are shown in Section four. A further three authorities had obtained figures for certain groups such as cyclists and child pedestrians.
The Road Safety Code of Good Practice (1989) acknowledges that there are errors in Police reports and to rectify this:
"Arrangements should therefore be introduced by Highway Authorities in co-operation with Police to monitor the accuracy of reports."
The questionnaire asked the Highway Authorities to identify which STATS 19 items were most inaccurately recorded from casualty severity, casualty age, accident location, junction type, speed limit and junction control. Accident location was almost universally considered to have the most number of errors, followed by junction type. The other four items specified were considered to be fairly accurate.
In overall terms there is a great potential for the expansion in the number and use of the additional pieces of accident data in most authorities. The application of some of these sources will be the subject of the remaining sections.
3.THE LINKING OF HOSPITAL AND POLICE RECORDS
Many injury accidents are not reported to the Police and the casualty details that are recorded on the STATS 19 records are fairly sparse, hence a different approach needs to be adopted to obtain this information. The Road Safety Code of Good Practice (1989) states that:
"Local Highway Authorities should consider obtaining supplementary information from local hospital records..."
This source would therefore seem to be appropriate to obtain this much needed data. Other studies have attempted to link hospital and police reports. Nicholl(1980), Sayer and Hitchcock(1984), Stone(1984) and Fife(1989) all used some combination of the variables of age, user class, accident date, gender and location. Barancik and Fife(1985) used similar variables but also had access to the coded name of the casualty.
The hospital records that did not match with a corresponding police record can be attributed to either:
•failure to report accidents to the police
7
Unfortunately the above studies could not separate these two factors thus the only way to assess these was to compare the results with questionnaire studies such as Bull and Roberts(1973) and Hobbs et al(1979). The questionnaire studies found that almost all fatalities are reported and so the matching system for fatalities developed by Fife(1989) would have failed to link 15% of the hospital records that had a corresponding Police record. Hobbs et al(1979) and Bull and Roberts(1973) found that about 80% of all serious injuries were reported to the Police, but this includes those who were not admitted to hospital, hence the reporting rate for in-patients would be higher at say 90%. Both Nicholl(1980) and Stone(1984) developed methods to link hospital in-patient records to STATS 19 files but they failed to correctly match a half and a quarter respectively. For all hospital casualties, the reporting rate for the questionnaire studies was between 65 and 72%, so at the very least Sayer and Hitchcock(1984) and Barancik and Fife(1985) failed to correctly match 67% and 15% respectively. Sayer and Hitchcock(1984) used data from a less developed country which may affect the success of matching, as accurate data may not be available. There is considerable potential to improve the effectiveness of the matching process and this will be explained in the following section.
For this study the hospital records were obtained from the Accident and Emergency department of Hull Royal Infirmary. There were 1593 records on their road traffic accident database between May and December 1991. The STATS 19 records and the Police records were linked by accident reference number and casualty number. They then could be used to match with the hospital records.
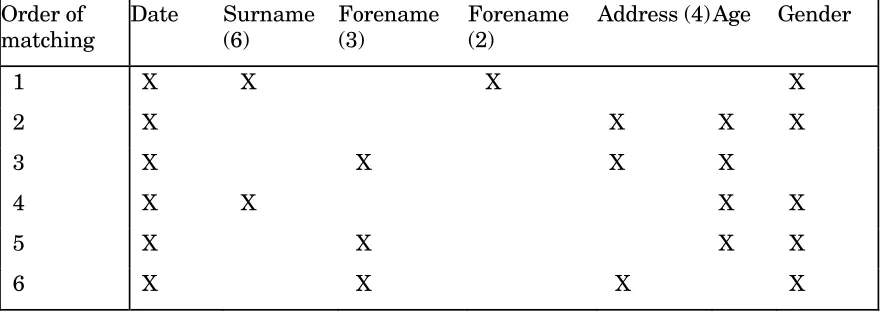
[image:12.595.72.516.500.656.2]The variables used in this process were surname, forename, address, age and gender of the casualty and the accident date. The length of the name and address was shortened since the first few letters would usually be enough to identify a casualty (the number of characters used are shown in brackets in Table 3). The algorithm was developed using Dataease Query Language (DQL) on the Dataease 4.2 database. The algorithm is shown in Table 3.
Table 3:The matching algorithm for linking police and hospital casualty records
Order of matching Date Surname (6) Forename (3) Forename (2)
Address (4) Age Gender
1 X X X X
2 X X X X
3 X X X X
4 X X X X
5 X X X X
6 X X X X
8
[image:13.595.71.361.165.481.2]characters of the forename were used so as to accept those matches where the third digit was incorrect. There were nineteen matched cases where the three digit forenames were different between the hospital and Police records but the two digit forenames were the same. The addition of this factor therefore helps to provide a more accurate matching method. The system of matching is shown in Figure 4.
Figure 4:The matching system for police
and hospital casualties.
The first hospital record is taken as is the first police record, the two are compared using the matching algorithm shown in Table 3. That is, they are first compared using the variables of date, surname, forename and gender. They are then compared using date, age, address and gender, and so on until the sixth stage has been completed. If any of these result in a match then the two records are merged and written to a file. The next Police record would be taken and the process would continue until all Police records are checked. The next hospital record would be taken and compared with the first Police record, until all comparisons have been made.
9
4.INFORMATION ON NON-REPORTED ACCIDENTS
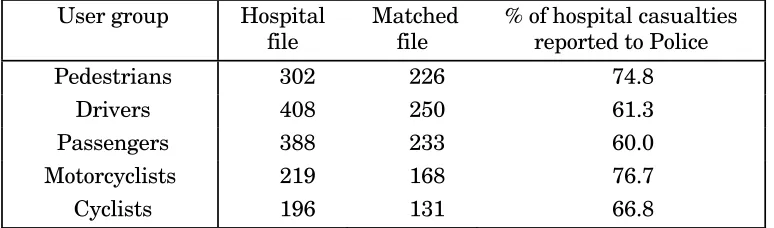
[image:14.595.71.458.242.356.2]The absence of information on casualties involved in accidents can lead to biases in the selection and design of engineering and ETP schemes. For example, if only 20% of cycle accidents are reported they may not be given the correct weight in the implementation of schemes. The linking of police and hospital databases would therefore be desirable to achieve more accurate estimation of the number of casualties of different ages and user group. The results of under-reporting separated into user group are shown in Table 4.
Table 4:Reporting rates by user group
User group Hospital file
Matched file
% of hospital casualties reported to Police
Pedestrians 302 226 74.8
Drivers 408 250 61.3
Passengers 388 233 60.0
Motorcyclists 219 168 76.7
Cyclists 196 131 66.8
These results are different to those found in other studies which may be due to the limitations of the hospital database with regard to obtaining money from insurance companies. That is to say, the hospital can claim £25 from the drivers' insurance company. The hospital would therefore want to include all these casualties and so the level of hospital reporting would be high and hence the level of Police reporting would be low. For pedal cycle only accidents the converse may be true. The reporting rate by age of casualty is shown in Table 5.
Table 5:Reporting rates by age of casualty
Age Hospital Matched % reported
0 - 14 228 161 70.6
15 - 19 260 174 66.9
20 - 34 588 370 62.3
35 - 64 353 229 64.9
65+ 98 74 75.5
Blank 66 30 45.4
The oldest (>65) and youngest (0-14) age groups were combined and were found to have a significantly higher level of reporting compared to those casualties aged 15 to 64 (X2 = 6.82
with 1 df, p<0.01). This may be because these groups tend to have a greater proportion of pedestrian accidents, which in turn have the highest reporting rates. Pedestrian accidents were removed from the sample and the statistical test was re-run. It was found that there was no significant difference at the 5% level between the 0-14 and 65+ group and the 15-64 age group (X2 = 0.0036 with 1 df, p>0.05). In fact the 0-14 group has the lowest level of
[image:14.595.73.397.501.591.2]10
5.THE USE OF THE ADDITIONAL INFORMATION FROM
HOSPITAL DATA
The linking of the Police and the hospital databases attained a great deal of additional information to be used in safety studies. The extra data includes among other things, the bodily location of injury and the home location of the casualty. The following sections will show how the injury and address data are analysed and how they can be used for ETP campaigns.
5.1INJURY LOCATION BY PASSENGERS SEATING POSITION
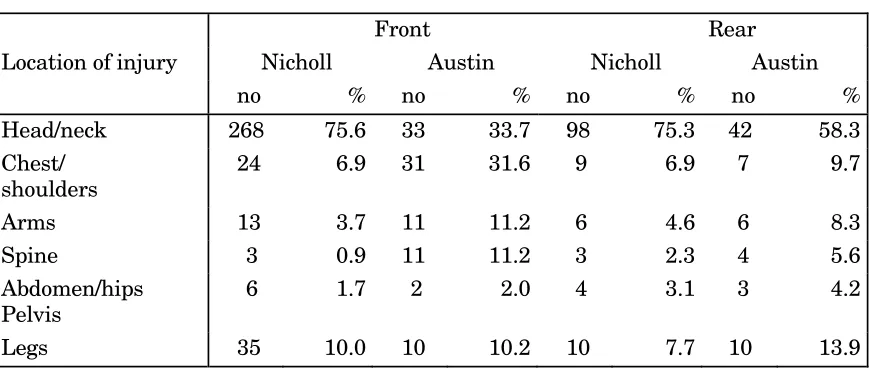
[image:15.595.75.510.369.553.2]The non-wearing of seat belts by rear seat passengers is considered to be a common problem. This factor may not show up very strongly from accident reports since the Police arrive after the accident has happened. The casualty may state that he was wearing a seat belt to avoid prosecution. Hence injury comparison studies may be a useful method to determine the extent of the problem. The location of injury by the seating position of car passengers by Austin(1992a) was compared with the results of Nicholl(1980). This is shown in Table 6.
Table 6: Injury location by passengers seating position
Front Rear
Location of injury Nicholl Austin Nicholl Austin
no % no % no % no %
Head/neck 268 75.6 33 33.7 98 75.3 42 58.3
Chest/ shoulders
24 6.9 31 31.6 9 6.9 7 9.7
Arms 13 3.7 11 11.2 6 4.6 6 8.3
Spine 3 0.9 11 11.2 3 2.3 4 5.6
Abdomen/hips Pelvis
6 1.7 2 2.0 4 3.1 3 4.2
Legs 35 10.0 10 10.2 10 7.7 10 13.9
The results of Nicholl (1980) show that front and rear seat passengers have the same proportion of injuries to the head and neck. In Austin (1992a) head injuries in general form a lower proportion of total injuries than in Nicholl (1980). The data in Nicholl's (1980) study only contained those who were admitted as in-patients and so head/neck injuries may form a larger proportion of injuries for in-patients, since they may be kept in for observation.
In Austin(1992a) there is a greater proportion of head/neck injuries to rear seat passengers than to front seat passengers (X2 = 10.2 with 1 df, p< 0.01). In contrast, chest
and shoulder injuries form a larger proportion of total injuries to front seat passengers than to those in the rear seats (X2 = 11.5 with 1 df, p<0.01). The results indicate that the
11
by the law. Front seat passengers do seem to wear seat belts which would reduce head injuries but increase the number of less severe chest injuries. Humberside County Council Road Safety Officers are now working on an ETP campaign to alert passengers to this problem.
5.2IDENTIFICATION OF A CASUALTY'S HOME LOCATION
The inclusion of the casualty's postcode can help select the geographic areas that should be concentrated upon in ETP campaigns. The Road Safety Officers for Humberside County Council wished to direct a pedestrian campaign in Hull. Many pedestrians were being involved in accidents on the main arterial roads and it was assumed that they lived on the housing estates on either side of these. The Road Safety Officers had three options of how to direct the scheme in these housing estates.
•Publicise in all areas equally, which would be costly and may not tackle the real problem areas.
•Guess the areas from experience. This is often accurate, but errors may occur, and the lack of statistics on the problem make the justification of implementing the scheme more difficult.
•Obtain the casualties home location hence finding the true areas of concern.
The third option was chosen, but by using Police reports for the addresses it would take a considerable time to find the areas where they live since postcodes are not included. It would also only include those casualties that were reported to the Police. Hence the hospital database was used, which contained the postcode for over 90% of the casualties.
The postcodes and the age of casualties were printed out and were collated. This allowed the Road Safety Officers to find the areas to target and the method of campaign. For example, if pedestrian casualties from one area involved a large number of children then a campaign in the schools would be more appropriate, whereas if it were older people then a different approach would have to be developed.
6.METHODS OF REDUCING THE LEVEL OF ERRORS
The current system of checking the accuracy of the accident report forms relies on a computer program which compares different items on the STATS 19 record. For example, if junction type is classified as a T-junction then the junction control category must be coded. This method does not validate for errors, rather it checks for consistency in Police reporting and so cannot tell whether the T-junction was in fact a crossroads. A solution is to use a GIS to resolve these problems. The ARC/INFO GIS was used to validate the site specific STATS 19 data items of:
•road class • road number
•carriageway type or markings •speed limit
12 •pedestrian crossing facilities
•council area.
The procedure used to identify those accidents where road class was coded incorrectly is as follows. The classified roads were separated from those that were unclassified. A command on the GIS automatically draws an outline 34 metres away from the centre line of these roads. This distance was chosen since a junction accident could occur up to 20 metres from the junction. Added to this is the standard carriageway width of approximately 3.6 metres and the coding error of the Ordnance Survey of 0.4 metres. However, the convention for plotting accidents is to use the bottom left hand point of the grid square, hence if the accident happened at the top of the square this would add another 10 metres to the distance. The accidents were merged with this map data, so that any accident occurring inside this 34 metre boundary would be assigned a unique code. An enquiry was then made to find any accident inside this boundary where the STATS 19 record stated that the road was unclassified. There were thirty two accidents that occurred on or within 34 metres of a classified road but were coded as unclassified. On further investigation it was found that two accidents were more than 24 metres from the road centre line and so could have been coded correctly. A second enquiry was made to determine those accidents which occurred on unclassified roads but were coded as being on a classified road. This resulted in a further thirty accidents where road class was in error. The accidents that were identified by this process are shown in Figure 5.
In total there were 62 (3.2%) accidents which were definitely misrepresented. For the accidents that are in error, the description of the accident location can be brought up onto the screen and checked. Hence, those accidents that have been wrongly located can be moved to the correct location and those that have road class coded incorrectly can be changed. This system can identify many of those accidents that have the incorrect location, since it is likely that one or more of the site specific variables would be coded incorrectly and so would be highlighted.
Some items of casualty data can be validated by using the linked Police-hospital database. These are:
•casualty age •road user group •casualty gender.
13
15 •driver age
•driver gender •vehicle type •number of axles
•maximum gross weight
The report `The Car and driver injury accident rates'(1991) attempted to link vehicle details between the DVLC and STATS 19 records and achieved a 55% match by using vehicle registration number. An improved link could be developed by including the owners name and address in the matching algorithm. A link with the drivers' database could also be facilitated by using the name, address, age and gender of the driver. In addition to checking for errors it will give a great deal of extra information for use in accident studies.
7.WAYS OF IMPROVING THE SELECTION OF HIGH ACCIDENT
LOCATIONS
A major part of the safety engineers work is to identify those sections of the highway network that have accident problems. These locations can be divided into single site, mass action, area and route. This section concerns itself with the identification of areas and routes only.
For area studies the principle was to identify those zones that have a priority for traffic calming based on safety aspects. A zone in this case was identified as being an area between roads of some strategic importance. The priority rating for these accident zones is made up of three items:
1)injury accidents per kilometre of roads within the area
2) proportion of child injury accidents
3)estimation of local concern based upon letters from the public, council minutes and public meetings referring to safety problems in the area as well as possibilities for environmental improvement.
The values for each item were factored up as a percentage of the highest value which gave equal weighting to each item. These could then be summed to provide a study priority.
Originally, the total number of accidents, those involving children and the road length inside each zone were calculated manually. The development of a method using a GIS will remove this element. The GIS calculated the total number of accidents (see Figure 6) and those involving children within each zone. The OSCAR road centre-line data were merged with the zones so the lengths of road within each zone could be calculated. All the information would be transferred to a database where the ranking process would be undertaken. The saving in time by using this method has been estimated at 20 person days per search.
16
accident rates per vehicle kilometre. Urban routes have a higher accident rate than rural routes which is due to the level of vehicular interaction and number of junctions per kilometre. Hence, these sections would always be rated higher, even though they may not be different from the norm and so would be difficult to treat. A procedure to alleviate this problem was developed by West Yorkshire Highway Engineering and Technical Services (HETS) (Austin(1992b)). The average accident rate per kilometre for urban and rural sections were calculated. The actual accident rate for each section was divided by the average (rural or urban) and then the proportionate deviance from the mean could be found for each site.
8.SUMMARY AND CONCLUSION
The use by highway authorities of safety data sources in addition to STATS 19 data is fairly limited at present. They consider the most important sources to be traffic flows and police reported damage-only accidents, and these should be included in any accident analysis system. Few authorities have obtained any information on under-reporting, and of those authorities who had evidence of errors in the recording of accident data, accident location was considered to be coded most incorrectly. The linking of police and hospital data in this paper has enabled an accurate assessment of under-reporting and given useful casualty data to assist in the design of some ETP campaigns.
The use of a GIS to validate the STATS 19 records concerning those site specific factors and the linked police-hospital database should lead to a large reduction in the number of errors on the STATS 19 database. The GIS also has the capability to identify areas and routes containing high numbers of accidents. This would reduce the time taken to select the sites, hence enabling the engineer to spend more time on their other tasks.
9.ACKNOWLEDGEMENTS
17
10.REFERENCES
AUSTIN, KP. (1992a). A linked Police and hospital road accident database for Humberside. ITS Working paper 369, Institute for Transport Studies, University of Leeds.
AUSTIN, KP. (1992b). A comparison of procedures of Local Authority safety sections. ITS Working Paper 371, Institute for Transport Studies, University of Leeds.
BARANCIK, JI. and FIFE, D. (1985). Discrepancies in vehicular crash injury reporting. Northeastern Trauma Study IV. Accident Analysis and Prevention, 17(2), pp 147-154.
BULL, JP. and ROBERTS, BJ. (1973). Road accident statistics. A comparison of Police and hospital information. Accidents Analysis and Prevention, 5(1), pp 45-53.
DEPARTMENT OF THE ENVIRONMENT (1987). Handling geographic information.
HMSO, London.
DEPARTMENT OF TRANSPORT (1991). Car and driver injury accident rates. Great Britain 1989. Transport Statistics Report. HMSO, London.
FIFE, D. (1989). Matching Fatal Accident Reporting System cases with National Centre for Health Statistics motor vehicle deaths. Accident Analysis and Prevention, 21(1),
pp79-83.
HOBBS, CA., GRATTAN, E. and HOBBS, JA. (1979). Classification of severity by length of stay in hospital. LR871, Transport and Road Research Laboratory.
LOCAL AUTHORITIES ASSOCIATION (1989). Road Safety Code of Good Practice. Association of County Councils, London.
MAAS, MW. and HARRIS, S. (1984) Police recording of road accidents in-patients.
Accident Analysis and Prevention, 16(3), pp 167 - 184.
NICHOLL, JP. (1980). The use of hospital in-patient data in the analysis of injuries sustained by road accident casualties. SR628, Transport and Road Research Laboratory.
SAYER, I and HITCHCOCK, R. (1984). An analysis of Police and medical road accident data:Sri Lanka 1977-1981. SR834, Transport and Road Research Laboratory.