IN SEVEN CITIES OF CENTRAL JAVA : 1961-1971
by
RININGSIH SALADI
A thesis submitted in partial fulfilment of the requirement for the degree of Master
of Arts in Demography in the Australian National University
' UBRARY O
Except where otherwise indicated, this thesis is my own work.
DEMOGRAPHIC COMPONENTS OF POPULATION GROWTH IN SEVEN CITIES OF CENTRAL JAVA : 1961-1971
ABSTRACT
CONTENTS
Page
ABSTRACT i
LIST OF TABLES iV
LIST OF FIGURES V
CHAPTER
1 INTRODUCTION 1
1.1 Research Problem 1
1.2 Predominant Characteristics of the Seven Cities 3
1.3 The Approach 8
2 AGE DISTRIBUTION 10
2.1 The Importance of Age Distribution 10
2.2 The Reliability of Age Data 12
2.3 Differences in Age Distribution 16
2.4 Conclusion 20
3 FERTILITY AND MORTALITY 23
3.1 Fertility 23
3.1.1 Age at First Marriage 23
3.1.2 Measures of Fertility 32
3.2 Mortality 36
3.2.1 Estimation of Life Table 37
3.2.2 Crude Death Rate 41
3.3 Conclusion 41
4 MIGRATION 43
4.1 Estimation of Net Migration 43
4.2 Characteristics of Inmigrants from Other Provinces 52
4.2.1 Age at Migration and Sex 54
Page
4.3 Motives for Moving 60
CONCLUSION AND IMPLICATIONS 62
LIST OF TABLES
Table Title Page
1.1 Some Characteristics of the Seven Cities 2
2.1 Deviation of Per Cent Blended Population from Ten by Terminal
Digit in the Seven Cities of Central Java and Indonesia, 1971 14 2.2 Scores for Age and Sex Ratios for Quinquennial Groups for the
Seven Cities in Central Java and Indonesia, 1971 17 2.3 Percentage of Population in Various Age Groups, Median Age
and Dependency Ratio (1971) and Population Growth Rates
(1961-1971) for the Seven Cities and Jakarta 18 3.1 Percentage of Women Single by Age Group and Singulate Mean
Age at Marriage for the Seven Cities in Central Java, 1971 25 3.2 Percentages of Single Women Aged 15-19 Attaining Primary
School Plus and Percentages of Population Who Are Moslem,
for the Seven Cities in Central Java, 1971 25 3.3 Percentage of Single Women in Selected Age Groups and Years
in Java 28
3.4 Percentages of Single Women Aged 15-19 for Provinces in
Selected Series of Population Surveys 28
3.5 Percentage of Women with No Schooling by Age, for the Seven
Cities in Central Java, 1971 30
3.6 Trend of Fertility Rates at Ages 15-19 for the Seven Cities
in Central Java, 1961-71 30
3.7 Mean Number of Children Ever Born, Born to Ever Married
Women of the Seven Cities in Central Java, by Age, 1971 34 3.8 Average Age Specific Fertility Rates and Total Fertility Rates
During 1961-1970 for the Seven Cities of Central Java 34 3.9 Estimates of Q(2), Q(3) and Q(5) Using Brass' Method and 'West'
Level of Mortality, for the Seven Cities of Central Java, 1971 38 3.10 Standard Logit l-I(xs) for Males and Females of the Seven
Cities in Central Java 42
4.1 Survival Ratio, 1971 Population, and 1961 Estimated Population,
by Age and Sex, in Semarang 45
4.2 Survival Ratio, 1971 Population, and 1961 Estimated Population,
by Age and Sex, in Salatiga ' 46
4.3 Survival Ratio, 1971 Population, and 1961 Estimated Population,
Table Title Page 4.4 Survival Ratio, 1971 Population, and 1961 Estimated Population,
by Age and Sex, in Magelang 48
4.5 Survival Ratio, 1971 Population, and 1961 Estimated Population,
by Age and Sex, in Surakarta 49
4.6 Survival Ratio, 1971 Population, and 1961 Estimated Population,
by Age and Sex, in Yogyakarta 50
4.7 Survival Ratio, 1971 Population, and 1961 Estimated Population,
by Age and Sex, in Pekalongan 51
4.8 The Calculation of the Average Annual Rates of Net Migration
During 1961-1971, for the Seven Cities in Central Java 52 4.9 Number and Sex of Inmigrants to the Seven Cities of Central
Java from Other Provinces, 1961-1971 54
4.10 Percentage Distribution of Migrants to the Seven Cities in
Central Java from Other Provinces by Age at Migration, 1971 55 4.11 Percentage of Inmigrants to the Seven Cities in Central Java
from Other Provinces, by Sex and Age at Migration, 19'71 57 4.12 Percentaqe Distribution of Inmigrants to the Seven Cities in
Central Java from Other Provinces bv Current Age, Duration of
Residence, Marital Status, and Activities, 1971 58 5.1 Rates and Components of Population Growth for the Seven Cities
of Central Java 62
LIST OF FIGURES
Figure
2.1 Age-Sex Distribution of the Cities 21
INTRODUCTION
1.1 Research Problem
This thesis considers the overall level of population growth in seven cities of Central Java, namely Semarang, Salatiga, Tegal, Magelang, Surakarta, Yogyakarta and Pekalongan. During the decade 1961-1971, these cities experienced low growth rates compared to Jakarta, the capital city of Indonesia. In this decade Jakarta"s population grew at 4.6% per annum (McNicoll et al,1973:47) while that of the seven cities grew much more slowly (Table 1.1). The rates of population growth for the seven cities differ from one another quite substantially (indicated by this table) and the factors contributing to these differences form a research problem of as much interest and importance as their overall low rate of growth when compared to Jakarta. Therefore, the main focus of this research will be to explain the variations in population growth of the seven cities in terms of the demographic components of growth.
Table 1.1
Some Characteristics of the Seven Cities
CHARACTER ISTICS
SEM SAL TEG MAG SUR YOG PEK
Pop. :
(1).1961 503153 58135 89016 96454 367626 312648 102380 (2).1971 641795 69668 105481 109938 413077 340908 110865 % rate
of growth* 2.5 1.8 1.7 1.3 1.2 .9 .8
Density:*)
(3).1961 5062 3844 7026 5323 8478 9265 5966
(4) .1971 6457 4608 8325 6067 9527 10101 6461
(7).Number industries:
of
(5).M size 303 12 136 74 887 629 391
(6).L size 126 2 20 8 101 54 22
Number of
univ.: 2 1 - - 3 6
-(8) Site Coastal Upland Coastal Upland Lowland Lowland Coastal
port non-port non-port
Source: (1),(3),(5),(6),(7) Milone:1966
(2) Central Bureau of Statistics, 1971 Census, Series E (4) Subset, 1971 Census
(8) Withington:1963 Note : * annual, geometric
Despite this, the absence of boundary changes may still be important in explaining low growth rates as some of these cities may well have experienced suburbanization outside the official boundary. For example, in Yogyakarta, many government employees have moved out of congested areas in the city centre to new housing estates outside the city boundary.
The seven cities are the only cities in Central Java having municipal status. To gain this status, a city must fulfil two main criteria. Namely, they must have a population of at least 50,000 and be a capital of either a province, residency or regency (Milone, 1966:65). Furthermore, cities designated as municipalities are functionally more important than the other cities in the sense of their role in regional development planning. Out of the seven cities, Semarang, Yogyakarta, Surakarta and Magelang are planned to become secondary growth poles after the primary centres; which are Medan, Jakarta, Surabaya and Ujung Pandang (Sugijanto et al,1976:77). A secondary growth pole is a center for stimulating development at a regional level.
1.2 Predominant Character-istics of the Seven Cities
In historic time, these physical characteristics played an important role in population growth.
In 1971, the seven cities ranged in size from 69,668 people in Salatiga, to 641,795 people in Semarang, which is the capital city of the province of Central Java. In addition to this
administrative function, the city of Semarang is both capital of the regency and the residency of Semarang. Also, Semarang, in 1971, was the fourth largest city in Indonesia after Jakarta (4,576,009), Surabaya(l,332,249) and Bandung(1,201,730). Semarang has a higher rate of growth than Bandung(2.1%), and a rate .3% lower than Surabaya. 1) However this comparison may be somewhat misleading as the population growth in the areas surrounding Bandung and Surabaya would have been greater than in the areas around Semarang.
Semarang not only has the largest population among the seven cities, but it also has the largest city area (99.40 sq.Km) and the most large-scale industry. The population density of Semarang is therefore lower than that of Surakarta or Yogyakarta, which have city areas of only 43.36 and 33.75 sq.Km., respectively. Among the cities located in the coastal areas only Semarang maintains its status as a city port. Pekalongan is no longer a city port because of silting of the rivers and the increasing size of ships. In terms of higher education functions, one of the existing universities in Semarang, Diponegoro University, has attracted students from all over Indonesia.
1) The 1961-1971 rate of growth for Surabaya of 2.8 per cent refers to the growth rate based on the 1961 boundaries of Surabaya. In fact, between 1961 and 1971, the boundary of Surabaya was extended to take account of the expansion of the
Although Salatiga is the smallest city, its rate of growth is second to that of Semarang. The population density though, and the number of industries for this city are the lowest. Satyawacana University, a privately owned religious university, is located here. The higher proportion of Christians (10%) in this city may be closely related to its being a Protestant educational centre.
Surakarta and Yogyakarta are the second and third largest cities. Like Semarang, Yogyakarta is a provincial capital, being the capital of the Yogyakarta Special Region, which is at the same level as a province. The two cities, Yogyakarta and Surakarta have some similarities. Both are former court cities, located in a central position on a fertile agricultural plain. In addition to this, the "batik" industry with its research centre and silverwork handicrafts make Yogyakarta and Surakarta the outstanding centres of Javanese culture and art. The designation of Yogyakarta as a student city is due to the great number of higher educational institutions which exist in this city. Gadjah Mada University is one of the oldest, largest and most highly regarded universities in Indonesia, and is in fact the main stimulus for the extension of these institutions. The Academy of Art and Music reflects Yogyakarta"s role as a centre of Javanese culture.
existence of a school for fishermen in Tegal is closely related
to the presence of this natural resource. The existence of a
military academy in Magelang, has meant that this city has become a garrison city.
Map 1.1 does not only show the distribution of the seven
cities, but also indicates that Tegal, Pekalongan, Semarang,
Surakarta and Yogyakarta are situated on the railroad connecting
Jakarta and Surabaya. Therefore, they can act as alternative
centres of attraction for people moving to the largest cities if the regional planning development mentioned above is realized.
As a rule, population growth of an area is positively
related to the processes of social and economic development in
the area. Therefore, we may expect higher growth rates for
cities having, for example, more industries and schools than
those cities having fewer or no such components of growth. 1)
This relationship is easily identified in some cities, generally
those located outside of Java. Extractive industries, such as
petroleum and timber have led Pakanbaru and Samarinda to grow in the decade of the 1960s at the very high rates of 7.4% and 7.0%
per annum, respectively (McNicoll et al,1973:47). For the seven
cities, as briefly shown in Table 1.1 or as evidenced by other
characteristics, the above expectation is not easily identified.
The relationship between population growth and demographic
processes is more easily identified than that with the
socioeconomic processes.
1) It should be realized, however, that this is not necessarily
always the case. As the declining textile towns of New England
testify, it is not the number of industries or schools in a city
that determine its growth rate, but rather the prospects for
future industrial and educational development. However, in the
1.3 The Approach
The explanation of the variation in population growth for the seven cities in terms of demographic components of growth will be preceded by a discussion and evaluation of the age distribution of the population of each city. For this purpose the subset of the 1971 Census becomes the main source of data because the 1961 Census only provides data on the total population for each city. It is worth noting that the subset is a special tabulation run of the 1971 Population Census of Indonesia which covered 3.8 per cent of the total population of Indonesia (Cho, 1976:78). According to the availability of data, it is expected that cities showing higher rates of growth will have younger age distributions than those showing lower rates of growth. Besides, the age distributions may provide some insight into the interaction of demographic processes during the past decades.
as a means of evaluating the results.
To simplify the analysis, the seven cities will sometimes be
divided into four groups; they are firstly Semarang, secondly
Salatiga and Tegal, thirdly Magelang and Surakarta, and lastly
Yogyakarta and Pekalongan. The grouping is based on the observed
pace of population growth; cities having about the same rate
CHAPTER 2
AGE DISTRIBUTION
2.1 The Importance of Age Distribution
The study of population growth in terms of the demographic components of growth, births, deaths and migration, generally requires vital statistics and statistics on migration. In the absence of these statistics, the age distribution of a population plays an important role as it is useful for tracing back or for forecasting the components of growth so that the pace of growth can be explained. However, the contribution of each component in fixing the observed rate of growth will not be known precisely. In this thesis, the age distribution of the population is important because vital statistics are not available. As age data are only available from the subset of the 1971 Census, these data are used for tracing back the components of growth in line with the purpose of the study of population growth during the decade 1961-1971.
cannot always be attributed to fluctuations in the number of births, deaths and migration changes in the population but can also be attributed to errors in age reporting as well as errors of coverage. It is important, therefore, to consider the accuracy of the recorded age data.
The explanation that the age distribution is important for forecasting the components of growth is basically biological, and the biological potential for influencing the pace of growth varies according to age. In terms of births, only women in the
age range of about 15-49 are exposed to the risk of pregnancy; in terms of deaths, the risk of dying starts high at birth, falls rapidly to a minimum at about age 10 and thereafter increases throughout life (Pollard et a l ,1975:59-76). In terms of migrations, people at late adolescent and young adult ages are more exposed to the risk of migrating than the other ages as evidenced by the fact that in both internal and external migrations these age groups are usually preponderant. Although these people are often migrating to their first job, they adjust themselves more easily to their new environment than people in other age groups (Clarke,1965:124). Accordingly, a population having larger proportions in the childbearing and low-mortality ages tends to grow faster than one having smaller proportions of people in these categories. This natural growth is then either impeded or accelerated by the loss or gain of population through net migration to produce overall growth.
Ideally, of course, data on age distributions for subsequent points of time are available. This would mean that contributions of births, deaths and migrations would be more easily inferred from the changes of age distribution. The most detailed manner of analysis would be to examine changes in numbers of persons by single years of age, however, there are two major problems with that approach. First, for a large data set (one hundred separate age intervals, for example) it is difficult to detect major trends, and second, the possibility of errors is great. Instead, analysis is usually based on grouped age data.
Ways used in the examination of age distribution for tracing back or for forecasting the components of population growth are usually in the form of a table or a pyramid which group the age data, or in the form of an index, whether a median age or a dependecy ratio.
2.2 The Reliability of Age Data
compared to those of the urban population of all Indonesia, the table indicates that in the seven cities the indices for females are generally higher, whereas those for males are generally lower than for the Indonesian urban population as a whole.
In addition to the large number of people who reported their ages ending in digits 0 and 5, the 1971 Census for the whole of Indonesia indicates a comparatively large number of people who reported their ages with terminal digits 1 and 6. This unusual feature proved to be a result of the rounding of year of birth to calendar years ending in 0 and 5 (McDonald, et al.1976:13).
Table 2.1
Deviation of Per Cent Blended Population From Ten
by Terminal Digit in the Seven Cities of Central Java and Indonesia,1971
CITY T e r m i n a l d i g i t
5 6 7 8 9 0 1 2 3 4 Sum*
SEM
M 3.5 -1.3 -2.1 - .0 - .9 5.8 - .7 - .4 -1.4 -2.4 18.6 F 6.3 -1.6 -2.1 - .5 -1.8 8.1 -1.8 -1.6 -2.1 -2.8 28.8 SAL
M 3.5 -1.2 -1.8 -3.3 -2.1 6.7 - .1 - .7 -1.4 -2.7 20.4 F 5.5 .0 -1.6 .8 -1.5 5.9 -1.3 -2.5 -2.1 -3.2 24.5 TEG
M 5.9 -3.1 - .4 - .6 - .9 8.4 -2.4 -1.7 -2.1 -3.1 28.7 F 9.6 -2.1 -1.6 - .4 -3.6 12.6 -4.3 -1.7 -4.6 -4.0 44.4 MAG
M 4.5 - .4 -1.9 -1.2 - .7 3.9 .2 -1.7 -1.0 -1.7 17.4 F 5.1 -1.9 -2.1 .2 - .9 9.5 -3.3 .7 -3.2 -4.0 30-9 SUR
M 3.7 -1.3 -1.0 - .1 -1.6 5.5 -1.4 -1.0 -1.0 -1.9 18.5 F 4.3 -1.8 - .3 - .0 -2.1 7.7 -1.9 -1.6 -2.1 -2.2 24.1 YOG
M 3.5 -1.9 -1.1 .3 -1.1 5.6 -1.1 - .3 -1.8 -2.2 19.0 F 6.1 -1.2 -1.2 .2 -2.0 8.6 -2.5 -2.4 -2.1 -3.5 29.8 PER
Table 2.1 cont. IND*)
M 4.7 -1.1 -1.1 .0 -1.3 5.6 - .9 -1.1 -2.4 -2.6 20.7
F 5.9 -1.0 -1.4 - .1 -2.0 7.4 -1.6 -1.9 -2.4 -2.9 26.7
Source: Subset, 1971 Census
*) Central Bureau of Statistics, 1971 Census, Series E
Note : * of absulute deviations; M=males; F=females
A method (United Nations, 1952:23) developed by the United
Nations Secretariat is used to check the accuracy of age data
after being grouped into 5-year age intervals. This method is
based on the assumption that the sex ratios and the numbers in
each age group should change smoothly with increasing age and it
attempts to measure the differences which occur from a steady
trend. The indices are called the sex ratio score, the age ratio
score, and the joint score as the combination of the first two
scores. However, when the United Nations approach is applied to
areas such as a city, it is important to remember that observed
distortions in the age-sex structure may not be due to
inaccuracies but rather to the impact of migration.
Table 2.2 indicates that the differences of each score among
the cities are substantial. Compared to the score for urban
Indonesia, most of the seven cities have much higher scores
Those cities having scores of less than that of the average, are Surakarta for the sex ratio score, Surakarta and Semarang for the
male age ratio score, Salatiga and Semarang for the female age
Age mis-statements can also be examined using population pyramids, because irregularities can reflect faults in the data. If this is the case, for the seven cities, only Semarang"s population distribution has no marked irregularities (Figure 2.1). Besides mis-statements of age, the 1971 Census of Indonesia indicates an underenumeration, especially of those aged 0 (McNicoll et al,1973:7) . The smaller proportion of population aged 0-4 than those aged 5-9 indicated by the population pyramid for Yogyakarta, may be due to the underenumeration of children under 1 year of age.
2.3 Differences in Age Distribution
As has been stated earlier, the age distribution of a population influences its growth; it is therefore expected that differences in population growth will be reflected in differences of age distribution. Figure 2.1 as well as Table 2.3 indicate that the populations in the seven cities of Central Java in 1971 were heavily weighted in the young age group of 0-14. The table also indicates the same phenomenon for Jakarta. Consequently, a great potential for growth during 1961-1971 was expected to be observed. Actually the table indicates substantial growth only for Jakarta and Semarang, moderate growth for Salatiga and Tegal, and low growth for the rest of the cities.
age-pyramid (Figure 2.1) shows that the students are concentrated in the age range of 15-24 years old.
Table 2.2
Scores for Age and Sex Ratios for Quinquennial Groups for the Seven Cities in Central Java and Indonesia,1971
Scores SEM SAL TEG MAG SUR YOG PEK IND.*)
Sex ratio 9.8 20.5 17.3 15.4 6.9 12.4 18.3 7.8
Age ratio:
Male 5.8 15.8 16.7 10.9 6.1 10.4 12.5 7.4
Female 6.2 11.3 12.0 17.4 12.0 12.2 27.4 11.4
Joint score 41.4 88.7 80.7 74.4 38.9 59.9 94.8 42.2
Source: Subset, 1971 Census
:*) Central Bureau of Statistics, Note :*) Indonesia urban
Table 2.3
Percentage of Population in Various Age Groups, Median Age and Dependency Ratio (1971), and Population Growth Rates (1961-1971) for the Seven Cities and Jakarta
CHARACTER ISTICS A G E
SEM SAL TEG MAG SUR YOG PER JAR*)
0-14 39.7 40.6 39.8 39.3 37.9 35.5 37.9 43.0
15-34 33.2 31.4 33.4 31.4 32.5 37.7 32.5 37.2
35-59 22.8 23.0 22.8 23.5 23.4 21.0 25.4 17.1
60 + 4.3 5.1 4.0 5.8 6.3 5.7 4.2 2.6
Total 100.0 100.0 100.0 100.0 100.0 100.0 100.0 100.0 Med. age 19.8 18.8 19.0 19.6 20.0 20.2 20.3 18.1 Dep. ratio 79.0 84.0 78.0 82.0 79.0 70.0 73.0 84.0
Rate of gr. 2.5 1.8 1.7 1.3 1.2 .9 .8 4.6
Source: Subset, 1971 Census
:*) Central Bureau of Statistics, 1971 Census, Series E Note :Med.=median; Dep.=dependency; gr.=growth; JAK=Jakarta
Looking at the sex ratios of age group 15-24 for the seven cities, the pyramid indicates that for Tegal, Magelang and Yogyakarta, there are more males than females in this age group. It is likely that for" Tegal and Magelang, this phenomenon is related to schools which are only available for males; they are, the School for Fishermen in Tegal and the Military Academy in Magelang. As for Yogyakarta, the high sex ratio (128 males per 100 females) in age group 20-24 may reflect priority for boys over girls for furthering education to the university level. Greater emphasis on higher education for males compared to
Census as still attending school.
The lower proportion of population in the age group 0-14 in Yogyakarta compared to the other cities in Central Java may indicate a lower crude birth rate here compared to those in the other cities. This conclusion is supported by the lower crude birth rate in Yogyakarta Special Region than in Central Java province during the decade 1960-1970; these rates being 37 per 1000 and 42 per 1000, respectively (McNicoll et al,1973:45).
In terms of the proportion of the population aged 0-14, the seven cities" populations are older than the population of Jakarta because these proportions are lower. This suggests that the population growth rate of Jakarta is higher than the overall population growth rate in the seven cities, which is indeed the case. For the seven cities, this phenomenon, that is the relationship between the proportion aged 0-14 and growth, applies in the expected direction for all cities except Semarang and Pekalongan. If the age distribution of each city is measured by the median age, instead of proportion of population aged 0-14, the relation between age distribution and growth is mostly confirmed, the only exception being Semarang, where migration may serve to inflate the numbers in the working ages.
relationship is inverse, as high dependency ratio is a hindrance to economic development. The non-productive population in Table 2.3 are indicated by those in the age groups 0-14 and 60+, whereas the productive population are those in the age range 15-59. The table shows that Jakarta has a higher dependency ratio than all the cities in Central Java.
2.4 Conclusion
figure 2.1
A g e - S e x D i s t r i b u r i o n
o f t u e c i t i e s
75-79
*
70-74
~k*
65-69
**
60-64
k k***
55-59
k k k****
50-54
*****
*****
45-49
k k k k k km a l e*******
40-44
******* f e m a l e
********
35-39
*********
*-*•****•*■*
30-34
*********
*******
25-29
**********
* *********
20-24
************
k
*-Jr *** * ** * * * *
15-19
**************
* * ** * * * ** * * *
-k* * *
10-14
***************
****************
5- 9
*****************
******************
0- 4
******************
S e m a r a n g
85-99
80-84
*
75-79
*
*
70-74
**
*
65-69
**
**
60-64
**
***
55-59
*-***
*****
50-54
****
*****
45-49
******
m a l e ********
40-44
*******
fem a l e
*******
35-39
**********
*******
30-34
*********
******
25-29
********
*********
20-24
*********
***************
15-19
****************
*****************
10-14
****************
****************
5- 9
*****************
******************
0- 4
************** * * *
S a l a t i g a
85-99
- -
80-84
75-79
k
70-74
k*
65-69
* •* *
60-64
* ** * *
55-59
* * * ** * * * * s/l 0 1 4> * * * * * * * * * * *
45-49
* * * * *m a le *******
40-44
******** i e m a l e
* * * * * * *
35-39
* * * * * * * * * * * * * * *30-34
* * * * * * * ** * * * * * * *
2 5 -2 9 ’
* * * * * * * * ** * * * * * * * * * * *
20-24
* * * * * * * * ** * * * * * * * * * * * * * * * *
15-19
* * * * * * * * * * * * * * * * * * * * * * * * * * * * * * * * *10-14
* * * * * * * * * * * * * * * ** * * * * * * * * * * * * * *
5- 9
* * * * * * * * * * * * * ** * * * * * * * * * * * * * * * * * *
0- 4
* * * * * * * * * * * * * * * * * * *2^ * kk * * kkk ***** *******
j^j_0 *********
********
* * * * * * * *
* * * * * * * *
k k k k k k k k k
k k k k k k k k k k k k k k k
kkkk k k k k k k k k k k k
k k k k k k k k k k k k k k k k k k k k k k k k k k k kkk
8 5 - 9 9
8 0 - 8 4 k
7 5 - 7 9 k
7 0 - 7 4 kk
6 5 - 6 9 kk
6 0 - 6 4 kkkk
5 5 - 5 9 kk
O 1 '•V
'
-O kkkk
4 5 - 4 9 * * * * *
4 0 - 4 4 k kk k k k k female
3 5 - 3 9 k k k k k kk kk
3 0 - 3 4 * * * * * * * *
2 5 - 2 9 k k k k k kk kk
2 0 - 2 4 k k k kk kk k
1 5 - 1 9 k k k k k k k k k k k k k k
1 0 - 1 4 k k k k k k k k k k k k k k k k
5 - 9 k k k k k k k k k k k k k k k k
0 - 4 k k k k k k k k k k k k k k k k k
magelang
8 5 - 9 9 k
8 0 - 8 4 k
7 5 - 7 9 'k
k 7 0 - 7 4 kk
kk 6 5 - 6 9 kk
kk 6 0 - 6 4 kkk
kkkk 5 5 - 5 9 kkkk
kkkkk 5 0 - 5 4 kkkkkk
kkkkk
*** a.1
e ^*****
4 5 - 4 9 4 0 - 4 4
kkkkkk
k kk kkkkk
1 e m a le
k k k kk kk 3 5 - 3 9 kkkkkkkk
kkkkkk CO o
l
kkkkkkkkk kkkkkk 2 5 - 2 9 kkkkkkkk
k k k k k k k k k k 2 0 - 2 4 k kk kk k k k k k k
k k k k k k k k k k k k k k 1 5 - 1 9
k k k k k k k k k k k k k k k k 1 0 - 1 4 k kk k k k k k k k k k k k k k
k k k k k k k k k k k k k k k k 5 - 9 k kk kk kk k k k k k k k k
k k k k k k k k k k k k k k k k Q— 4 k kk kk kk k k k k k k k k k
S u r a k a r t a
8 5 - 9 9 8 5 - 9 9
3 0 - 8 4 * 8 0 - 8 4
7 5 - 7 9 7 5 - 7 9
k 7 0 - 7 4 k k k 7 0 - 7 4 *
* 6 5 - 6 9 k k k 6 5 - 6 9 *
k k k 6 0 —6 4 k k k k k 6 0 - 6 4 k k k
k k k 5 5 - 5 9 k k k k k k 5 5 - 5 9 k k k
k k k k 5 0 - 5 4 k k k k k k k k k k 5 0 - 5 4 * * * * *
k k k k k 4 5 - 4 9 k k k k k k k k k k k k 4 5 - 4 9 * * * * * *
m a l e * * * * * * 4 0 - 4 4 k k k k k k k f e m a l e m a l e * * * * * * * * 4 0 - 4 4 * * * * * * * * f e m a l e
k k k k k k 3 5 - 3 9 k k k k k k k k * * * * * * * * * 3 5 - 3 9 * * * * * * * * * * * k k k k k k k 3 0 - 3 4 k k k k k k k * * * * * * * * 3 0 - 3 4 * * * * * * * * * *
k k k k k k k k k 2 5 - 2 9 k k k k k k k k * * * * * * * * 2 5 - 2 9 * * * * * * * *
k k k k k k k k k k k k k 2 0 - 2 4 k k k k k k k k k k k k * * * * * * * * * 2 0 - 2 4 * * * * * * * * *
k k k k k k k k k k k k k 1 5 - 1 9 k k k k k k k k k k k k k k k k k * * * * * * * * * * * * * * 1 5 - 1 9 * * * * * * * * * * * * * * *
k k k k k k k k k k k k k 1 0 - 1 4 k k k k k k k k k k k k k k k * * * * * * * * * * * * * * * 1 0 - 1 4 * * * * * * * * * * * * * k k k k k k k k k k k k k 5 - 9 k k k k k k k k k k k k k k k * * * * * * * * * * * * * * * * 5 - 9 * * * * * * * * * * * * * * * * * k k k k k k k k k k k k k 0 - 4 k k k k k k k k k k k k k k * * * * * * * * * * * * * * * * * 0 - 4 * * * * * * * * * * * * * * * * *
logy ak arta Pekalongan
CHAPTER 3
FERTILITY AND MORTALITY
3.1 Fertility
Before discussing measures of fertility, age at first marriage is regarded worth discussing as it may indirectly affect population growth through its effect on fertilty.
3.1.1 Age at First Marriage
In general, age specific fertility is a result of age at marriage, proportions married and intervals between marriage and first birth and subsequent births. Accordingly, higher fertility rates tend to be associated with earlier marriage, higher proportions marrying and shorter intervals between marriage and first birth and successive births. Due to the unavailability of data, only the first factor among these influencing components of fertility will be identified. That is, examination will be made of whether cities indicating lower ages at first marriage are those indicating higher fertility. This matter will be discussed below but firstly this section discusses some possible factors leading to differences of age at first marriage.
the seven cities in particular (Table 3.1) and for urban Indonesia in general (77%) in comparison with all of Indonesia.
Educational attainment for a child attending school until age 16 would be junior high school and for age 19 senior high school. These levels of education are therefore regarded as desirable instead of primary school education for those who are still single in the age range 15-19. Therefore, even before the promulgation in 1974 of the new marriage law, which fixed the ages at first marriage at 16 and 19 for a girl and boy respectively, there were indications of an increasing age at first marriage. This trend coincides with increased education aspirations for both sexes (Hull,1975:200), reflected in the dramatic rise in levels of education among 15-19 year olds.
Table 3.1
Percentage of Women Single by Age Group and Singulate Mean Age at Marriage for the Seven Cities in Central Java, 1971
Percentage of women single
AGE SEM SAL TEG MAG SUR YOG PER
15-19 81 88 76 83 87 93 81
20-24 44 44 33 49 46 64 35
25-29 14 11 15 9 15 22 14
30-34 6 4 7 4 7 9 4
35-39 4 2 3 2 4 4 2
40-44 3 2 1 1 2 3 1
45-49 1 2 - 3 3 2 2
SMAM 22.1 21.9 21.7 22.0 22.7 24.5 21.1
Source:Subset, 1971 Census
Note:SMAM=Singulate Mean Age at Marriage
Table 3.2
Percentages of Single Women Aged 15-19 Attaining Primary School Plus and Percentages of Population Who Are Moslem, for the Seven Cities in Central Java,1971
CHARACTER ISTICS
SEM SAL TEG MAG SUR YOG PER
Single women aged 15-19 with PS+
85 89 83 87 90 94 86
Moslem 81 78 91 82 79 83 93
population
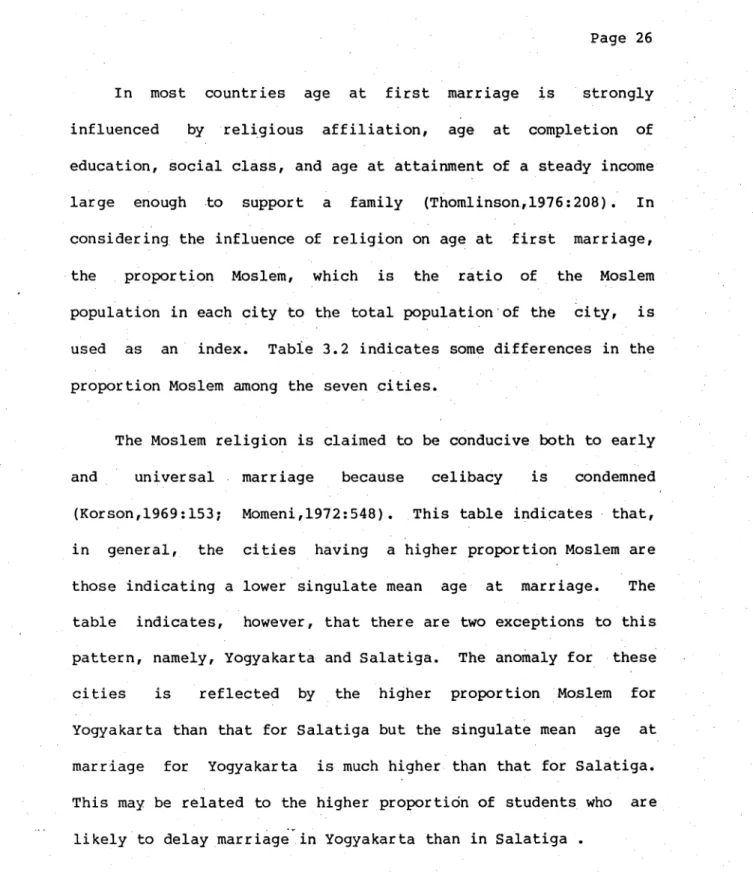
In most countries age at first marriage is strongly influenced by religious affiliation, age at completion of education, social class, and age at attainment of a steady income large enough to support a family (Thomlinson,1976:208). In considering the influence of religion on age at first marriage, the proportion Moslem, which is the ratio of the Moslem population in each city to the total population of the city, is used as an index. Table 3.2 indicates some differences in the proportion Moslem among the seven cities.
The Moslem religion is claimed to be conducive both to early and universal marriage because celibacy is condemned (Korson,1969:153; Momeni,1972:548). This table indicates that, in general, the cities having a higher proportion Moslem are those indicating a lower singulate mean age at marriage. The table indicates, however, that there are two exceptions to this pattern, namely, Yogyakarta and Salatiga. The anomaly for these cities is reflected by the higher proportion Moslem for Yogyakarta than that for Salatiga but the singulate mean age at marriage for Yogyakarta is much higher than that for Salatiga. This may be related to the higher proportion of students who are likely to delay marriage in Yogyakarta than in Salatiga .
Table 3.3
Percentage of Single Women
in Selected Age Groups and Years in Java
YEAR
A g e
15-19 20-24 25-29
1963 49.6 11.2 3.3
1964 50.4 8.9 2.5
1967 54.2 12.3 2.9
1969 57.9 14.2 2.8
1971 56.0 14.5 3.5
1976 59.2 -
-Source: McNicoll, et al. 1973:Table 7 McDonald, 1978:Table 1
Table 3.4
Percentages of Single Women Aged 15-19 for
Provinces of Java in Selected Series of Population Surveys
PROVINCE 1971 CENSUS 1973 FM SURVEY 1976 SUPAS
Jakarta 68.5 - 73.7
West Java 47.0 55.3 44.8
Central Java 60.1 65.4
Central Java 75.0
Yogyakarta 85.4 86.0
East Java 55.0 62.8 59.6
Source: McDonald, 1978:Table 1
who have never attended school. As the table indicates an increasing proportion of women with no schooling as age increases, the existence of increasing educational attainment by women is confirmed. It is not clear whether the variation in trends between cities is due to differences in educational facilities or to regional differences in the social demand for education.
Indirect evidence supporting the finding of an upward trend in age at first marriage in the cities of Central Java is shown by Table 3.6. Comparing the first three periods of time shown in this table, all the seven cities of Central Java indicate a downward trend of fertility in age group 15-19. If this trend means a decrease in the proportion of women entering into married life at ages less than 20, a delay of marriage would be the explanation. However, this trend might also be interpreted as a delay of first births. If this was the case, it is unlikely to have been due to the success of the Family Planning Program, because the program only started in 1970. Since having a child as soon as possible after marriage is still the norm, it is almost certain that there was a delay in age at first marriage rather than a delay in first births. This norm is reflected in a study on the value of children in Java that showed only 32% of the Javanese respondents approved of usage of family planning to delay the first birth (Singarimbun et al,1977:14).
Table 3.5
Percentage of Women with No Schooling
by Agef for the Seven Cities in Central Java,1971
AGE SEM SAL TEG MAG SUR YOG PEK
15-19 10 7 12 4 9 4 12
20-24 14 10 11 8 10 6 11
25-29 26 17 23 18 21 14 31
30-34 44 37 47 27 41 34 55
35-39 53 47 59 43 48 42 59
40-44 58 52 59 48 57 44 71
45-49 64 63 62 57 61 56 77
Source: Subset, 1971 Census
Table 3.6 Trend of Fertility Rates at for the Seven Cities in Central
Ages Java,
15-19 1961-1970
PERIOD SEM SAL TEG MAG SUR YOG PEK
1961-"63 102 115 136 118 97 65 128
1964-"66 88 72 108 135 84 56 115
1967-"70 79 55 103 49 64 27 95
Source: Cho, 1976:Table 2.2
Yogyakarta and Pekalongan, while Magelang and Surakarta show a medium level difference. This suggests that for the seven cities in Central Java, there is no relationship between age at first marriage and population growth.
3.1.2 Measures of Fertility
Three kinds of fertility measure will be discussed in this thesis. They are, children ever born to women, the total fertility rate, and the crude birth rate. The first one is derived from the 1971 Census (subset) data on children ever born to ever married women, the second one was estimated by Cho (1976) using the "own children" method, the data of own children being derived from the 1971 Census. Finally the crude birth rates are derived from the age specific fertility rates of the second measure and the city age distributions from 1971 Census (subset).
According to Table 3.7, the mean number of children ever born to ever married women in all the cities increases steadily up to age group 35-39, except in Yogyakarta where it continues to increase up to age group 40-44. For most cities, therefore, the mean number of children ever born falls at age groups of 40-44 and 45-49. It is unlikely that all of this decline is real; it is more likely to be caused in part by "recall lapse", the fact that women are more inclined to omit births which occurred a long time in the past. Furthermore, it may also be due to interviewers forgetting to ask widows and divorcees about their children ever born. However, the impact of low fertility rates during the revolutionary years of 1940s may also account for some of the decline.
The table indicates that Tegal and Pekalongan have relatively the highest fertility rates for women in the age range 15-39 compared to the other cities. The higher fertility rates in Tegal and Pekalongan are also evident from the higher mean number of children ever born from ages 25 and over. As the singulate mean ages at marriage for these cities are the lowest, the higher fertility in Tegal and Pekalongan may be related to younger ages at first marriage.
Table 3.7
Mean Number of Children Ever Born Born to Ever Married Women of the Seven Cities in Central Java, by Age, 1971
AGE SEM SAL TEG MAG SUR YOG PEK
15-19 .6 .7 .8 .6 .5 .5 .6
20-24 1.3 1.3 1.6 1.5 1.4 1.3 1.4
25-29 2.5 2.5 3.1 3.0 2.6 2.5 2.8
30-34 3.5 3.7 4.4 3.6 3.5 3.5 4.0
35-39 4.0 4.7 5.2 4.7 4.3 4.5 5.0
40-44 3.8 4.6 4.9 4.7 4.1 4.9 4.7
45-49 3.9 4.2 4.8 4.1 3.7 4.5 4.6
15-39 2.8 3.2 3.4 3.3 2.9 3.0 3.4
Source: Subset, 1971 Census
Table 3.8
Average Age Specific Fertility Rates and Total Fertility Rates During 1961-1970 for the Seven Cities of Central Java
AGE SEM SAL TEG MAG SUR YOG PEK
15-19 89 78 115 95 80 47 111
20-24 216 215 223 251 228 196 214
25-29 231 232 227 263 234 237 191
30-34 178 198 159 217 181 201 150
35-39 102 119 96 113 99 120 89
40-44 36 36 38 28 38 42 30
45-49 5 11 10 3 8 13 6
TFR*) 4260 4390 4290 4835 4300 4215 3925
higher fertility indicated for this city by the children ever born data while the high fertility for Magelang based on the total fertility rate is less evident from the children ever born data. In general, the levels of fertility indicated by the children ever born data are higher than those based on the total fertility rates. The discrepancies between the levels of fertility in Tables 3.7 and 3.8 may be related to the different time periods to which the estimates apply or, alternatively, may reflect inaccuracy in one or the other set of estimates.
Looking at the more detailed fertility rates presented in this table, the age specific fertility rates in the age range 15-19 are highest for Tegal and Pekalongan. It is likely that this phenomenon is related to younger ages at first marriage. The younger age at first marriage for Pekalongan is also
supported when the age specific fertility rates for the age ranges 20-24 and 25-29 are compared. Except for Pekalongan, the age specific fertility rate for age group 25-29 is the highest age specific rate for all cities. However, for Pekalongan, the age specific fertility rate in the age range 20-24 is highest. On the other hand, the much lower age specific fertility rates in
the age range 15-24 for Yogyakarta are likely related to older age at first marriage.
be used in explaining the observed growth of the population during the intercensal decade of 1961-1971.
The estimated annual crude birth rates per thousand for the seven cities are as follows: Semarang (36) , Salatiga (33), Tegal (33) , Magelang (34) , Surakarta (33) , Yogyakarta (31), and Pekalongan (32). It is evident that Semarang, which experienced the highest rate of population growth during the 1960s, also had the highest crude birth rate among the seven cities. At the other end of the scale, Yogyakarta and Pekalongan which had the lowest rates of growth also had the lowest crude birth rates. It is interesting also to note the impact of differences in age distributions upon the crude birth rates. For example, although the total fertility rate for Magelang was somewhat higher than that for Semarang, the crude birth rate was higher in Semarang.
3.2 Mortality
The crude death rate is the mortality component of the rate of population growth. However, since death registration statistics are not available, this index has to be estimated using life table age specific death rates, M(X). To produce the life table, Brass" method (1975) , "West" model life tables
3.2.1 Estimation of Life Table
Table 3.9 shows the results of the Brass" method for estimating the proportions dying before the exact ages of 2, 3, and 5, respectively, for children born to women in successive age groups. Each of the Q(X) values are the result of the multiplication of the proportion dead (to the ever born) and the multiplying factor k using P(2) over P(3) as the parameter. This parameter is preferred to P(l) over P(2) because P(l) is sensitive to undercount of children ever born and children still living (Hull et al,1978:15). They presumed that the problem was more likely interviewers "not asking" the question than the women "not stating" the number of children ever born or still living. P(l), P(2) and P(3) denote the mean parity (number of children) per woman in the 15-19, 20-24 and 25-29 age groups, respectively.
Table 3.9
Estimates of Q (2), Q(3) and Q (5) Using Brass" Method
and "West" Level of Mortality, for the Seven Cities of Central Java,1971
CITY AND AGE SEM
NO. OF FEMALES
CEB CSL k Q(X) X WL AWL
20-24 31314 23610 21806 1.128 .0862 2 17.6
25-29 24641 53707 47216 1.054 .1274 3 15.5 15.5
30-34 SAL
24513 82525 67917 1.046 .1851 5 13.3
20-24 2492 1852 1632 1.139 .1353 2 14.5
25-29 2280 5110 4440 1.059 .1388 3 14.9 14.6
30-34 TEG
2541 9084 7702 1.049 .1596 5 14.5
20-24 3914 4155 3325 1.092 .2182 2 10.1
25-29 3762 9852 7496 1.038 .2482 3 9.7 10.0
30-34 MAG
3540 14273 10700 1.034 .2588 5 10.2
20-24 3521 2738 2394 1.177 .1478 2 13.7
25-29 3808 10361 9257 1.076 .1147 3 16.2 15.3
30-34 SUR
3513 12248 10727 1.060 .1317 5 15.9
20-24 17434 13526 12267 1.123 .1046 2 16.3
25-29 13334 29185 26009 1.052 .1145 3 16.2 15.8
Table 3.9 cont. YOG
20-24 16625 7572 6976 1.220 .0960 2 16.9
25-29 11331 22212 20246 1.095 .0969 3 17.3 16.7
30-34 9205 29051 25495 1.072 .1312 5 15.9
PEK
20-24 3946 3612 3246 2.311 .2341 2 9.4
25-29 3667 8935 7066 1.046 .2188 3 10.96 9.7
30-34 4662 17328 12354 1.040 .2985 5 8.6
Source: Subset,1971 Census (col.2,3,4) Brass,1975,Table 14 (col.5)
Note : CEB=children ever born; CSL=children still living WL="West" level; AWL=average "West" level
It is likely that the lower child mortality in Yogyakarta than in Pekalongan and Tegal reflects the differences in educational levels of these places. If the proportion of women with no schooling in the age group 15-19 to total women in the same age bracket is taken as an index of education, then for Yogyakarta this index is 4% compared to 12% for both Tegal and Pekalongan
(Table 3.5).
are obtained by substituting the estimated "a" into the logit system formula for X=10,15,20,... 80.
All the I(X) values are then used to estimate the
probability of dying between age X and X+l using the formula I(X+N)
Q (X) = 1 - ---I(X)
where n=5. Lastly, the other values in the life table shown in
Table III.1-III.7 can be derived from these Q(X) values. They
are:
(1) . The number dying at age X last birthday,
D (X) = Q (X) .1 (X)
(2) . The number living at age X last birthday,
L(X) = 2.5 I(X)+ 1 (X+5)
(3) . The central death rate at age X, D (X)
(4). The five-year survival ratio, L(X+5) S(X) = ---L(X)
(5). The total population aged X and over,
T(X) = cummulative sum of L(X)
(6). The expectation of life, T (X) E(X) = ---I(X)
3.2.2 Crude Death Rate
Applying the M(X) values from the life tables to the population of each city at successive age groups, the total number of deaths and the crude death rates are obtained. The estimated annual crude death rates per one thousand for the seven cities are as follows: Semarang (12), Salatiga (14), Tegal (21), Magelang (14), Surakarta (12), Yogyakarta (11), and Pekalongan (21) . It is clearly indicated that Tegal and Pekalongan experienced much higher death rates compared to the other cities.
The rates of natural increase and the possible explanation of the differences are discussed below in Chapter 5.
3.3 Conclusion
Standard Logit 1 - I(xs) for Males and females of the Seven Cities in Central Java
AGE MALES FEMALES
5 -.7420 -.8005
10 -.6821 -.7294
15 -.6531 -.7007
20 -.6209 -.6661
25 -.5816 -.6240
30 -.5364 -.5717
35 -.4810 -.5095
40 -.4108 -.4401
45 -.3252 -.3640
50 -.2177 -.2774
55 -.0858 -.1666
60 .0818 -.0054
65 .2837 .1940
70 .5310 .4423
75 .8395 .7425
80 1.2518 1.1306