This is a repository copy of Detecting and quantifying the contribution made by aircraft
emissions to ambient concentrations of nitrogen oxides in the vicinity of a large
international airport .
White Rose Research Online URL for this paper:
http://eprints.whiterose.ac.uk/2449/
Article:
Carslaw, D.C., Beevers, S.D., Ropkins, K. et al. (1 more author) (2006) Detecting and
quantifying the contribution made by aircraft emissions to ambient concentrations of
nitrogen oxides in the vicinity of a large international airport. Atmospheric Environment, 40
(28). pp. 5424-5434. ISSN 1352-2310
https://doi.org/10.1016/j.atmosenv.2006.04.062
[email protected] https://eprints.whiterose.ac.uk/ Reuse
See Attached
Takedown
If you consider content in White Rose Research Online to be in breach of UK law, please notify us by
White Rose Research Online
http://eprints.whiterose.ac.uk/
Institute of Transport Studies
University of Leeds
This is an author produced version of a paper published in Atmospheric
Environment. It has been uploaded with the permission of the publisher. This
paper has been peer reviewed but does not contain final publisher formatting or
journal pagination.
White Rose Repository URL for this paper:
http://eprints.whiterose.ac.uk/
2449/
Published paper
Detecting and quantifying the contribution made by aircraft emissions to ambient concentrations of
nitrogen oxides in the vicinity of a large international airport
David C Carslaw*1, Sean D Beevers2, Karl Ropkins1 and Margaret C Bell1
1
Institute for Transport Studies, University of Leeds, Leeds LS2 9JT, West Yorkshire, UK.
2
Environmental Research Group, King’s College London, 4th Floor, Franklin Wilkins Building, 150
Stamford Street, London SE1 9NN.
*corresponding author, e-mail [email protected].
Abstract
Plans to build a third runway at London Heathrow Airport (LHR) have been held back because of concerns
that the development would lead to annual mean concentrations of nitrogen dioxide (NO2) in excess of EU
Directives, which must be met by 2010. The dominant effect of other sources of NOX close to the airport,
primarily from road traffic, makes it difficult to detect and quantify the contribution made by the airport to
local NOX and NO2 concentrations. This work presents approaches that aim to detect and quantify the
airport contribution to NOX at a network of seven measurement sites close to the airport. Two principal
approaches are used. First, a graphical technique using bivariate polar plots that develops the idea of a
pollution rose is used to help discriminate between different source types. The sampling uncertainties
associated with the technique have been calculated through a randomised re-sampling approach. Second, the
unique pattern of aircraft activity at LHR enables data filtering techniques to be used to statistically verify
the presence of aircraft sources. It is shown that aircraft NOX sources can be detected to at least 2.7 km from
the airport, despite that the airport contribution is very small at that distance. Using these approaches,
estimates have been made of the airport contribution to long-term mean concentrations of NOX and NO2. At
the airport boundary we estimate that approximately 28 % (34 μg m-3) of the annual mean NOX is due to
airport operations. At background locations 2-3 km downwind of the airport we estimate that the upper limit
of the airport contribution to be less than 15 % (< 10 μg m-3). This work also provides approaches that
Key words: London, urban air quality, Heathrow Airport, aircraft emissions, source apportionment.
1. Introduction
1.1 Background
The aviation sector in the UK has grown five-fold in the past 30 years and is expected to increase by another
2-3 times by 2030 compared with current day estimates (DfT, 2003). In December 2003, the UK
Department for Transport (DfT) published the UK Government’s Aviation White Paper, setting out a
strategic framework for the development of UK aviation (DfT, 2003). Currently, the future development of
London Heathrow (LHR) is supported by the UK Government, including the building of a third runway, but
only if it can be shown that the development does not exceed EU Limit Values for ambient air pollution.
The White Paper also called for an urgent programme of work to tackle the air quality problems at Heathrow.
The principal concern is whether the annual mean nitrogen dioxide (NO2) limit of 40 μg m -3
, which must be
met by 2010 as part of the EU Daughter Directive (1999/30/EC), can be achieved. A third runway is seen as
essential for the economy also. The airport supports 100,000 jobs and a short third runway would yield net
economic benefits of some £6 billion (DfT, 2003). In the context of air pollution, the contribution made by
the airport and its operation to concentrations of NO2 and NOX is therefore of key importance. However, to
determine this impact, a detailed knowledge of the sources of NOX close to LHR is essential, together with
their contribution to measured concentrations, if current and future assessments of annual mean NO2
concentrations are to be reliable.
Comparatively little source apportionment work has been undertaken in the vicinity of airports to determine
the extent to which aircraft emissions affect local air quality. Yu et al. (2004) used a nonparametric
approach based on kernel smoothing to identify aircraft sources at Los Angeles International Airport (LAX)
and Hong Kong International Airport. Sulphur dioxide (SO2) was found to be a useful tracer of aircraft
emissions at both airports. This work usefully extended that of Henry et al. (2002), which only considered
concentrations by wind direction. The additional insight provided by incorporating wind speed into the
ground-level and elevated plumes. The analysis by Yu et al. (2004) additionally showed that CO and NOX
concentrations at LAX were dominated by road traffic sources. At Heathrow, the primary interest is NOX
and NO2, which presents a difficulty in quantifying due to the overwhelming influence of ground-level traffic
sources of NOX. Furthermore, no measurements of SO2 were available at the monitoring sites around
Heathrow.
This paper aims to develop methods to discriminate between road traffic and aircraft sources of NOX in air
pollution data sets. Of particular interest is whether aircraft emissions can be detected and the contribution
quantified in hourly data sets of NOX from routine monitoring sites in the vicinity of the airport. Because the
airport is situated within Greater London, it is embedded in a region of high emissions of NOX, which makes
the analysis of its impact on local NOX and NO2 concentrations problematic because of the confounding
influence of other sources of NOX.
2. Method
2.1 Description of site and data used
Heathrow Airport is situated within the Greater London Authority boundary in west London approximately
25 km from central London. In 2002 the airport was responsible for an estimated 4222 t yr-1 NOX, 4.9 % of
total NOX emissions in London (accounting for aircraft emissions up to 1 km). Heathrow Airport has two
runways: a northern and a southern runway separated by approximately 1.4 km. Heathrow operates a
‘runway alternation’ system of operation for noise mitigation reasons. During daytime westerly operations
(taking off and landing into the prevailing westerly wind), landing aircraft use one runway from 07:00 until
15:00 and switch to the parallel runway from 15:00 until 23:00. Runway operation also operates on weekly
basis so that communities in west London situated under the final approach tracks may benefit from
predictably quieter periods at certain times of the day. Heathrow also operates a 'westerly preference'. The
preference provides for westerly operations to continue when there is a light easterly following wind up to
5-knots (2.5 m s-1), if the runways are dry and any cross-wind does not exceed 12-knots. These features of
runway use at LHR provide an important and unique activity profile, which is very different to other major
aircraft contributions to measured NOX concentrations are detected. Data from National Air Traffic Services
(NATS), made available as part of the project, were used to provide information on runway alternation.
These data provided hourly information on the number of aircraft movements during each hour including:
runway used, whether the aircraft was arriving or departing and the direction of take off or landing. Later in
section 3.3, aircraft are classified as departing or arriving on the northern or southern runways for westerly
operation. For the vast majority of hours this classification is straightforward. For some hours (notably
around 3 pm) when runway use switches it is less straightforward. For these hours, a runway is assumed to
be used for taking off if there are more departures on it compared with the other runway.
There are several routine monitoring sites close to LHR that belong either to national, London or British
Airways Authority networks. More information and most data for these sites can be obtained from
www.heathrowairwatch.org.uk. A range of pollutants are measured at these sites, but the focus here is on
measurements of NOX and NO2, which are measured using the chemiluminescent technique. Data from
these sites undergoes quality assurance and control procedures consistent with that of the national network in
the UK (AQEG, 2004). In total there are eight monitoring sites within 2 km of the airport boundary. Table 1
summarises the data available from these sites together with their distances from the northern or southern
runway. Of principal importance is the LHR2 site situated 180 m north of the northern runway. This site is
a few metres within the airport boundary, close to the eastern end of the northern runway. The LHR2 site is
therefore ideally placed for considering airport sources when the wind is from a southerly or south-westerly
direction i.e. the prevailing wind direction. The airport boundary road is approximately 15-20 m north of
LHR2. With the exception of the Hillingdon site, most of the other sites are located either close to minor
roads or in background locations, as borne out by the measured NOX and NO2 concentrations, which are
typical of background concentration in London (Fuller, 2005). Note, that only one year of Harlington data
were available. Hourly meteorological data were obtained from the Met Office Heathrow site. These data
Table 1. NOX and NO2 monitoring sites used in the analysis.
Site Data period Distance to
northern runway (m)
Distance to southern runway (m)
Mean NOX
(μg m-3)
Mean NO2
(μg m-3)
LHR2 Jul. 2001-Dec. 2004 180 1600 127 55
Harlington Jan. 2004-Dec. 2004 1230 2670 71 38
Hounslow Jul.2001-Dec. 2004 1600 2580 65 36
Oaks Road Jul.2001-Dec. 2004 2070 650 67 34
Main Road Jul.2001-Dec. 2004 1060 550 81 39
Green Gates Jul.2001-Dec. 2004 370 1770 76 38
Slough Jul.2001-Dec. 2004 1390 2360 68 36
Hillingdon Jul.2001-Dec. 2004 2060 3460 120 48
2.2 Graphical analysis for source apportionment
Yu et al. (2004) showed how accounting for wind speed in addition to wind direction yielded information on
the types of source in the vicinity of a monitoring site. Here, a similar approach is used, with several
modifications. First, data were averaged into different wind speed (0-1, 1-2 m s-1…) and wind direction
(0-10, 10-20°…) categories (cells) and the mean concentration of NOX calculated. The choice of the cell size
affects the bivariate surface generated. An inappropriate cell size can lead to unnecessary imprecision: too
small a cell causes the plot to become excessively noisy due to a small sample size, and too large a cell leads
to an excessively coarse partition and a loss of information. Henry et al. (2002) and Yu et al. (2004) used a
nonparametric kernel smoothing technique to determine the optimum balance between a plot that is too noisy
or too coarse. The choice used here was in part determined by the meteorological data, which were provided
rounded to the nearest 10°. Section 2.3 considers the affect of cell sample size on the estimated error of the
mean concentration in a cell, which provides additional information on the most appropriate choice of cell
size. This process yielded a surface in Cartesian coordinates, which was then converted into polar
coordinates. Henry et al. (2002) did not favour converting to polar coordinates because data are compressed
close to the centre. However, it will be shown later that when data from several monitoring sites are
available, the polar coordinate system is a very effective one. The data were then interpolated using a
Kriging technique to produce a bivariate polar plot.
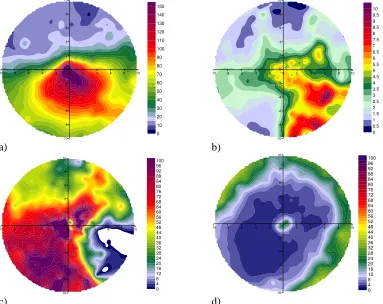
Fig. 1a shows an example of a NOX bivariate polar plot for a monitoring site located approximately 40 m
north of a motorway. There are several points that should be noted. First, the highest concentrations are
source to the south of the site. Second, as the wind speed increases from any direction, the concentration of
NOX decreases. This pattern of decrease is what would be expected from a ground level source where the
concentration takes the form of a function that is inversely proportional to the wind speed. Fig. 1b shows
the bivariate polar plot for SO2 at a monitoring site in east London, which is affected by industrial sources.
For SO2 there are three clear regions where a source has an influence (approximately 60, 120 and 160°).
Unlike Fig. 1a, the concentration of SO2 increases with increasing wind speed. In fact, a consideration of
potential sources highlights an oil refinery source at 12 km, a power station source at 6 km and other
industrial sources at 4 km.
Increases in concentration with wind speed are indicative of a buoyant plume from a source such as a
chimney stack, where the plume is brought down to ground-level when the wind speed increases. Note that
it is not the case that a high-level emission from a stack gives rise to the pattern shown in Fig. 1b, but the
presence of plume buoyancy. These features can be shown by considering the basic Gaussian plume
dispersion equation (see Seinfeld and Pandis, 1998). In the absence of plume rise, the ground-level
centreline concentration, c(x, 0, 0) is proportional to u−1, where u is the mean wind speed. In the presence
of plume buoyancy, c(x, 0, 0) is a function of ua, where a is a constant > 0, such that the lower the wind
speed, the greater the plume rise. As the wind speed increases for a buoyant plume the ground-level
concentration increases to a maximum and then decreases. These plots potentially provide an effective
graphical method of source discrimination between buoyant plumes such as those from power stations and
plumes with little or no buoyancy such as road traffic sources.
The bivariate polar plot approach has been applied to the LHR2 site. The availability of monitoring sites
around LHR (see Table 1 and Fig. 3) allows the subtraction of a background NOX concentration for certain
wind sectors. Fig. 1c shows the effect of subtracting the Oaks Road NOX from LHR2 on an hourly basis
with the purpose of highlighting the effect of airport sources of NOX from the south. The Figure shows the
presence of a large source of NOX south, which does not decrease in concentration as the wind speed
increases. Fig. 1c also shows that there is a sharp decrease in NOX concentration at about 150°. The angle
be detected from 110-150°. The reason for the sharp change at 150° is that aircraft take off in an easterly
direction (on the southern runway) for easterly wind conditions. Fig. 1c on its own does not provide
conclusive proof of the presence of an aircraft source. However, it does highlight a very different pattern
compared with a road source (Fig. 1a).
-10 -8 -6 -4 -2 0 2 4 6 8 10
-10 -8 -6 -4 -2 0 2 4 6 8 10 0 10 20 30 40 50 60 70 80 90 100 110 120 130 140 150 a)
-10 -8 -6 -4 -2 0 2 4 6 8 10
-10 -8 -6 -4 -2 0 2 4 6 8 10 0 0.5 1 1.5 2 2.5 3 3.5 4 4.5 5 5.5 6 6.5 7 7.5 8 8.5 9 9.5 10 b)
-10 -8 -6 -4 -2 0 2 4 6 8 10
-10 -8 -6 -4 -2 0 2 4 6 8 10 0 4 8 12 16 20 24 28 32 36 40 44 48 52 56 60 64 68 72 76 80 84 88 92 96 100 c)
-10 -8 -6 -4 -2 0 2 4 6 8 10
-10 -8 -6 -4 -2 0 2 4 6 8 10 0 4 8 12 16 20 24 28 32 36 40 44 48 52 56 60 64 68 72 76 80 84 88 92 96 100 d)
Fig. 1a) Bivariate polar plot for NOX (μg m-3) at the Hillingdon monitoring site located approximately 40 m
north of the M4 motorway, b) bivariate polar plot for SO2 (ppb) at the Thurrock background monitoring site
located close to areas of industrial activity c) bivariate polar plot for NOX (μg m -3
) at LHR2 with background
NOX concentrations subtracted from Oaks Road for 06:00-23:00 on an hourly basis, d) estimated error
surface (at 2σ) for (c) based on the re-sampling approach described in section 2.3. In each plot the wind
speed increases radially outwards towards the circumference to 10 m s-1.
2.3 Sources of uncertainty and estimation of errors
The pattern of concentration shown in Fig. 1c is influenced by many factors related to meteorology and
emissions. Furthermore, as shown by Yu et al. (2004), the choice of wind speed and direction interval size is
also a factor. However, the principal influence on the uncertainty associated with Fig. 1c is the number of
[image:9.595.58.441.161.465.2]only have a few data points; most notably those at high wind speeds (≥ 9 m s-1) with an easterly component.
As the sample size decreases in a cell, the representativeness of the mean concentration in that cell will
become more uncertain. Estimates of the sampling errors were made using a re-sampling technique. For
concentrations affected most by airport sources, a wind angle from 180-220° was considered. By
considering several wind direction sectors affected by the same dominant source together, enough data points
were available to test the effect of sample size on the mean concentration. Within each wind speed category
(e.g. from 1-2, 2-3 m s-1…) different sample sizes from 2 to 300 were randomly selected without replacement
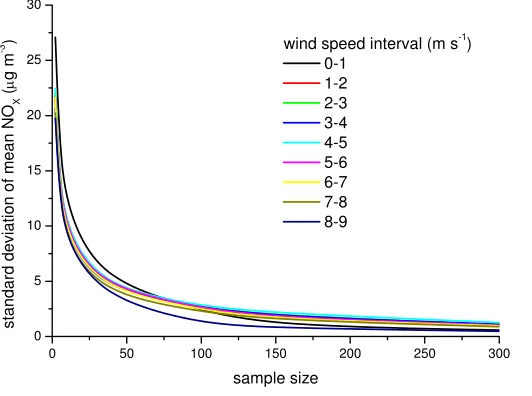
500 times. For each ensemble, the standard deviation of the mean was calculated. Fig. 2 shows the effect of
sample size on the error at LHR2. It shows that for cells with relatively few measurements the standard
deviation of the mean NOX concentration is high. For example, for a cell with only 10 measurements, the
standard deviation is approximately 10 μg m-3. The importance of the error does, however, depend on the
magnitude of the concentration due to a particular source. In the case of LHR2 in the direction of the
aircraft, the concentration is typically around 70-100 μg m-3, which is much larger than the sample error and
suggests that sample sizes smaller than 10 would be adequate to highlight the source. Nevertheless, the plot
shows that the error declines sharply as the number of measurement points in a cell increases.
The errors shown in Fig. 1d also depend on other factors. In the direction of the aircraft the concentration of
NOX varies little by wind speed. Furthermore, there was found to be very little variation in the sampling
error with wind speed for wind directions from the airport, as shown in Fig. 2. However, for a road source
(not shown), an increase in wind speed resulted in a decrease in the mean NOX concentration and the error
estimate. For wind directions from the north at LHR2 (i.e. from the nearby road), it was found that the error
term decreased typically by a factor of 2-3 as the wind speed increased from 1-2 to 8-9 m s-1. It was also
found that there was an approximately linear dependence between the error estimate and the mean
concentration of NOX. Because the focus of this work is aircraft sources, the error estimates derived in Fig.
1c have been used to derive an error surface as shown in Fig. 1d. In Fig. 1d, the largest errors were
calculated for wind speeds > 8 m s-1 from all wind directions except the south-west sector. The lower
estimated error at high wind speeds from the south-west is due to the high proportion of wind angles from
does not change much if estimated sampling errors are accounted for. In addition to the sample population
errors, errors are associated with the interpolation routine used. However, these errors are small in
comparison with the sample population errors because over 95 % of the wind speed/direction cells are
populated with one or more measurements. Increasing the resolution of the grid spacing led to a smoother
plot rather than a plot with a different distribution of concentration. Furthermore, the concentration
distribution was not found to be highly sensitive to the interpolation technique used. These calculations do,
however, highlight the sample size necessary for the bivariate polar plots to represent a particular source.
Nevertheless, care would need to be exercised when applying this approach to sparse data sets.
0 50 100 150 200 250 300
0 5 10 15 20 25 30
standa
rd deviati
on of mea
n
NO
X
(
μ
g m
-3 )
sample size
wind speed interval (m s-1)
[image:11.595.76.342.278.476.2]0-1 1-2 2-3 3-4 4-5 5-6 6-7 7-8 8-9
Fig. 2 Dependence of sample size on the standard deviation of the mean NOX concentration for a wind
direction 180-220° and different wind speed intervals at LHR2.
3. Results and Discussion
3.1 Spatial analysis
Bivariate polar plots for NOX have been derived for seven monitoring sites shown in Fig. 3. Each of these
plots considers hours from 06:00-22:00, to maximise the NOX signal from aircraft sources. Appropriate
background NOX concentrations were subtracted, consistent with the assumptions shown in Table 2, with the
aim of highlighting potential airport sources. Most plots highlight elevated NOX concentrations even at wind
speeds up to 10 m s-1 when the wind direction is from the airport. At Harlington and Hounslow NOX
east of LHR (Slough, Green Gates and Main Road), and for wind speeds typically > 3 m s-1, NOX
concentrations will be detected for ‘easterly operations’ i.e. take off east on the southern runway and landing
on the northern runway. This potentially explains the relatively high concentrations of NOX recorded at
Main Road (550 m from the southern runway) due to aircraft taking off on that runway. Similarly, at Green
Gates, lower NOX concentrations might be expected because aircraft land on the northern runway during
easterly operations. On this basis, the NOX concentrations shown in the Slough plot look anomalously high,
which might suggest the influence of other sources. Finally, the site at Oaks Road, also highlights a potential
aircraft NOX source, which is most apparent in the direction from 340-80°. Taken together, these plots
appear to show the presence of a NOX source in the direction of LHR that does not have the characteristics of
typical ground-level sources. However, the analysis is qualitative and does not provide statistically robust
proof of the presence of aircraft sources. Section 3.3 seeks to quantify the presence of aircraft by applying a
statistical test.
0m 1000m 2000m 3000m 4000m
-10 -8 -6 -4 -2 0 2 4 6 8 10
-10 -8 -6 -4 -2 0 2 4 6 8 10 -10 -8 -6 -4 -2 0 2 4 6 8 10
-10 -8 -6 -4 -2 0 2 4 6 8 10
-10 -8 -6 -4 -2 0 2 4 6 8 10
-10 -8 -6 -4 -2 0 2 4 6 8 10
-10 -8 -6 -4 -2 0 2 4 6 8 10
-10 -8 -6 -4 -2 0 2 4 6 8 10
-10 -8 -6 -4 -2 0 2 4 6 8 10
-10 -8 -6 -4 -2 0 2 4 6 8 10 -10 -8 -6 -4 -2 0 2 4 6 8 10
-10 -8 -6 -4 -2 0 2 4 6 8 10
-10 -8 -6 -4 -2 0 2 4 6 8 10
[image:12.595.59.535.365.632.2]-10 -8 -6 -4 -2 0 2 4 6 8 10 0 4 8 12 16 20 24 28 32 36 40 44 48 52 56 60 64 68 72 76 80 Slough Green Gates Main Road Oaks Road Harlington LHR2 Hounslow
Fig. 3. Bivariate NOX polar plots for monitoring sites close to Heathrow Airport with background
concentrations subtracted (μg m-3). These plots are for hours from 06:00–22:00. The grey lines highlight
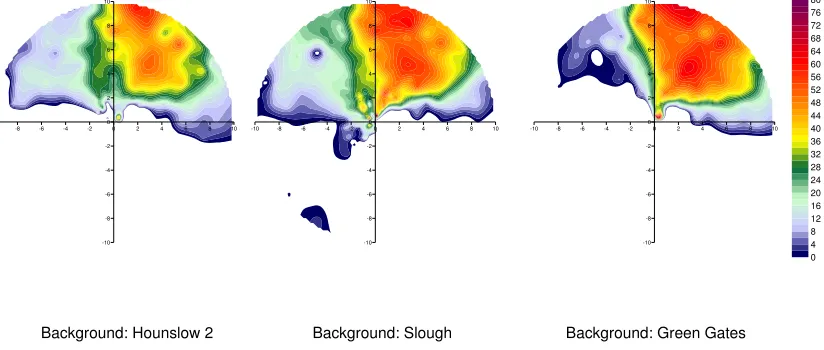
The patterns of concentration observed in Fig. 3 depend on the choice of background site used for
subtraction. Ideally, background sites would be located at the airport perimeter, directly upwind of the site
of interest. In most cases the choice of site was limited by the availability of background sites. However, for
some sites there were several possible background sites available for subtraction. The choice of background
site is important for two principal reasons. First, it is important to confirm whether the pattern of
concentration generated in the bivariate polar plots is strongly affected by the choice of background site.
Second, in section 3.4, background subtraction is used to estimate the upper limit of the airport contribution
to NOX and NO2 concentrations and the choice of background site is likely to affect the estimated airport
contribution. Fig. 4 shows the NOX bivariate polar plot for the Oaks Road site to the south of LHR with
three different background sites used for subtraction (Hounslow, Slough and Green Gates). The pattern of
concentration is similar for all cases with strong evidence of high concentrations of NOX (> 50 μg m -3
) at
wind speeds > 8 m s-1 and for wind angles from 350-70°. However, Fig. 4 highlights that using Hounslow as
a site for background subtraction leads to lower concentrations of NOX than either Slough or Green Gates.
This result is expected because the Hounslow site is more directly upwind of Oaks Road (see Fig. 3) and is
also in the same direction of central and inner London. Air trajectories from that direction will therefore tend
to have a higher concentration of NOX than from other directions, thus leading to lower NOX concentrations
in the bivariate polar plot. Considering all these factors, it was assumed that the Hounslow site was the most
appropriate in this case. For other possible combinations of site pairs it was found that the pattern of
concentrations was not strongly affected by the choice of site used for background subtraction.
Background: Hounslow 2 Background: Slough Background: Green Gates
-10 -8 -6 -4 -2 0 2 4 6 8 10
-10 -8 -6 -4 -2 0 2 4 6 8 10
-10 -8 -6 -4 -2 0 2 4 6 8 10
-10 -8 -6 -4 -2 0 2 4 6 8 10
-10 -8 -6 -4 -2 0 2 4 6 8 10
[image:13.595.62.474.544.719.2]-10 -8 -6 -4 -2 0 2 4 6 8 10 0 4 8 12 16 20 24 28 32 36 40 44 48 52 56 60 64 68 72 76 80
Fig. 4 Effect of choice of background site used for subtraction for NOX concentrations measured at Oaks
3.2 Wind speed and runway dependence
Section 2.2 highlighted that the wind speed dependence of NOX concentrations at airport-influenced sites is
markedly different compared with road sources. This section considers that dependence in more detail and
also aims to highlight how the pattern of runway alternation operating at LHR can be highlighted by data
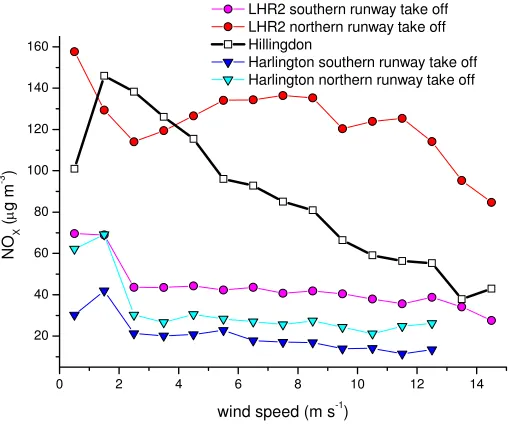
filtering. To illustrate the effect on NOX concentrations of runway operation, hours were extracted for
westerly operation, which were further separated into northerly runway take off and southerly runway take
off. Data were also filtered by wind direction (see Table 2) and for hours between 06:00-22:00. Fig. 5
shows the results at LHR2 and Harlington and highlights the very clear difference between the two runway
operation modes. At LHR2, for example, the difference between northern and southern runway operation is
clear: concentrations of NOX are over a factor of two less when aircraft take off from the southern runway.
The difference is also clear at Harlington (1230 m and 2670 m from the northern and southern runways,
respectively). Considering northern runway take off, these results indicate that NOX is diluted by a factor of
approximately 5 between LHR2 and Harlington; a distance of 1 km.
Also highlighted in Fig. 5 is the wind speed dependence of NOX for LHR2, Harlington and the Hillingdon
site that is dominated by a local road source. The Hillingdon results highlight that increasing wind speeds
decrease the concentration of NOX. By contrast, the LHR2 and Harlington results show that concentrations
of NOX vary little in the wind speed range 2-12 m s-1. These results highlight the very different behaviour or
aircraft plume dilution compared with non-buoyant road traffic sources. Taken together, these characteristics
0 2 4 6 8 10 12 14 20
40 60 80 100 120 140 160
LHR2 southern runway take off LHR2 northern runway take off Hillingdon
Harlington southern runway take off Harlington northern runway take off
NO
X
(
μ
g m
-3 )
[image:15.595.76.331.73.285.2]wind speed (m s-1)
Fig. 5. Wind speed dependence of NOX concentrations for LHR2, Harlington and Hillingdon. All data sets
have been filtered by wind direction and a background concentration removed (see text). The LHR2 and
Harlington relationships show the effect on concentrations of different runway operation modes.
3.3 Detection of an aircraft NOX signal
There exist certain conditions where the detection of aircraft emissions at monitoring sites close to LHR
would be most likely and these can be used to apply a statistical test to determine whether they can be
detected in the ambient data sets. As discussed previously, these conditions include: filtering data by wind
direction such that emissions from LHR are upwind of the monitoring sites, selecting higher wind speed
conditions where the effect of ground-level sources such as roads are diminished, selecting hours of the day
(06:00-22:00) when aircraft activity is high, and removing a local background concentration to highlight
airport sources. Filtering for these conditions does not, however, result in the unambiguous identification of
airport or aircraft emissions because of the remaining dominant effect of road traffic NOX sources.
A quantitative approach for detecting aircraft sources at LHR is to exploit the unique activity of aircraft
movements and in particular the pattern of runway alternation described in section 2.1 together with the data
filtering described above. A statistical test can be constructed that compares measurements of NOX when
aircraft take-off on the northern runway (and land on the southern runway) with take-off on the southern
independent hourly data sets that can be analysed for a statistical difference between them because aircraft
take-off emissions are many times higher than taxing or landing emissions (see Herndon et al. (2004) and the
International Civil Aviation Organization (ICAO) emissions databank at http://www.caa.co.uk/). This
unique activity profile of aircraft movements at Heathrow therefore results in emissions that vary spatially
and temporally in a way that is different from other sources such as road transport and thus distinguishes
them from other emission sources. Here, use is made of the nonparametric Mann-Whitney U test for two
independent samples. This approach was chosen rather than the t-test because the latter assumes normality,
which rarely exists in air pollution data sets. Table 2 summarises the results of the test applied to the
monitoring sites and highlights the value of p, the probability that there is no difference in the means, and the
[image:16.595.51.421.359.478.2]test statistic Z.
Table 2. Results of the Mann-Whitney test applied to filtered data at monitoring sites1.
Site Wind direction2 Background site P Z
LHR2 150-260 Oaks Road 0.000 64.8
Harlington 160-260 Oaks Road 0.000 10.2
Hounslow 200-260 Oaks Road 0.000 6.2
Oaks Road 340-80 Hounslow 0.000 5.3
Main Road 80-170 Oaks Road 0.002 3.1
Green Gates 100-170 Oaks Road 0.000 3.5
Slough 100-170 Oaks Road 0.803 0.3
Hillingdon 130-230 Oaks Road 0.268 1.1
1
Data in bold show results that are statistically significant at the p=0.01 level.
2
Data have also been filtered by hour of day (06:00-22:00); wind speeds > 3 m s-1.
The strongest signal of aircraft emissions is at LHR2, which is not surprising given the proximity of this site
to the airport. At this site there was also a large difference in NOX concentration between aircraft taking off
or landing on the northern runway (136.2 vs. 44.8 μg m-3). At other sites the difference in measured NOX
due to aircraft operation is much less significant. At the Hounslow site, for example, the difference was 29.8
vs. 29.2 μg m-3 and yet there is a highly statistically significant difference between the two modes of aircraft
operation. Only two of the monitoring sites did not show an indication of an aircraft source: Hillingdon and
Slough. The Hillingdon site is about 2 km from the northern runway and is dominated by a nearby
motorway source of NOX. Because runway alternation is not used for easterly operation, it is difficult to use
therefore, whether the concentration pattern shown for Slough in Fig. 3 is due to the airport or other sources
of NOX. These results show that the unique pattern of aircraft operation at LHR2 is a very effective
characteristic that can be used to detect the influence of the airport even at locations where the contribution
to NOX is small and dominated by other sources of NOX.
It is possible that some of the results in Table 2 could have arisen by chance because of variations in
meteorology and emissions that are not associated with the airport. Therefore, as an additional check, the
Mann-Whitney test was also applied to a sample of 10 other NOX monitoring sites across London more than
5 km away from LHR (5 background and 5 roadside) using the same data filtering techniques to determine
whether there was a statistically significant difference due to aircraft operation. At all of these sites p >0.1
suggesting that there was no statistically significant difference in NOX concentration due to different runway
operation modes. These results provide strong evidence that aircraft emissions can only be detected at
monitoring sites within a few km of LHR.
3.4 Quantification of airport contribution to concentrations of NOX
Estimates of the upper limit of the airport contribution to NOX can be made by considering the wind sector
where the airport is likely to have an effect and by removing a background contribution. The choice of
background site and wind sector is shown in Table 2. The estimate is an upper limit because of the presence
of other sources of NOX between the background site and the site analysed. In the case of LHR2, the upper
estimate should also be a best estimate because there are very few other sources between LHR2 and Oaks
Road. For all the other sites, there are other sources (principally roads) that would also contribute. A better
estimate of the airport contribution is likely to be made by filtering for wind speeds > 3 m s-1. The filtering
has the effect of reducing the influence of road sources while maximising aircraft sources. This approach is,
however, an approximation and dispersion modelling would be needed to reduce the uncertainty.
An upper limit to the airport contribution to NO2 concentrations has also been estimated, as shown in Table
3. At LHR2 it is estimated that the airport contributes 15.0 μg m-3 (27.3 %) of the total measured NO2,
Harlington and Hounslow were similar, and contributed 17.4 and 18.0 % of the total NO2 measured as an
upper limit at these sites, respectively. Using the 3 m s-1 wind speed filtering suggests that a contribution of
about 10 % is probably closer to the actual contribution at these two sites. These results also show that NO2
accounts for a greater proportion of the total NO2 than for NOX at Harlington and Hounslow (ca. 10 vs. 18
%). This is probably because the airport plume is “aged” and that there is enough time for the plume to be
[image:18.595.54.558.283.415.2]well-mixed and for NO to react with ozone to form NO2.
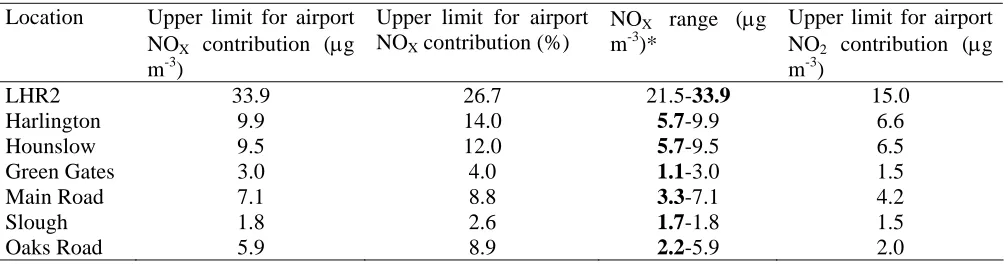
Table 3. Estimated upper limit of airport NOX and NO2 contribution to measured NOX and NO2
concentrations.
Location Upper limit for airport NOX contribution (μg
m-3)
Upper limit for airport NOX contribution (%)
NOX range (μg
m-3)*
Upper limit for airport NO2 contribution (μg
m-3)
LHR2 33.9 26.7 21.5-33.9 15.0
Harlington 9.9 14.0 5.7-9.9 6.6
Hounslow 9.5 12.0 5.7-9.5 6.5
Green Gates 3.0 4.0 1.1-3.0 1.5
Main Road 7.1 8.8 3.3-7.1 4.2
Slough 1.8 2.6 1.7-1.8 1.5
Oaks Road 5.9 8.9 2.2-5.9 2.0
*numbers in bold are considered to be closest to the actual contribution.
Although it is not the focus of this paper, hourly measurements of particulate matter below 10 μm diameter
(PM10) made by the Tapered Element Oscillating Microbalance (TEOM) technique were available at LHR2
and Oaks Road, which enabled similar analyses to be undertaken for PM10 as for NOX. The overall
contribution made by aircraft to PM10 concentrations is small, but can, however, be detected in a statistically
significant way by considering the variation in PM10 concentrations by runway alternation. The same
methodology used to calculate the contribution that airport NOX emissions was also applied to PM10. The
analysis was based on the use of TEOM instruments located at LHR2 and Oaks Road. It is estimated that at
LHR2 a contribution of 0.9 μg m-3 due to the airport out of a total of 21.6 μg m-3 i.e. 4.2 % of the total. It is
useful to compare the PM10/NOX ratio calculated from these results because the ratio can be compared with
that of road transport sources. A mean PM10/NOX ratio of 0.015 (on a mass basis) was estimated, which is
LAEI for 2002. This is consistent with the interpretation that aircraft are a more important source of NOX
than PM10 compared with road traffic.
4. Conclusions
A major factor that will determine whether a third runway is built at London Heathrow is the compliance
with the EU annual mean Directive for NO2. The complexity of NOX sources close to Heathrow makes it
difficult to undertake source apportionment analysis. Even though Heathrow is an important emission source
of NOX, concentrations of NOX close to the airport are dominated by road traffic sources. Detecting and
quantifying the contribution made by the airport to local concentrations of NOX is therefore difficult.
A graphical technique has been developed, extending the work of Yu et al. (2004), which can help
discriminate between sources of NOX emitted at ground level with little or no buoyancy (e.g. road traffic)
and sources of NOX with significant amounts of buoyancy (e.g. aircraft and large point sources). Bivariate
polar plots have been derived that extend the idea of pollution roses by also accounting for wind speed. It is
shown that for a small network of monitoring sites, where enough sites exist to subtract a background
concentration, that bivariate polar plots are effective at highlighting the presence of aircraft NOX emissions.
By removing a local background contribution a much clearer indication of airport source characteristics can
be gained, such as the wind speed dependence of aircraft jet plumes. Although bivariate polar plots have
been used in this work to distinguish between sources where plume buoyancy is important or not, they are
useful in other situations where there is a complex relationship between the concentration of a species, wind
speed and direction. Examples include complex flows in street canyon locations, where the presence of
building can affect the flows in a complex manner and particle sources where wind-blown re-suspension is
important and where particle concentrations can increase with wind speed.
The unique activity profile of aircraft movements at Heathrow has been exploited to discriminate between
airport and other sources of NOX. In particular, the two runways at Heathrow alternate in their use daily and
weekly and this contrasts with the pattern of activity for road transport, which is the major contributor to
with other data filtering techniques that maximise the possibility of observing aircraft sources, to quantify
whether aircraft emissions can be detected in hourly measurements of NOX and NO2. It is found that aircraft
NOX emissions can be unambiguously detected at monitoring sites at least 2.6 km from the airport. Close to
the airport boundary downwind of the prevailing wind direction, we find that the airport accounts for 27 % of
the measured NOX. However, at about 1.0-1.5 km it is estimated that the airport contribution is diluted by a
factor of about 5 and the airport accounts for 12-14 % of the measured NOX at these locations. However,
because of the presence of other sources (primarily road traffic), estimates made beyond the airport boundary
are considered to be upper limits and the actual contribution will be less than these estimates.
This work has also highlighted the contrasting wind speed-dependence of road traffic and aircraft plumes. In
the case of aircraft it is found that approximately 180 m from the runway, concentrations of NOX vary little
across a wind speed range from 2-12 m s-1. These results indicate that the buoyant nature of aircraft plumes
is an important characteristic that should be accounted for in dispersion modelling studies. These results
should also provide an effective additional means of validating dispersion models used for the prediction of
concentrations in the vicinity of airports.
Acknowledgements
We are grateful to the UK Department for Transport Project for the Sustainable Development of Heathrow,
which funded much of this work. We particularly acknowledge the input from the PSDH technical panels
that provided feedback on much of the work presented here and provided most of the data used. We would
like to stress that the views expressed in this article are those of the authors and not the Department for
Transport.
References
AQEG (2004). Nitrogen dioxide in the United Kingdom. Report of the UK Air Quality Expert Group.
Prepared for the Department of the Environment Food and Rural Affairs, the Scottish Executive, the Welsh
Assembly and the Department of the Environment in Northern Ireland. Defra publications, London, March
DfT (2003). The Future of Air Transport. Department for Transport, December 2003. Report available at
http://www.dft.gov.uk/stellent/groups/dft_aviation/documents/divisionhomepage/029650.hcsp.
Fuller, G. (2005). Air Quality in London 2003 – Final Report. King’s College London, March 2005. Report
available at http://www.londonair.org.uk/london/reports/.
Henry, R. C., Y. S. Chang and C. H. Spiegelman (2002). Locating Nearby Sources of Air Pollution by
Nonparametric Regression of Atmospheric Concentrations on Wind Direction. Atmospheric Environment
36(13): 2237-2244.
Herndon, S.C., Shorter, J.H., Zahniser, M.S., Nelson, Jr. D.D., Jayne, J., Brown, R.C., Miake-Lye, R.C.,
Waitz, I, Silva, P., Lanni, T., Demerjian, K. and C.E. Kolb (2004). NO and NO Emission Ratios Measured
from In-Use Commercial Aircraft during Taxi and Takeoff.
2
Environmental Science and Technology 38(22),
6078 - 6084.
Seinfeld, J. H. and S. N. Pandis (1998). Atmospheric chemistry and physics: from air pollution to climate
change. New York; Chichester, Wiley.
Yu, K. N., Y. P. Cheung, T. Cheung and R. C. Henry (2004). Identifying the Impact of Large Urban Airports