Theses Thesis/Dissertation Collections
8-2014
Privacy Sensitive Resource Access Monitoring For
Android Systems
Leah Xinya Zhao
Follow this and additional works at:http://scholarworks.rit.edu/theses
This Thesis is brought to you for free and open access by the Thesis/Dissertation Collections at RIT Scholar Works. It has been accepted for inclusion in Theses by an authorized administrator of RIT Scholar Works. For more information, please [email protected].
Recommended Citation
Monitoring For Android Systems
by
Leah Xinya Zhao
A Thesis Submitted in Partial Fulfillment of the Requirements for the Degree of Master of Science
in Computer Engineering
Supervised by
Associate Professor Shanchieh Jay Yang Department of Computer Engineering
Kate Gleason College of Engineering Rochester Institute of Technology
Rochester, New York August 2014
Approved by:
Shanchieh Jay Yang, Associate Professor
Thesis Advisor, Department of Computer Engineering
Roy Melton, Senior Lecturer
Thesis Secondary Advisor, Department of Computer Engineering
Wei Le, Assistant Professor
Dedication
Acknowledgments
Abstract
Privacy Sensitive Resource Access Monitoring For Android Systems
Leah Xinya Zhao
Supervising Professor: Shanchieh Jay Yang
Mobile devices, with an extensive array of capabilities and flexibility, are sometimes said to be an extension of the human body. Enhancing device capabilities and incorporating them into everyday life have always been a huge focus of the mobile industry. In the area of mobile data collection, existing works collect various types of user behavior data via mobile device usage, and use the data to aid in further understanding of human behavior. Typical data collection utilizes application or background service installed on the mobile device with user permission to collect data such as accelerom-eter, call logs, location, wifi transmission, etc. In this process, sensitive user information is tracked through a data tainting process. Contrary to the ex-isting works, this research aims at collecting application behavior instead of user behavior. The goal is to provide a means to analyze how background services access mobile resources, and potentially identify suspicious appli-cations that access sensitive user information.
Contents
Dedication . . . iii
Acknowledgments . . . iv
Abstract . . . v
1 Introduction. . . 1
1.1 Motivation and Background . . . 1
1.2 Problem Statement . . . 2
2 Related Work . . . 4
2.1 Analysis of Mobile Data . . . 4
2.2 Android Architecture . . . 7
2.2.1 Android Application Sandbox . . . 9
2.3 Android Application Analysis . . . 9
2.4 Data Collection Mechanisms . . . 11
3 Methodology . . . 14
3.1 Overall System Design Analysis . . . 15
3.1.1 Collection Module Analysis . . . 15
3.1.2 Server Module Analysis . . . 17
3.2 Data Collection Components . . . 17
3.2.1 Data Collection Module . . . 20
3.2.3 Collection Server Module . . . 29
3.3 Test Application Design and Implementation . . . 31
4 Results and Discussions . . . 38
4.1 Experiment Setup . . . 38
4.1.1 Passive Data Collection . . . 39
4.1.2 Active Data Collection . . . 40
4.2 Results . . . 43
4.2.1 Privacy Sensitive Resource Utilization . . . 43
4.2.2 Privacy Sensitive Resource Access Intensity . . . 49
4.2.3 Network Traffic Analysis . . . 55
4.2.4 Action Based Sequential Analysis . . . 61
4.3 Performance . . . 64
5 Conclusion and Future Work . . . 65
List of Tables
3.1 Location listeners . . . 22
3.2 Contacts listeners . . . 23
3.3 Microphone listeners . . . 23
3.4 Device information listeners . . . 24
3.5 Camera listeners . . . 25
3.6 Accelerometer listeners . . . 25
3.7 SMS listeners . . . 26
3.8 Browser history listeners . . . 26
3.9 Location based resourse test . . . 32
3.10 Contacts, browser resource, sms based resourse test . . . 33
3.11 Microphone based resource test . . . 33
3.12 Accelerometer based resource test . . . 34
3.13 Camera based resource test . . . 35
3.14 IMEI, IMSI, Phone number, and ICCID based resource test . 36 4.1 Categories and applications downloaded. . . 39
4.2 User interaction activity time breakdown. . . 42
4.3 Number of IP address for each application in the passive and active case. . . 60
4.4 Applications with same IP addresses. . . 60
List of Figures
2.1 Interaction of students in the MIT community (figure
ex-tracted from Dong et al, [8]). . . 5
2.2 Android software stack (figure extracted from Android se-curity overview, [1]). . . 8
2.3 AppWindow architecture structure (figure extracted from Zhang at el,[11]). . . 10
2.4 NetSense mobile data aquisition infrastructure (figure ex-tracted from Striegelat el,[6]). . . 12
2.5 mFingerprint mobile data collection to application frame-work (figure extracted from Zhang at el,[14]). . . 13
3.1 Android security structure for user sensitive data access (fig-ure extracted from [1]). . . 15
3.2 Overall privacy sensitive resource monitoring system de-sign. . . 18
3.3 Overall data collection module design. . . 21
3.4 Overall data collection client module design. . . 27
3.5 Example TaintDroidNotify notification. . . 28
3.6 Overview of collection server module design and process flow. . . 29
3.7 MySQL database schema. . . 30
4.1 Number of sensitive resource accesses made by each
third-party application passively. . . 44
4.2 Number of sensitive resource accesses made by each
third-party application actively. . . 45
4.3 Number of sensitive resource accesses made by different
categories of third-party application passively. . . 46
4.4 Number of sensitive resource accesses made by different
categories of third-party application actively. . . 47
4.5 Passive utilization of types of resources in terms of
cate-gories of third-party application processes. . . 48
4.6 Passive utilization of types of resources in terms of
cate-gories of third-party application processes. . . 48
4.7 Intensity heat map of passive resource access attempts. . . . 50
4.8 Intensity heat map of active resource access attempts. . . . 50
4.9 Intensity summary graph of passive resource access attempts.
52
4.10 Intensity summary graph of active resource access attempts. 52
4.11 Intensity of passive resource access attempts by application
categories. . . 53
4.12 Intensity of active resource access attempts by application
categories. . . 53
4.13 Intensity comparison between specific passive and active
application categories. . . 54
4.14 Passive application network traffic. . . 55
4.15 Active application network traffic. . . 56
4.16 Passive application network traffic in terms of application
4.17 Active application network traffic in terms of application
categories. . . 57
4.18 Passive application network traffic in terms of utilized re-sources. . . 58
4.19 Active application network traffic in terms of utilized re-sources. . . 59
4.20 Passive action sequence of Google location process. . . 61
4.21 Active action sequence of Google location process. . . 62
4.22 Action sequence of using Snapchat. . . 63
Chapter 1
Introduction
1.1
Motivation and Background
The smartphone industry is a fast growing industry. In 2013 alone, 1.004 billion smartphones were shipped, which is a 38.4 percent increase from 2012 [17]. Accordering to Gartner, a fact-based consulting service, 102 bil-lion applications were downloaded globally in 2013 [24]. With this indus-try growth, mobile datasets attract interest in many different fields: human behavior analysis, business opportunity exploration, security monitoring, healthcare, and many others. Especially with the fast advancing technology, mobile devices are now capable of performing tasks of various degrees of difficulty. Scenarios exist where applications embed user privacy informa-tion collecinforma-tion mechanisms to better learn about all of its users around the world. For researches, mobile data collection mechanism have also been put in place to collect specific datasets for further analysis. The research-based collections are usually explicit. Currently there are many different types of datasets collected and analyzed in which mobile resources such as contacts and sensors were used [20] [10] [28] [27] [26] [21] [18]. However, there are few, if any, datasets collected to understand the dynamic behavior of application processes and their interaction with privacy sensitive mobile resources.
contract between the user and the application. Once the required permis-sions have been granted, the application is able to perform tasks without the user’s consent regarding to the granted permissions ever again. Many devel-opers utilize this grey area regarding consent to gain understanding of their target market behavior or even more. The Weather app, for example, has a background service to actively utilize the GPS resource to track the user location. Even when the Weather application is not in the foreground, this GPS service will still log the user’s location. There is a need to understand these background services behavior to help users understand risks involved with each application.
Another reason to collect application process interaction with privacy sensitive mobile resources is to understand the intensity and frequency of resources accesses at any given period of time. Machine learning algorithms could be applied to the dataset to learn the behavior of a specific phone and observe anomalies in real time. In some other cases, this dataset could be combined with mobile performance datasets to help phone developers better understand each available mobile resources. The sequence of behavior can also be analyzed in real time to identify security breaches. This is a small step towards the cross platform big data challenge.
1.2
Problem Statement
Given the need and benefits of background services accessing mobile re-sources, there are both security and privacy risks exposed. To address these risks, datasets should be collected relating to activities of background ser-vices accessing privacy sensitive mobile resources.
The scope of this work is sectioned into three major components: mon-itoring mechanism, mobile client, and server storage. Each one of these components will be further discussed in later sections. As with any research work, there are some limitations. For one, the Android ROM must be mod-ifiable to support the system wide collection mechanism implementation. Second, with the stock Android ROM, there is a limitation on the kind of third party applications availability.
Chapter 2
Related Work
The work involved in this thesis research is motivated by several related areas pertaining to mobile data analysis, Android architecture, Android ap-plication analysis, and mobile data collection mechanisms. The following sections briefly describe each of these areas.
2.1
Analysis of Mobile Data
Mobile phones are capable of tracking human movements, monitoring ap-plication usage, recording point of intersection, etc. Specific sets of mo-bile data include social relationship data, communication data, GPS trajec-tory data, application usage data, and sensor data. Human relationships and community interaction are the focal point of many researchers. The under-standing of social relationship and community behavior can help researchers understand the spread of diseases, and crime outbreaks. This type of data also offers valuable information for business marketers.
called whom, and who sent short messages to whom. Figure 2.1 is a graph-ical representation of the interaction of students in the MIT community.
Figure 2.1: Interaction of students in the MIT community (figure extracted from Donget al, [8]).
As shown in Figure 2.1 the different living sectors are represented with different colors. The numbers corresponds to the year level of each student. This also demonstrated that subjects in the dormitory formed clusters of relationships by their dormitory sectors and their years in school [8].
to display the positive and negative activity of the user. As of 2010, this research was still an ongoing.
On GPS trajectory data, in the research paper Weiet al. [22], mobile was used in the route inference framework. The interests were the movement routes of humans, animals, hurricanes, and vehicles. The focus was the location information along with a timestamp variable. The researchers anal-ysis was based on check-in activities, photo uploads, and activity sharing: basically anything that has a location and timestamp attribute associated with it. This type of data has uncertainties associated with it due to the low frequencies caused by certain application features and energy saving modes [22]. The uncertainties were then used to construct popular routes without knowing road network information.
Yuan et al. [16] is another case of utilizing GPS trajectory data. Specif-ically, mobile GPS was used to determine human mobility models. Human trajectories were determined based on cell-tower traces in a cellular net-work, trajectory driving routes, or posts that consists of geo tweets and geo-tagged photos, as well as check-ins. This type of data was determined to have a strong correlation with the traveling behavior of people [16]. The re-searchers used this dataset to determine when people arrived at and left from a specific region. The data points were also used to determine where people were coming from and going to. This dataset was then combined with POIs to model the urban dynamics. Specifically, the topic-based method was used to analyze the data. For example, the geographic regions are seen as docu-ments. The functions that are associated with each region are seen as topics. The human mobility gathered from mobile data is seen as words. Lastly, the POIs located in each region are seen as metadata [16]. This model was put in place to analyze the urban dynamics in Beijing.
on that [18].
Aside from all the datasets discussed, there are also sensor datasets. Mo-bile devices are equipped with several advanced sensors to enhance the user experience. In the area of data collection, these sensors could be easily ac-cessed and used to collect valuable information about the user. Kwapisz et al [20], explored the potential of using a cell phone accelerometer to detect the type of activity that the user had performed. In this particular approach they utilized the fact that accelerometers can track movement in the X, Y, and Z axes. The data were collected directly from files stored on the phones via a USB connection. The collected accelerometer values were then trans-lated to useful data sets. The data sets contained information such as average acceleration for each axis, standard deviation for each axis, average absolute difference for each axis, average resultant acceleration, time between peaks of each axis, and range of value in each axis. The collected data were then plotted. By analyzing the different patterns and frequencies of various ac-tivities, it was then quickly realized which activity the user was performing at that time.
This body of related work demonstrates some of the many possible uses for collected mobile data. These types of analysis are based on explicit data collection through some sort of human interaction, whether it is mindful interaction or oblivious interaction. The work discussed very much focused on human mobility analysis. However, there is another side of analysis that has not been explored very much. This thesis work focuses on the implicit data collection (data collection that are completed without user awareness) and analysis of background services data. Specifically, the work concerns access and activity frequencies to privacy sensitive resources on the phone. This specific set of data may help researchers understand potential security loopholes as well as to better understand specific application.
2.2
Android Architecture
of three building blocks: device hardware, Android operating system, and Android application runtime [1]. The device hardware contains the hard-ware configurations to target specific devices such as smart phones, tablets, etc. The Android operating system is responsible for managing all device resources as camera, GPS, Bluetooth, telephony function, network connec-tions, etc. Lastly, the Android application runtime is the environment in which both Dalvik and native applications run.
[image:20.612.97.525.270.583.2]In terms of software, Android has a very defined architecture. In Figure 2.2, each layer and its responsibilities of the software stack are displayed.
Figure 2.2: Android software stack (figure extracted from Android security overview, [1]).
secure inter-process communication (IPC), and the ability to remove unnec-essary and potentially insecure parts of the kernel. In this thesis investiga-tion, the application framework layer, libraries layer, and android runtime layer are modified to support the collection mechanism.
2.2.1 Android Application Sandbox
Application sandbox is based on the Linux user-based protection concept. In general terms, it is the idea of identifying and isolating application re-sources [1]. A unique user ID (UID) is assigned to each Android application by the Android system. Each application then runs as that user in a separate process. This prevents applications from interacting with each other by de-fault, and it also limits the access to the operating system. The application sandbox resides in the kernel layer; this architecture allows software above the kernel as shown in Figure 2.2 to comply with the security limitations.
This application sandbox architecture makes collection mechanism im-plementation impossible in the application layer as seen in Figure 2.2. Since the focus of the collection mechanism is to monitor the accesses of third-party applications to privacy sensitive resources, modification to the An-droid software stack was necessary to support the level of AnAn-droid security breach.
2.3
Android Application Analysis
In terms of Android application analysis, there has been little work. Enck
Figure 2.3: AppWindow architecture structure (figure extracted from Zhangat el,[11]).
68 cases of potential misuse of users’ private information was found across 20 applications.
Wei et al. [12] is another research effor to assess and monitor applica-tions in a systematic way. This research attempted to construct a profile for various third-party applications. The main approach is divided into four dif-ferent layers: static specification, user interactions, operating system, and network. In the static layer, the APK (Android application package) was analyzed. In the user interaction layer, user generated events were recorded and logged with tools such as adb and logcat. For the operating system layer, system calls were monitored to observe operating system activity. In the network layer, network traffic was analyzed through the logging of data packets. In total, 27 free and paid Android applications were evalu-ated. Discrepancies between the application specification and application execution were found. Many cost-effective but comprehensive application profiles were formed.
For improving transparency for smartphone applications, Zhang et al
assessment was conducted based on the access behaviors of applications. Their overall system was divided into two parts: Privacy Fingerprint and In-trusiveness Score. The AppWindow developed for the Privacy Fingerprint component is shown in Figure 2.3. The basic idea was that the methods of each accessed sensitive information methods are monitored. Whenever specific methods are called, the event is logged. Intrusive scores algorithms are then applied to understand the risks involved.
This thesis work contributes to application analysis. It incorporates and extends the work done with TaintDroid [27]. The enhancements lie in the addition of privacy sensitive resource action listeners. These listeners aug-ment the sensitive resource access dataset by providing sequential access and specific actions.
2.4
Data Collection Mechanisms
For collecting information on a mobile device, there are many approaches. In their research paper Striegel et al. [6], the question how the digital world (Facebook, SMS, etc) impacts how friends are made and kept was explored. A NetSense Infrastructure built to extract useful information from the mo-bile device and pass it on for storage on an external server. The overall structure is displayed in Figure 2.4.
Figure 2.4: NetSense mobile data aquisition infrastructure (figure extracted from Striegel at el,[6]).
In Zhang et al. [14], a user modeling framework was developed from a multimodal mobile sensor and log data. The framework that was built covered the whole process from collecting, to processing, to analyzing, and applying data. mFingerpring framework is displayed in Figure 2.5
The framework was clearly defined in four layers. The very first layer is the mobile data collection layer. In this layer, an Android app called Easy-Track was developed based on Funf Open Sensing Framework. The app collected hard sensor data as well as application log data. The collected in-formation was then passed to the feature computation layer. In this layer, the entropy and frequency features were then conditioned based on time and location. After, data mining techniques such as clustering and classification were carried out in the user learning layer to further massage the data. The learned insights were then applied in the application layer in areas of user profile/behavior logger, reminder and user identification, and personaliza-tion services/UI.
Figure 2.5: mFingerprint mobile data collection to application framework (figure extracted from Zhangat el,[14]).
Chapter 3
Methodology
The lack of understanding of application and sensitive resource communica-tion presents a need to collect dynamic and timestamp based data on third-party applications’ access to various available privacy sensitive resources. To approach this system wide sensitive resource monitoring system, a dy-namic, sequence-based system must be implemented to track the various sensitive resources and store the resulting data. To design a dynamic real time privacy sensitive resources monitoring system there are many things to consider.
1. System must be able to listen to the communication between avail-able privacy sensitive resources and other third-party applications.
2. System must be able to track the flow of sensitive resources data.
3. The collection must run passively in the background to prevent interference with current running applications.
4. The collected data must be stored in a scalable database to support future expansion.
3.1
Overall System Design Analysis
In order to accomplish these tasks, a dynamic system wide time based sen-sitive resource tracking system implemented. The design consideration was divided into two major focuses: the collection module and the server mod-ule.
3.1.1 Collection Module Analysis
The collection module is the most important and crucial consideration of this thesis investigation. For the collection module design, the main require-ment is that the module must be able to observe and record the communica-tions of privacy sensitive resources. At a first glance, the very logical way of tracking system wide communication between third-party applications and sensitive resources was to design an application to monitor the processes of other applications. This type of design calls for application process and re-source monitoring. With the current Android sandbox security architecture, this type of activity was marked as a type of security breach. Figure 3.1 displays the Android security structure for user sensitive data access.
The idea of the sandbox architecture is to isolate each application pro-cesses from the other to ensure that there is no memory, CPU, and device (e.g. telephony, GPS, Bluetooth) hogging [1]. The sandbox structure also protects one applications private data from the others. Due to this security structure, a third-party sensitive resources monitoring application was not feasible.
Another examined approach was to utilize the Android debug bridge (ADB) and the Android logging system. The Android system supports a system wide logging facility. This facility allows for the logging of appli-cations and system components. The logging system consists of a kernel driver and buffer for storing log messages, language classes for making and accessing log messages, a standalone program for viewing log messages (logcat), and it has the ability to filter log messages from the host machine (via Eclipse or DDMS) [2]. The system also supports four different log buffers to enable logging for different parts of the Android system. The four log buffers are: main, events, radio, and system [2]. The main buffer is responsible for main application logging. The events buffer is used to track system even information. The radio buffer is used to log radio and phone based activities. Finally, the system buffer is used to log low-level system and debug messages.
After some analysis, it was realized that this logging system is only use-ful to a certain extend. For the logs to contain communication data between third-party applications and sensitive resources, third party applications had to implement log triggers to log those messages. This required a modifi-cation to all of the third-party applimodifi-cations’ source code. Aside from the modification, the already logged messages are also not in a standard for-mat. The message part of the log contained whatever the user or system wanted, thus made analyzing the collected dataset extreme difficult. With these two limitations, the logging design of the collection module would be impractical.
throughout the device to when the sensitive information leaves the phone. This concept was successful in tracking when changes were made to the sensitive data source as well as when sensitive information left the phone. This type of tracking lacked details in specific actions performed by each application processes. For example, all the internal details of actions per-formed before the information left the phone were ignored. This limitation required the implementation of listeners to track specific internal sensitive resource activities. The design is a system of taint tracking combined with privacy sensitive resource listeners. This provides a more comprehensive and sequence based sensitive resources communication dataset.
3.1.2 Server Module Analysis
The purpose of the server module is to handle the collected data in an effi-cient way that could make future analysis easier. For the scope of this thesis investigation, the server module had to be able to parse data strings and store them in a database. The communication method between the client and the server was hypertext transfer protocol (HTTP). This protocol sup-ports two different request methods: GET and POST. The GET method is a simple and insecure way of requesting data from specified resources. GET requests can be cached and bookmarked, and they have length restriction. On the contrary, the POST request is never cached, does not remain in the browser history, and has no data length restrictions. Due to the sensitivity and variable length of the data being collected, the HTTP POST request method was chosen for communication between the client and server mod-ule. As for the database, MySQL database was chosen. Since the communi-cation data between third-party applicommuni-cations and sensitive resources are all very standard and structured, the MySQL database satisfied the need. The structured MySQL database allowed to easy data analysis as well.
3.2
Data Collection Components
described in the overall system design analysis section, many design con-cepts were viewed and evaluated against system requirements.
To satisfy the requirements mentioned previously, the overall system is composed of three components: data collection module, collection client module, and collection server module. Figure 3.2, is a high level overview of the overall system components and process flow.
Figure 3.2: Overall privacy sensitive resource monitoring system design.
The design is based on the Android operating system. As seen in Fig-ure 3.2, the design is divided into two major implementations: the Android smart phone implementation and the server side implementation. The An-droid smart phone implementation is then further divided into two differ-ent modules: the data collection module and the collection clidiffer-ent module. Further division is based on the Android architecture structure and process flow. The data collection module resides throughout application framework, libraries, and Android runtime layer as could be observed in Figure 2.2. The collection client module is implemented as an Android application and re-sides in the application layer.
available sensitive resources and other third-party applications. The incor-poration of TaintDroid also allows the system to tag sensitive resources and track the flow of data from them throughout the system. Since the sensi-tive resources listeners are placed in the application framework layer, this enables the collection to run passively in the background to prevent interfer-ence with other running applications.
The collection client module is also designed based on the TaintDroid-Notify application [27] with the addition of client and server communica-tion support. The client module defines the dataset structure and prepares the data to be sent to an external server. The communication between client and server is established by the collection client support component as seen in Figure 3.2. The communication protocol that is used is HTTP POST re-quest. Since the application spawnned Android services to actively collect and send information, the collection process was able to run passively in the background.
On the sever side implementation, the design was a simple one. The goal was to securely receive the data and establish an interface between the server application layer and the implemented MySQL database. The client module is composed of three components as described in Figure 3.2. The components are web layer, application layer, and MySQL relational database. The web layer handles incoming server communication. The application layer is responsible for establish database connection. Finally, the database is used to house all the incoming data. This structure allows for secure data transfer and storage due to the security check in the application layer. This structure could be copied and more databases could be added to support future expansion.
then it passes to the application layer. In the application layer, the data is further formatted to meet the database schema. Once the application layer establishes a secure connection, the event is then injected into the database. Users can then observe the results in the database.
The later subsections describe each module implementation in detail. The data collection module is discussed first, and then the client module. Finally, the section concludes with the server module.
3.2.1 Data Collection Module
The most crucial part of the overall privacy sensitive resource monitoring system is the data collection module. The collection module is responsible for monitoring sensitive information flow as well as actions taken by each sensitive resource. The overall data collection module is described in Figure 3.3.
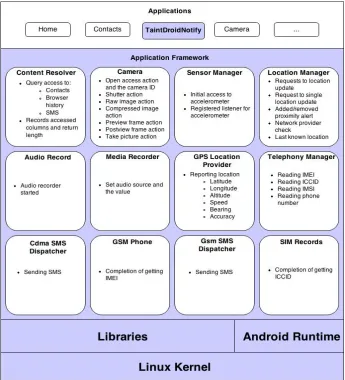
The design of the collection module is composed of two specific imple-mentation components: TaintDroid [27], and sensitive resource listeners. TaintDroid is an information-flow tracking system that was originally de-veloped by Enck et al. [27]. The system automatically labels (taints) data from privacy-sensitive sources. The specific levels of tracking are variable-level, method-variable-level, and file-level. As sensitive information flows through the phone, transitively, the labels are applied and propagated. The current collection module incorporates TaintDroid by utilizing the TaintDroid log-ging and taglog-ging system. As shown in Figure 3.3, the colored areas are modification done by TaintDroid. To support tracking of resource usage within Android, custom listener components were implemented in applica-tion framework layer. The specific components in the applicaapplica-tion frame-work layer are the implemented resource action listeners. These listeners track specific actions that could be performed by each sensitive resource.
With the incorporation of the TainDroid system, there are a total of eleven sources that are being tracked, and the identified sensitive sources are:
• Location
Figure 3.3: Overall data collection module design.
• Microphone
• Phone Number
• Camera
• Accelerometer
• SMS
• IMEI
• ICCID
• Browser History
In Figure 3.3, the components in the application framework layer cor-responds to the specific listeners needed to track the eleven sources listed. There are two types of listeners, one that is responsible only for logging specific actions, and one that is responsible for logging the action as well as returning data gathered from that action. The listeners are implemented through the TaintDroid logging system. For only action specific listen-ers, the resource label and the specific actions are logged in text format. For example, if a third-party process is using the microphone, the taint tag “TAINT MIC” will be logged as will as the action “start recording”. For ac-tion listeners with returning value, the returning value will first be retrieved. The retrieved value is then logged with the tag information as well as the action performed.
Figure 3.3, displays all the components that are necessary to track all the eleven sensitive resources. First, for the location resource, there are multiple things being tracked. The location listeners are implemented in two components: location manager and GPS location provider. Table 3.1, displays the responsible components and various action listeners.
Table 3.1: Location listeners Sensitive Resources Framework Component Listeners
Location
• Location Manager
• GPS Location Provider
• Location update
• Proximity alert
• Network provider check
• Reporting location
the proximity target. The network provider check listener simply checks if the device has the network provider active. The reporting location listener listens to when an actual location read occurred. This listener reports the event and location data: latitude, longitude, altitude, speed, bearing, and accuracy.
Table 3.2: Contacts listeners Sensitive Resources Framework Component Listeners
Contacts
• Content Resolver • Contact read
The contact resource is managed by the content resolver component. Ta-ble 3.2 briefly describes the component and listener. The listener that is responsible for monitoring contact activity is the contact read listener. This listener listens queries to contacts. Aside from recording the event, the ac-cessed column names and the result length is also recorded.
Table 3.3: Microphone listeners Sensitive Resources Framework Component Listeners
Microphone
• Media Recorder
• Audio Record
• Audio recorder initializa-tion
• Audio source and status
For microphone use, there are two components that are responsible for actions. They are Media Recorder and Audio Record. The audio source and status listener is attached to the Media Recorder component. This listener is responsible for recording the event when an audio source is added. This listener also records the added audio source ID. The audio recorder initial-ization listener is implemented in Audio Record component. This listener listens to the microphone initialization event and records the event.
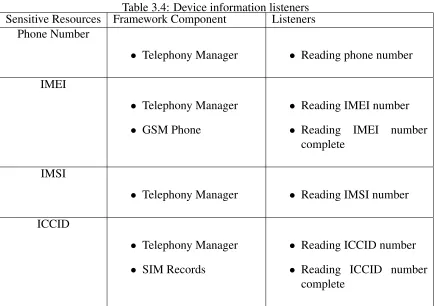
Table 3.4: Device information listeners Sensitive Resources Framework Component Listeners
Phone Number
• Telephony Manager • Reading phone number
IMEI
• Telephony Manager
• GSM Phone
• Reading IMEI number
• Reading IMEI number complete
IMSI
• Telephony Manager • Reading IMSI number
ICCID
• Telephony Manager
• SIM Records
• Reading ICCID number
• Reading ICCID number complete
there is a listener attached in the Telephony Manager component to track the reading event and the resulting accessed value. For IMEI, there is a second listener attached to the GSM Phone component to track the IMEI reading completion event. The ICCID reading completion event follows the same structure as the IMEI reading completion event except that it is implemented in the SIM Records component.
Another resource that is monitored is the camera. The camera utilizes the Camera component in the Android framework layer. This is shown in Table 3.5. There are seven specific listeners attached. The camera initial-ization listener is attached to record the event when the camera is initialized by a third-party application. The other listeners track the specific process that the camera goes through: shutter action, raw image processing, image compression, preview frame and post view frame. Lastly, the take picture action listener records the action of physically taking a picture.
Table 3.5: Camera listeners
Sensitive Resources Framework Component Listeners Camera
• Camera • Camera initialization
• Camera shutter action
• Camera raw image action
• Camera compressed im-age action
• Camera preview frame ac-tion
• Camera post view frame action
• Camera take picture action
Sensor Manager component. Table 3.6 lists the listeners. The main goal here is to monitor the accelerometer initialization and the register of call-back listeners. Thus, the initialization listener is attached to the accelerom-eter initialization process to record the event. For acceleromaccelerom-eter, there are many ways to register listeners; therefore, a separate listener is attached to each register listener method to listen to all registering events.
Table 3.7, displays the framework components and listeners responsi-ble for monitoring the SMS resource. The three components involved are CDMA SMS Dispatcher, GSM SMS Dispatcher, and Content Resolver. In
Table 3.6: Accelerometer listeners Sensitive Resources Framework Component Listeners
Accelerometer
• Sensor Manager • Accelerometer initializa-tion
Table 3.7: SMS listeners
Sensitive Resources Framework Component Listeners SMS
• Cdma SMS Dispatcher
• Gsm SMS Dispatcher
• Content Resolver
• Reading SMS
• Sending SMS
CDMA and GSM SMS Dispatcher, the sending SMS listener is attached. Here, the listener records the event when SMS message were sent out. The reading SMS listener is attached to the Content Resolver component. This listener records the query access to the SMS message table. Along with the event action, the columns queried and the returning length are recorded as well.
Table 3.8: Browser history listeners Sensitive Resources Framework Component Listeners
Browser History
• Content Resolver • Reading browser history
The final resource is browser history. This resource is monitored in the same way as contacts. Table 3.8, shows the specifics. The component in-volved is Content Resolver. The listener attached is the browser history reading listener. This listener is attached to the query access for browser history. Whenever a browser history query is made, the queried columns and returning length are recorded.
3.2.2 Collection Client Module
The collection client module is the component that communicates between the data collection module and the collection server module. Essentially, the client module is the messenger. As can be observed in Figure 3.2, the collection client module resides on the mobile device. This component cap-tures the listener logs, formats the events, and then sends the formatted data to the server module. This module is developed as a third-party applica-tion called TaintDroidNotify. TaintDroidNotify was originally developed by Ench et al. [27]. Modifications were made to support event formatting and server communication. This package resides in the application layer of the Android software stack as seen if Figure 3.3. Specific components and process flow of the client module is shown in Figure 3.4.
Figure 3.4: Overall data collection client module design.
IP address, taint tag, timestamp, and data messages are fetched. This fetched information is then put into a key value format. The formatted message is then sent to the phone device as a notification message or/and sent to the collection server for storage. An example of the data format and the notifi-cation message is shown in Figure 3.5.
Figure 3.5: Example TaintDroidNotify notification.
The method of communication to collection server module is through HTTP POST request. This is done though the use of Android HttpClient. First the HttpClient is initialized. Then a POST request is made to the server module URL. A name value paired list is then used to store the event data. After, the name value paired list is added to the POST request. Finally, the HttpClient attempts the transfer of data by executing the POST request. If the POST was successful, HttpResponse then receives a success response message.
between the collection module and the server module to carry on seamlessly. The next section will discuss the implementation details of the collection server module.
3.2.3 Collection Server Module
The final component of the privacy sensitive resource monitoring system is the server module. The server module is responsible for receiving incoming message strings, processing the message strings, and inserting them into the database. Figure 3.6, explains the overall server module components and process flow.
Figure 3.6: Overview of collection server module design and process flow.
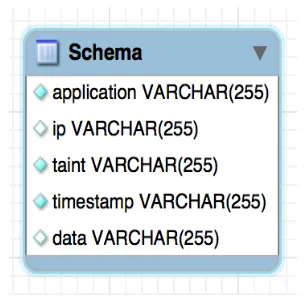
this server module, the application layer is written in PHP to interface with the MySQL database. The application layer establishes connection with the MySQL database using user and password security checks. This layer also handles the parsing of incoming POST requests. The POST messages are formatted to fit into the MySQL database schema. The schema is shown in Figure 3.7.
Figure 3.7: MySQL database schema.
Finally, the schema defines the MySQL database. The schema follows a very structured layout. There is only one table in the database, since all income messages are of the same type. There are a total of five columns in the table. These five columns correspond to the key value structure setup in the collection client module. The application column stores the application name of each triggered event. The IP column stores the IP addresses of the triggered events. The taint column is the column specifying the type of resources that were accessed. Timestamp column records the exact moment when the resource event was triggered. Finally, the data column records extra data passed in by the implemented listeners.
analyzed.
This concludes the overall design and implementation of the privacy sen-sitive resources monitoring system. The next section discusses the test ap-plication design and final verification against the requirements.
3.3
Test Application Design and Implementation
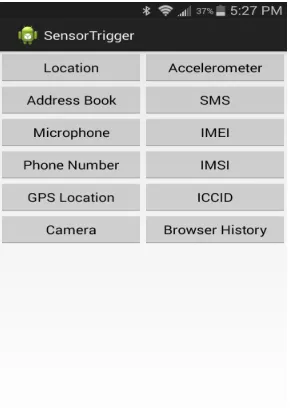
[image:43.612.238.383.377.581.2]A test application was created to verify the overall functionality of the sys-tem. The specific focus of the test application is to mimic third-party appli-cation processes and test the resource listeners implemented in the Android application framework layer. The overall design concept is based on the onClickListener object. For each defined third-party application process, an onClickListener object is created to trigger that specific action. The result-ing application that was created is named SensorTrigger, and a screenshot of the application is shown in Figure 3.8.
Figure 3.8: SensorTrigger application display.
Table 3.9: Location based resourse test Sensitive
Re-sources
Tested Listeners SensorTrigger But-tons SensorTrigger Actions Location • Location update • Network Provider check
• Reporting loca-tion
• Location
• GPS Loca-tion
• Request location update
• Request get last known location
• Request GPS/Network check
location reporting and the other was used to test GPS based location report-ing. These onClicklisteners trigger separate background location reporting services. Both services are triggered to be active for twenty-five seconds to allow their services to complete the location reporting cycle. A complete match between location resource listeners tested and SensorTrigger actions performed are displayed in Table 3.9.
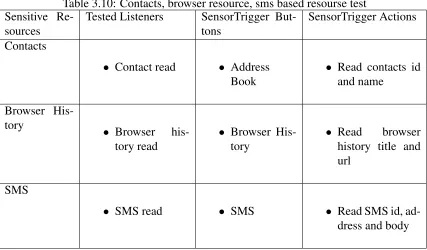
Next, for triggering events by contacts, browser history, and SMS related resources, three separate onClickListeners were created. Table 3.10 displays the complete match between contacts, browser history, and SMS resource listeners tested and SensorTrigger actions performed. These triggers are implemented using the same process. First, request columns are defined. Then a Cursor object is created to query the specific resource.
The next resource tested was the microphone. For the microphone, an onClickListener is created to perform the recording action. First, a Me-diaRecorder object is created. With this MeMe-diaRecorder object, the audio source, output format, output file name, and audio encoder are set. After the microphone is set to start and record for five seconds. After the five seconds, the microphone is turned off and the resource is released. Table 3.11, shows the specific actions performed as well as the listeners tested.
Table 3.10: Contacts, browser resource, sms based resourse test Sensitive
Re-sources
Tested Listeners SensorTrigger But-tons
SensorTrigger Actions
Contacts
• Contact read • Address Book
• Read contacts id and name
Browser
His-tory •
Browser his-tory read
• Browser His-tory
• Read browser history title and url
SMS
• SMS read • SMS • Read SMS id,
ad-dress and body
The implementation of the accelerometer resource triggers follows a simi-lar structure as the location based trigger implementation. Table 3.12, dis-plays the accelerometer based resource actions and listeners. For imple-mentation, first, an onClickListener is created for the accelerometer trig-ger. Then, a background service is created to perform accelerometer-based actions. Within the service, SensorManager is created with accelerometer added as the default sensor. Accelerometer listeners are also registered to retrieve accelerometer readings.
Table 3.11: Microphone based resource test Sensitive
Re-sources
Tested Listeners SensorTrigger But-tons
SensorTrigger Actions
Microphone
• Audio recorder initialization
• Audio source and status
• Microphone • Initialize audio recorder
Table 3.12: Accelerometer based resource test Sensitive
Re-sources
Tested Listeners SensorTrigger But-tons SensorTrigger Actions Accelerometer • Accelerometer initialization • Registered listener for accelerometer • Accelerometer
• Initialize ac-celerometer
• Register listener for sensor change events
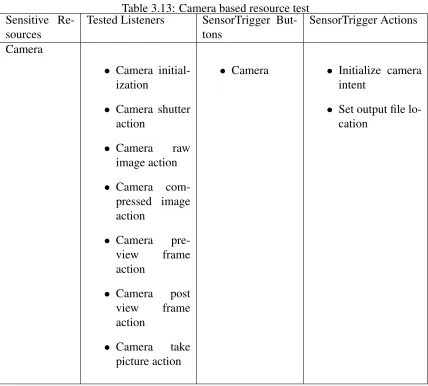
The camera resource test implementation was a little different from the rest of the resource test implementations. The camera resource test utilizes the Android intent action. The intent triggers the Camera application on the Android device. With the triggered Camera application, user has to per-form the listener-based actions to evaluate the results. Specifically, the user is required to take a picture using the Camera application on the Android device. Table 3.13, displays camera resource based listeners and specific actions taken by the SensorTrigger application.
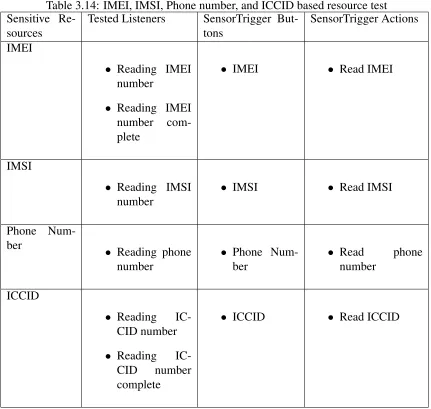
Finally, for resources such as IMEI, IMSI, ICCID, and phone number, since they all utilize the same type of resource their trigger implementations are all similar. They all use the TelephonyManager class, thus a onClick-Listener and a TelephonyManager object are created for each resource. The specific tasks performed are simply read access. This is shown in Table 3.14.
Table 3.13: Camera based resource test Sensitive
Re-sources
Tested Listeners SensorTrigger But-tons
SensorTrigger Actions
Camera
• Camera initial-ization
• Camera shutter action
• Camera raw image action
• Camera com-pressed image action
• Camera pre-view frame action
• Camera post view frame action
• Camera take picture action
• Camera • Initialize camera intent
Table 3.14: IMEI, IMSI, Phone number, and ICCID based resource test Sensitive
Re-sources
Tested Listeners SensorTrigger But-tons
SensorTrigger Actions
IMEI
• Reading IMEI number
• Reading IMEI number com-plete
• IMEI • Read IMEI
IMSI
• Reading IMSI number
• IMSI • Read IMSI
Phone Num-ber
• Reading phone number
• Phone Num-ber
• Read phone
number
ICCID
• Reading IC-CID number
• Reading IC-CID number complete
• ICCID • Read ICCID
Chapter 4
Results and Discussions
The privacy sensitive resource access monitoring for Android systems is a dynamic resource action listening system. The system is capable of identi-fying and observing direct accesses of third-party applications to sensitive resources on the phone. The recorded events are composed of name of source application, type of resource being accessed, IP address if the ac-cessed information was sent out, a timestamp of when the resource was accessed, and finally a message body of the specific recorded action.
Relative to the original problem statement: Given the need and benefits of background services accessing mobile resources, there are both security and privacy risks. The primary motivation behind the implementation of the overall system and data collection is to demonstrate some interesting application behaviors and the potential usage of the application behavior data collection process. Specifically, application behaviors will be observed through the analysis of sensitive resource utilization, access intensity, and sequence based analysis. Potential usage of the interesting findings will also be discussed. This section will start with experiment setup followed by analysis of results.
4.1
Experiment Setup
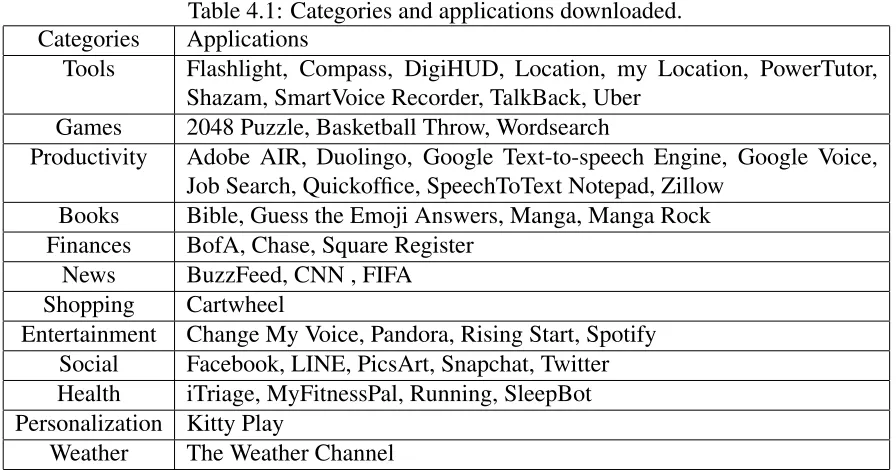
Table 4.1: Categories and applications downloaded. Categories Applications
Tools Flashlight, Compass, DigiHUD, Location, my Location, PowerTutor, Shazam, SmartVoice Recorder, TalkBack, Uber
Games 2048 Puzzle, Basketball Throw, Wordsearch
Productivity Adobe AIR, Duolingo, Google Text-to-speech Engine, Google Voice, Job Search, Quickoffice, SpeechToText Notepad, Zillow
Books Bible, Guess the Emoji Answers, Manga, Manga Rock Finances BofA, Chase, Square Register
News BuzzFeed, CNN , FIFA Shopping Cartwheel
Entertainment Change My Voice, Pandora, Rising Start, Spotify Social Facebook, LINE, PicsArt, Snapchat, Twitter Health iTriage, MyFitnessPal, Running, SleepBot Personalization Kitty Play
Weather The Weather Channel
The idea behind picking the applications shown in Table 4.1 is to observe as many types of applications as possible. The applications downloaded are all popular applications in each of their categories displayed. The hope is that different types of applications behave in a different ways. After the applications were installed, two different data collection process were performed. The two different data collection processes were passive data collection and active data collection. The idea was to observe behavioral differences of third-party application in a passive environment as well as an active environment. The later subsections discuss the collection process setup for collecting both passive and active data.
4.1.1 Passive Data Collection
day. Thus, the four hour time frame chosen to provide a sufficient amount of data for analysis as well as capture the essential behavior of third-party applications in a passive mode.
With the chosen time frame, the following steps were taken to initiate the collection process:
1. Turned on the Nexus 4 device with installed applications and im-plemented data collection system
2. Started TaintDroidNotify application to enable the collection pro-cess
3. Left the phone without further user interaction for four hours
4. Turned off the TaintDroidNotify application to end the collection process
The collected data were then examined and observed in the MySQL database setup. The next subsection will discuss the setup for active data collection.
4.1.2 Active Data Collection
The active data collection is a bit more complicated than the passive data collection. The goal of active data collection is to capture third-party ap-plication behaviors when the user is actively interacting with the mobile device. The environment setup is to mimic that of a real user in a typical day. In this experiment, no real human study subjects were used. For the setup design, there were two main considerations: time window of exper-imentation and types of activities. First, to make the comparable between the passive and active data, the time frame window for collection was also set to be four hours. Secondly, to best mimic a typical user in a four-hour time frame, a set of specific actions was defined and carried out.
most intensive activity is talking, which dominated the twenty-eight percent of the fifty-eight minutes. The rest of the activities are as follows: texting (twenty-one percent), social networking (seventeen percent), web browsing (fifteen percent), gaming (nine percent) and others (ten percent) [7].
In order to mimic the behavior of a typical user in a four-hour time frame, the fifty-eight minutes used by an average user in a day had to be further divided. Intuitively speaking, out of twenty-four hour period, on average, eight hours are spent sleeping and the other eight hours are allocated to working. Essentially, most of the fifty-eight minutes spent on the phone by an average user would be spent in an eight-hour time window. The exact breakdowns of time spent on each activity is shown in Table 4.2.
The activities performed and the duration of time for this experiment are so follows:
1. Turned on the Nexus 4 device with installed applications and im-plemented data collection system
2. Started TaintDroidNotify application to enable the collection pro-cess
3. Four minutes (passive)
4. Used LINE application to text
5. Browsed the internet for two minutes and sent two texts
6. Eight minutes (passive)
7. Checked Facebook for five minutes and sent two texts
8. Eighteen minutes (passive)
9. Played Basketball Throw for five minutes and sent two texts
10. Nine minutes (passive)
11. Sent one text
13. Read CNN for two minutes and sent two texts
14. Eight minutes (passive)
15. Checked Twitter for one minute and sent one text
16. Thirty four minutes (passive)
17. Browsed for two minutes and sent two texts
18. Seven minutes (passive)
19. Checked Twitter for two minutes and sent two texts
20. Fifty-four minutes (passive)
21. Checked Twitter for one minute and sent one text
22. Forty-seven minutes (passive)
23. Turned off the TaintDroidNotify application to end the collection process
Table 4.2: User interaction activity time breakdown. Activity Type Utilization
Percent-age
Utilization Minutes Actual Minutes
Talk 28 16.8 0
Text 21 12.6 9
Social 17 10.2 9
Web Browsing 15 9 4
Games 9 5.4 5
Other 10 6 2
talking activity could not be performed. Also, this experimental setup is only simulating one particular use case of a typical smartphone user; by no means does it represent all of the average smartphone users.
This concludes the experiment setup section. The next section discusses interesting findings and results of this data collection process.
4.2
Results
The collected results are analyzed based on three categories: resource uti-lization, resource access intensity, and activity based sequential analysis. Specifically, the passive data collected are analyzed and compared to the active data. Interesting behaviors and discoveries are discussed in this sec-tion.
4.2.1 Privacy Sensitive Resource Utilization
The motivation behind sensitive resource utilization observation is to profile each individual third-party application process and/or the category of appli-cation in terms of access volume and accessed resource. In terms of privacy sensitive resource utilization, third-party application process access levels and categories of third-party application process access levels, as well as re-source access levels are analyzed. These analyses were run on both passive and active data collected.
Figure 4.1: Number of sensitive resource accesses made by each third-party application passively.
On the other hand, Figure 4.2 displays the resource access attempts made by third-party applications in a active mode. The figure is displayed in the same format as Figure 4.1. As can be observed in Figure 4.2, the total num-ber of resource accesses is dominated by the Weather Channel application. Applications like Facebook, Twitter, Google services, and Android system processes follow right after. Applications with the least amount of utiliza-tion are: Keyboard, Phone, FIFA, Sleepbot, Nike Plus, Pandora, and LINE. One interesting observation in the active case is that, numerous third-party applications have separate process names for different services being car-ried out. For example, Twitter has two different processes shown in Figure 4.2. One of the process is named com.twitter.android and the other is named com.twitter.android:MediaService.
Figure 4.2: Number of sensitive resource accesses made by each third-party application actively.
processes that run in the background even when the application was never initiated in the foreground. In summary, the volume and number of third-party application processes are partly driven by user interaction and partly driven by the applications themselves.
To observe the correlation between the category of applications and the number of resource access attemps, the third-party applications found in Figure 4.1 and 4.2 are classified into different categories. The categoriza-tion is mainly based on Table 4.1. The identified categories are Android, en-tertainment, Google, lifestyle, news, references, social and weather. Some of the categories such as Android and Google are categorized based on the different processes collected since there are no specific applications down-loaded for them.
Figure 4.3: Number of sensitive resource accesses made by different categories of third-party application passively.
lifestyle, and entertainment.
For the active case the number of sensitive resource access attempts achieved by each defined category was shown in Figure 4.4. The graph layout is the same structure as Figure 4.3. In Figure 4.4, the weather and Google categories dominates the graph followed by social and Android cat-egories. The minimum sensitive resources accessed in the active mode is the entertainment category.
Figure 4.4: Number of sensitive resource accesses made by different categories of third-party application actively.
activity with the most minutes spent is social, thus, the extreme increase in resource access attempts in the social category makes sense.
Figure 4.5, shows the passive access count attempts in terms of resources utilized. The x-axis shows the type of sensitive resources accessed, and y-axis shows the number of access attempts made. The color scheme cor-responds to the categories of applications previously defined. Location, address book, and GPS location are resources that are being utilized the most. Most of the location, address book and GPS location resources access attempts are made by application categories such as weather, social and Google. Device identification related resources seem to be accessed a mod-erate amount as well. Applications in the Google and reference categories seem to utilize device identification related resources the most.
Figure 4.5: Passive utilization of types of resources in terms of categories of third-party application processes.
specific column, all categories of resources utilized it.
Figure 4.6: Passive utilization of types of resources in terms of categories of third-party application processes.
[image:60.612.92.523.403.619.2]of resources used, application usage drives the type of resources accessed. In the active set, there are a total of four resource groups added. The actively triggered resources are: browser history, camera, microphone input, and phone number. The type of user activity triggered during the experiment drives these extra resources.
Overall, it can be concluded that user interactions drive the type and vol-ume of resource access attempts. This is demonstrated through resources access counts in terms of third-party application processes, categories, and resources. The resources being accessed do not necessarily belong to a spe-cific type of applications; however, there are special cases where a certain type of application only access specific resources. The Weather Channel ap-plication is an example. This resource utilization analysis could be used to profile categories of applications. The comparison of passive and active data can also be used to determine user actions. The next subsection discusses intensity in terms of sensitive resource access.
4.2.2 Privacy Sensitive Resource Access Intensity
This section examines the resource access intensity of different categories of applications. The analysis first observes the heat map of resource access intensity in the passive and active case. Then, the analysis is followed by a comparison of total, application, and resource access intensity. Next, the access intensity of each application category is then graphed to observe pat-terns and behaviors. Finally, specific cases of the impact of user-interaction to access intensity are observed.
Figure 4.7: Intensity heat map of passive resource access attempts.
Figure 4.8: Intensity heat map of active resource access attempts.
[image:62.612.96.527.366.577.2]of the access intensities are pretty spread due to the type of activity that was performed during the experiment.
Comparing the passive and active case, there are many differences. With each triggered activity, there is an increase accessed resource type. For ex-ample, social category in the passive case accessed only location, address book, and GPS. In the active case, resources such as camera, IMEI, micro-phone, and phone number are all resources accessed in addition. The heat map of the active case has a more spread-out look and dominated by multi-ple high intensity areas. In summary, user induced actions drive the type of resources accessed and the access intensity.
Figure 4.9 displays the passive intensity comparison of total access, ap-plication category access, and resource access over times. The y-axis shows the number of access attempts. The x-axis is the time line of the exper-iment. The top, middle, and bottom graphs display the total application access intensity; application categories access intensity, and resource access intensity overtime respectively. For all three graphs, there is an initial sort of access, and this is due to the initial startup of the Android system. Overtime, that extreme intensity dies down and peaks again periodically. The periodic peaks are mainly driven by the weather application acquiring location-based access.
For the active case, the intensity comparison is displayed in Figure 4.10. Here, sharp peaks that occur randomly characterize the behaviors of differ-ent access intensities overtime. The randomness is mainly driven by user interaction at that specific moment. Categories with extreme high peaks are Google and social. The types of resources that seem to be accessed dur-ing those times are address book, location, and GPS. In summary, the exact moment of user interaction determines the access intensity of application category as well as resource accessed.
Figure 4.9: Intensity summary graph of passive resource access attempts.
Figure 4.10: Intensity summary graph of active resource access attempts.
[image:64.612.93.524.362.575.2]and Android. Periodic peaks characterize them. The reference category seems to have an obscure behavior. This would require further analysis.
Figure 4.11: Intensity of passive resource access attempts by application categories.
[image:65.612.96.526.424.636.2]The active case of the access intensity by application categories is dis-played in Figure 4.12. In the active case, categories such as entertainment, lifestyle, news, and reference behave the same way. For them, there are periodic sensitive resource access attempts when the application is not run-ning in the foreground. These periodic sensitive resource access attempts are then followed by extreme peaks recording an event where the user has actively interacted with these applications. Application categories such as Android, Google, and social behave in another way. These categories are characterized by small continuous resource access attempts followed by ex-treme peaks signaling user interaction. Lastly, the weather category graph resembles a zigzag line. It is characterized by close high resource access in-tensity followed by low resource access inin-tensity. Overall, the active case is driven by user interaction, and it builds on the intensity of the passive case.
Figure 4.13: Intensity comparison between specific passive and active application cate-gories.
performed, they were also marked on the active graph. As seen on the graph, user interactions have a correlation with sensitive resource access intensity. Throughout intensity analysis, there are a few things that can be ob-served. First, each application category has its access intensity behavior. This access intensity behavior differs between the passive and active case. They differ in the sense that, the active access intensity builds on existing passive access intensity model. Finally, much like resource utilization, the access intensity level is also driven by user interaction.
4.2.3 Network Traffic Analysis
[image:67.612.94.495.367.583.2]Aside from sensitive resource utilization and access intensity analysis, the data collected also enable network traffic analysis in terms of application, application categories, and resources. This section discusses the outbound network traffic that contains sensitive information.
Figure 4.14: Passive application network traffic.
Figure 4.15: Active application network traffic.
internal resource access. As could be observed, most resources have both internal and external activity. However, Facebook and Twitter seem to have only outbound traffic. Facebook is the most outbound intensive application. The active case is displayed in Figure 4.15. With user interaction, there is an increase in outbound network traffic. For the most part applications have both internal and external traffic. Applications such as Facebook and Twitter that did not have an internal traffic shown in Figure 4.14, now have both internal and external traffic shown.
In terms of application category, the graphs summarize the network traf-fic of each individual application. The passive category analysis is displayed in Figure 4.16. The most outbound traffic intensive application category is social, where one hundred percent of the resource activities were outbound traffic. On the other hand, weather and Android application categories are mostly dominated by internal activities.
example, the news category changed from two in the passive case to seventy-eight in the active case. Definitely, the type of user action is positively related to outbound network traffic activity.
Figure 4.16: Passive application network traffic in terms of application categories
[image:69.612.99.484.439.654.2]![Figure 2.1: Interaction of students in the MIT community (figure extracted from Dong etal, [8]).](https://thumb-us.123doks.com/thumbv2/123dok_us/103356.9648/17.612.185.445.155.417/figure-interaction-students-mit-community-gure-extracted-dong.webp)
![Figure 2.2: Android software stack (figure extracted from Android security overview, [1]).](https://thumb-us.123doks.com/thumbv2/123dok_us/103356.9648/20.612.97.525.270.583/figure-android-software-gure-extracted-android-security-overview.webp)